Destinations › Europe · The Destination Index · universal template · every figure sourced
Belgium.
Western Europe, bordering the North Sea, between France and the Netherlands. 30,528 sq km and 11,941,781 people, 66 km of coastline, temperate; mild winters, cool summers; rainy, humid, cloudy.
Region · EuropePopulation · ~11,941,781Languages · Dutch, French, German. All three officialEco Index · 67/100 · Passable
The Eco Index across 12 pillars · scored 0 to 5 · World Bank, OWID, WHO/UNICEF JMP, FiBL, Protected Planet, IUCN, UNESCO (2023-24)
Conservation
Wildlife
Water
Food & farming
Organic & clean
Climate & energy
Waste
Health
Heritage
Ownership
Governance
Future
The History of Belgium.
Belgium sustains a notable living folk heritage, most famously the Carnival of Binche, whose Gilles parade in wax masks and ostrich-feather hats on Shrove Tuesday, a tradition inscribed by UNESCO. Processional giants and dragons, the Ducasse of Mons and the Holy Blood Procession in Bruges continue as community rituals, and Belgian beer culture is recognised as intangible heritage.
Where the name comes from
From the Belgae, the peoples Rome recorded across this region, which gave the Roman province of Gallia Belgica its name. Source: UK Permanent Committee on Geographical Names toponymic factfile.
The land itself: flat coastal plain in the north west, rolling hills through the centre, and the forested Ardennes in the south east. Its high point is Botrange, 694 m. Source: UK Permanent Committee on Geographical Names toponymic factfile.
Where it starts
A Neanderthal heartland
The caves of the Meuse valley hold one of the densest records of Neanderthal life anywhere in Europe, at Scladina, Goyet and Spy. Two adult skeletons found at Spy in 1886 helped prove that Neanderthals were a distinct human population, and recent redating places their disappearance from this region between about 44,200 and 40,600 years ago. Later, the Neolithic flint mines at Spiennes near Mons were worked for two thousand years from around 4300 BC and are among the largest and earliest in Europe.
How it got here
Cloth, independence, and the Congo
The region was incorporated into the Roman world as Gallia Belgica, which gives the country its name. From the twelfth century Bruges, Ghent and Ypres became among the richest cities in Europe on wool and cloth. Belgium became independent from the Netherlands in 1830. Between 1885 and 1908 the Congo was held as the personal property of King Leopold II, a regime of forced rubber collection in which millions died, before the Belgian state took it over. The Congo became independent in 1960.
The timeline
c. 130,000 to 40,000 years ago
Neanderthal country.
The Meuse valley caves hold one of the densest records of Neanderthal life in Europe, at Scladina, Goyet and Spy. The two adult skeletons found at Spy in 1886 helped prove that Neanderthals were a distinct human population. ↗
c. 44,200 to 40,600 years ago
The last Neanderthals.
Redating places the disappearance of Neanderthals in this region earlier than long assumed. ↗
c. 4300 BC
Spiennes.
Neolithic flint mines near Mons, worked for two thousand years, are among the largest and earliest in Europe. ↗
57 BC onward
Gallia Belgica.
The region is incorporated into the Roman world and gives the country its name. ↗
1100s to 1500s
The cloth cities.
Bruges, Ghent and Ypres become among the richest cities in Europe on wool and cloth. ↗
1830
Independence.
Belgium separates from the Netherlands in 1830 after a revolt that began in Brussels, driven by a Belgian national movement. ↗
1885 to 1908
Congo Free State.
The Congo is held as the personal property of King Leopold II, a regime of forced rubber collection in which millions died, before the Belgian state took it over. ↗
1960
Congolese independence.
The Republic of the Congo becomes independent on 30 June 1960, ending Belgian colonial rule and, before that, King Leopold II's personally held Congo Free State. ↗
Terrestrial protected areas cover 16.3 per cent of Belgium (World Bank), with Natura 2000 sites at roughly 12.7 per cent of land, below the EU average. About 37 per cent of the small Belgian North Sea is designated protected under the Marine Spatial Plan across five sites, though these are limited in absolute terms and the effectiveness of such paper protections is debated. Conservation is moderate rather than expansive in this crowded landscape.
Is wild Belgium protected? 16.4% of the land is, against a 30% target for 2030
How protected is nature in Belgium?
Forest cover22.6%
Terrestrial protected area16.3%
Marine protected area38.3%
33 (mammals, birds, fish & plants) listed as threatened.
3 mammal species recorded here are on the IUCN threatened list (2022, World Bank / IUCN Red List).
Birds · 8
8 bird species recorded here are on the IUCN threatened list (2022, World Bank / IUCN Red List).
Fish · 19
19 fish species recorded here are on the IUCN threatened list (2022, World Bank / IUCN Red List).
Plants · 3
3 plant species recorded here are on the IUCN threatened list (2022, World Bank / IUCN Red List).
Species named here are drawn from GBIF occurrence records for Belgium filtered to the IUCN Red List threatened categories. Species are listed where GBIF holds occurrence records for them in this country. Record counts are not published here because the figure cannot be reproduced from a public GBIF query.
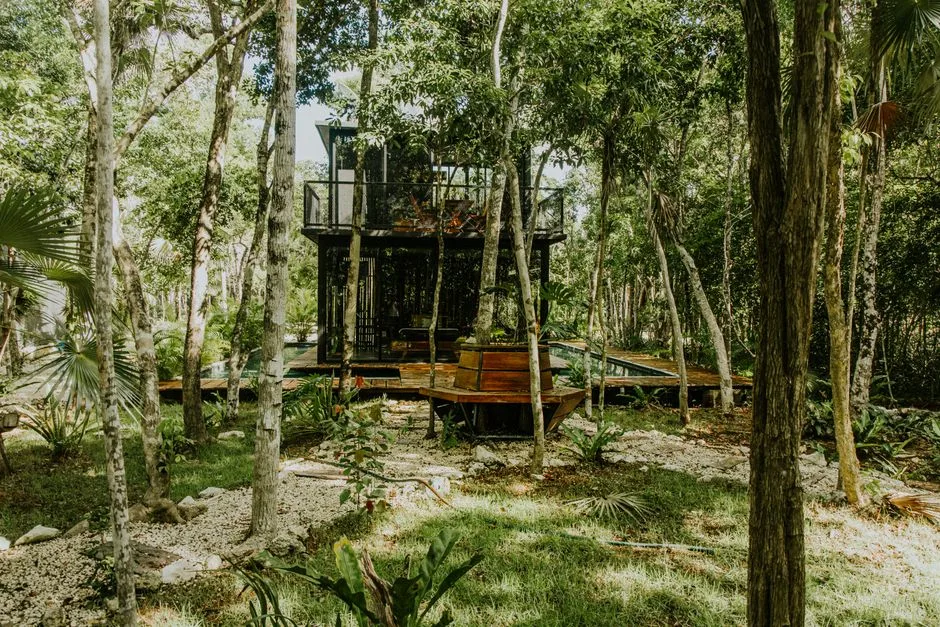
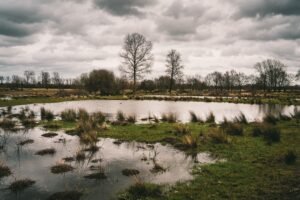
Nature reserve in West Flanders, mapped and named in the open record for Belgium. OpenStreetMap.
Water and Ocean in Belgium.
Belgium draws its freshwater from the Meuse and Scheldt river basins plus groundwater and reservoirs, and delivers safely managed drinking water to 99.91 per cent of the population (World Bank/JMP). Despite that excellent safety record, the country has low renewable freshwater resources per head and high population density, and is regularly ranked among Europe's more water-stressed nations. Supply is reliable but not abundant.
Does Belgium have enough fresh water? Under pressure
99.5% of people here have safely managed drinking water at home (2024, WHO/UNICEF JMP). Tap water is safe for a visitor nearly everywhere.
Cleanest water: The Ardennes uplands, headwaters of the Meuse, Ourthe and Semois.
How much fresh water does Belgium have, per person?
1,027 m³
Belgium
1,000 m³
the UN “water scarce” line
Belgium withdraws about 4,300 million cubic metres of fresh water a year (2022). That is 52.8% of the fresh water actually available to it, which FAO counts as high water stress. Of what is taken, farming takes 1%, homes and towns 15%, industry 84%. Source: FAO AQUASTAT.
What are the rules on Belgium beaches?
✓Tap water: Drinkable.
✓Plastic rules: The EU Single-Use Plastics Directive has applied since July 2021, banning single-use plastic straws, cutlery and plates, with regional bans on free carrier bags..
✓Solo travel: rated easy on the record for this destination.
✓Marine protection: 36.65% of the sea is protected. The 30x30 pledge is met.
Where does the sewage go?
94.9%
of people have safely managed sanitation
94.9% of people here use a safely managed sanitation service, meaning waste is contained, emptied and treated rather than reaching the ground or the sea untreated (2024, World Bank / WHO-UNICEF JMP, SDG 6.2.1). That is close to universal coverage.
How is the sea around Belgium doing?
One cross-section, every answer measured.
Surface
What the coast carries
Mild and rainy; summer days are long and the Ardennes are cool.
Nearshore
Protected water
38.3% of territorial waters are protected, against the 30% pledged for 2030 under the Global Biodiversity Framework.
Cleanest
Where the water is cleanest
The Ardennes uplands, headwaters of the Meuse, Ourthe and Semois..
The record
Measured
Belgium draws its freshwater from the Meuse and Scheldt river basins plus groundwater and reservoirs, and delivers safely managed drinking water to 99.91 per cent of the population (World Bank/JMP). Despite that excellent safety record, the country has low renewable freshwater resources per head and high population density, and is regularly ranked among Europe's more water-stressed nations.
Sea protected
36.65%
Against the 30% pledged for 2030 under the Global Biodiversity Framework.
Threatened species
33 (mammals, birds, fish & plants)
Mammals, birds, fish and higher plants on the IUCN list.
Cleanest water
here
The Ardennes uplands, headwaters of the Meuse, Ourthe and Semois..
Is the tap water safe in Belgium?
99.5% of people have safely managed drinking water at home (2024, WHO/UNICEF JMP). Renewable fresh water works out at about 1,027 cubic metres per person a year (World Bank).
How hard is the water supply being pushed?
Of every 10 buckets nature refills, 5 are already taken. Withdrawals run at 52.8% of what Belgium renews internally each year (2022, World Bank / FAO AQUASTAT). That is past the 25% mark generally treated as water stress, so the supply is being pushed towards its limit.
When is the best time to visit Belgium? Tap your month.
Tap your month.
JanFebMarAprMayJunJulAugSepOctNovDec
.
How much fresh water does Belgium actually have?
Nature renews about 1,027 cubic metres of fresh water per person per year here. That ranks Belgium 61 of 208 countries measured, putting it in the drier half of the world. The UN treats anything under 1,000 cubic metres as water scarce, and this is above that line. World Bank / FAO AQUASTAT.
Belgium is intensively farmed and runs an agri-food trade surplus, exporting far more processed food than it imports in value, even though food makes up about 11.5 per cent of merchandise imports as raw crops and feed flow through its ports (World Bank). It is a major producer of potatoes, pork, dairy, sugar beet and horticulture, and a world-leading exporter of frozen chips and prepared vegetables. Self-sufficiency in staples is high but the system leans on imported animal feed.
Where does the food in Belgium come from?
11.8% imported
about US$63,518m a year
On the plate: Potatoes and frites, moules-frites, chicory (witloof), Brussels sprouts, waffles, chocolate and beer.
How often each food is on the plate
Share of people eating each one regularly. These overlap, so they do not add up to 100%.
Potatoes60%
Frites51%
Moules-frites42%
Brussels sprouts24%
Waffles15%
1 of 10
bites are imported
The island buys in more food energy than it eats. About US$63,518m a year leaves the country to pay for it. The green slice is roughly what still grows here.
About 11.8% of everything Belgium buys in from abroad is food, roughly 1 in every 10 imported items on the dock (2024, World Bank). Farming itself is 0.7% of the economy and 44.4% of the land is agricultural, of which 28.3% is arable. The green slice is roughly what still grows here.
What is killing people in Belgium? The imported diet.
Cause of death, and the diet behind it.
Non-communicable diseases, all combined75.9%
Diabetes5.9%
Adults living with overweight or obesity. 51.1%.
Can Belgium feed itself?
28.3%
Arable land
44.4%
Agricultural land
53,800
Farmers
2,132,896
Arable acres
0.7%
Agriculture, share of GDP
Harvest: Temperate, with potatoes and sugar beet in September and October, chicory and Brussels sprouts into winter, and asparagus in spring.
Feeding itself
Belgium is intensively farmed and runs an agri-food trade surplus, exporting far more processed food than it imports in value, even though food makes up about 11.5 per cent of merchandise imports as raw crops and feed flow through its ports (World Bank). It is a major producer of potatoes, pork, dairy, sugar beet and horticulture, and a world-leading exporter of frozen chips and prepared vegetables.
Certification
Organic farming covers about 7.6 per cent of Belgium's utilised agricultural area (Eurostat/EEA), but with a sharp regional split: Wallonia is at 12.7 per cent and aiming for 30 per cent by 2030, while intensively farmed Flanders sits near 1.6 per cent. The national average is solid for a densely farmed country.
Water for crops
Belgium draws its freshwater from the Meuse and Scheldt river basins plus groundwater and reservoirs, and delivers safely managed drinking water to 99.91 per cent of the population (World Bank/JMP). Despite that excellent safety record, the country has low renewable freshwater resources per head and high population density, and is regularly ranked among Europe's more water-stressed nations.
Why the organic number looks like that. Certified-organic farmland is not separately reported for Belgium, and that is a certification gap rather than proof nothing is grown cleanly. What the official land record does show: 44.4% of the country is agricultural land and 28.3% is arable (2023, World Bank). Certification is paid for per farm per year by a foreign body, which prices out smallholders, so the organic number reads worse than the practice.
What actually grows here
Sugar beetsPotatoesWheatLettuceMaizeBarleyPears
The food that already fits
The plant-based kitchen here is not an import. By tonnage, the largest crops grown in Belgium are green maize, sugar beet, potatoes and wheat (Eurostat, crop production, 2024). That is what the land itself puts on a plate.
Belgium emits about 7.2 tonnes of CO2 per person, a moderate level for a wealthy industrial economy, and its power sector is fairly low-carbon thanks to a large nuclear share (33.1 per cent in 2025) alongside renewables at a record 38.9 per cent of generation in the same year. The country is coal-free in electricity and is bound by the EU climate framework, including net zero by 2050 and steep 2030 targets. A long-planned nuclear phase-out has been partly delayed to protect low-carbon supply. Mid-level emissions place it firmly in the middle band.
What powers Belgium?
Renewable 38.9%Fossil 28%
Climate pollution per person
The safe amount, what the planet can absorb
2 tonnes
One person here
7.31 tonnes
The world average, for comparison
4.7 tonnes
The worst it ever got
15.1 tonnes
The grid
Belgium emits about 7.31 tonnes of CO2 per person, a moderate level for a wealthy industrial economy, and its power sector is fairly low-carbon thanks to a large nuclear share (about 41 per cent in 2023) alongside renewables at a record 38.9 per cent of generation in 2025. The country is coal-free in electricity and is bound by the EU climate framework, including net zero by 2050 and steep 2030 targets.
Pollution
EU Single-Use Plastics rules apply and packaging is tightly managed, but dense road traffic and the Antwerp port and petrochemical cluster, one of the world's largest, drive local air, industrial and PFAS pollution. The population-weighted PM2.5 mean was about 7.5 micrograms per cubic metre in 2024 (IRCEL), still above the WHO guideline of 5.
Water stress
Belgium draws its freshwater from the Meuse and Scheldt river basins plus groundwater and reservoirs, and delivers safely managed drinking water to 99.91 per cent of the population (World Bank/JMP). Despite that excellent safety record, the country has low renewable freshwater resources per head and high population density, and is regularly ranked among Europe's more water-stressed nations.
What pollutes most here
1The gridThe share of electricity still generated from fossil fuel.70.2%
2IndustryThe Antwerp port and petrochemical cluster, a source of air and PFAS pollution..named
3AirModelled annual mean against a WHO guideline of 5 µg/m³.7.5
4On the recordEU Single-Use Plastics rules apply and packaging is tightly managed, but dense road traffic and the Antwerp port and petrochemical cluster, one of the world's largest, drive local air, industrial and PFAS pollution.
What has Belgium promised on climate?
Net zero, whole economy2050
Electricity renewable today23.5% (2021)
Land protected, against a 30% target16.4% by 2025
Sea protected, against a 30% target38.3% by 2025
The net-zero target year on file with Climate Watch is 2050, status: in policy document. Measured against it, 23.5% of electricity is already renewable (2021, World Bank), so 76.5% of the grid is still to be converted. The pledge on file is measured here against what has actually been delivered, not taken on its own (UNFCCC NDC Registry, CBD Kunming-Montreal Target 3).
The biggest line item
One return flight against a whole year of living.
A resident's entire year7.31 t CO2e
Safe-climate budget, per year2 t CO2e
Sydney return, economy3.01 t CO2e
Singapore return, economy1.9 t CO2e
Los Angeles return, economy1.63 t CO2e
Johannesburg return, economy1.61 t CO2e
New York return, economy1.06 t CO2e
How much CO2 does flying to Belgium emit?
Tap where you would fly from. One return flight, economy.
Every prompt runs on a machine in a building on somebody’s grid. What that costs the planet depends less on the prompt than on what is burning to power it. Here is what would power one in Belgium.
Data centres
42
Registered colocation and interconnection facilities, PeeringDB, 2026
Grid renewable
38.9 %
What a machine here runs on.
What powers a data centre in Belgium?
Most of the power behind a machine here is still burned.
Renewable 38.9%Fossil 61.1%
Cooling water. Every one of those halls runs on the national grid, which is 23.5% renewable today (World Bank). A data centre is only as clean as the electricity behind it, so the same figure that decides this country's climate score also decides the footprint of the AI running inside it. Cooling water use is not separately published by facility, and no operator here reports it.
The rules. Belgium has 42 colocation and interconnection facilities on the public PeeringDB register, concentrated in Brussels (7), Antwerp (6), Zaventem (5), alongside 2 internet exchanges (BNIX, BelgiumIX). Named sites include Digital Realty BRU1 - Brussels, Level(3) Brussels, Versatel Gent (Handelsdok Center), LCL Antwerp.
Where the cables land. 2 landing points · Bredene, Ostend
56% residents to 44% visitors across a year. 9,343,000 international arrivals in 2019 against 11,941,781 people who live here (2025, World Bank / UN Tourism).
Where a visitor dollar goes in Belgium
2,584k
Visitors a year
0.2
Visitors per resident
How deep in debt is Belgium?· for every $100 Belgium earns in a year, it owes…
Pay to the order of: the creditorsmemo · the 1993 peak
$ 139The worst year on the IMF record. Belgium owed $139 for every $100 it earned.
IMF World Economic Outlook, 1993signed, the creditors
Pay to the order of: the creditorsmemo · today
$ 109What is owed now, for every $100 of national income (2026).
IMF World Economic Outlook, 2026signed, the creditors
Pay to the order of: the creditorsmemo · projected 2031
$ 122The IMF's own forecast has this rising to $122 by 2031.
IMF World Economic Outlook projection, 2031signed, the forecast
For every $100 Belgium earns in a year, it owes $109 (2026, IMF World Economic Outlook). That is more than a full year of national income, and the interest is paid before anything else.
Where does a tourist dollar actually go in Belgium?
Play one tourist dollar around the board. Every square is a measured fact from this page.
START!
1
GO: a visitor lands
$100 goes on the table. 9,343,000 international arrivals in 2019 against 11,941,781 residents, 0.8 visitors for every resident (World Bank / UN Tourism).
$100 in play
2
The bed
Who owns the largest places to stay in Belgium is not published in the records we can check, so this square is left open rather than guessed. Where a listing names its owner, it is shown in the ownership table below.
not published
3
The plate
Food is only 11.8% of everything Belgium imports (2024, World Bank), so most of a meal is bought from producers inside the country. Eating what the land here actually grows, sugar beets, potatoes, wheat, lettuce, maize, barley, pears, keeps that money with the grower.
mostly home-grown
4
The power
76.5% of the electricity is fossil (2021, World Bank). Lighting, cooling and hot water are paid for largely in imported fuel.
burns away
5
What actually stays
On the parts that can be measured, the power leaves and the plate stays. It is genuinely a coin toss, decided by what you book.
split
6
Pay the bank first
Belgium owes $109 for every $100 it earns (IMF World Economic Outlook, 2026 projection). The interest is paid before anything else on this board.
$109 per $100
7
A spread hand
The largest single export, pharmaceuticals, is 15.8% of the total (2023, UN Comtrade). No one shock can take the whole board.
top export 15.8%
8
Community chest
Tourism earns 1.8% of everything Belgium makes from exports (2020, World Bank / UN Tourism). That is how much of the economy depends on the game continuing.
1.8% of exports
9
The flight
Getting here is usually the biggest single line on the bill. From Sydney a return economy seat is 3.01 t CO2, on the UK Government's published conversion factors. It is the one part of the trip this board cannot reduce.
3.01 t CO2
10
Back to GO
The economy turns over about US$777 billion a year (IMF World Economic Outlook, 2026 projection). Every lap of this board is a choice about how much of it stays.
US$777bn
GDPUS$725.5bn
Agriculture, share of GDP0.7%
Visitors a year2,584,000
Visitors per resident0.2
Residents~11,941,781
Agriculture
Farming is 0.7% of the economy. Belgium is intensively farmed and runs an agri-food trade surplus, exporting far more processed food than it imports in value, even though food makes up about 11.5 per cent of merchandise imports as raw crops and feed flow through its ports (World Bank).
Natural materials
Flanders has a deep textile heritage: flax and linen cultivation along the River Lys around Kortrijk, and world-famous lace from Bruges, Brussels and Mechelen, on top of the medieval wool and cloth trade that made the Flemish cities rich. The region remains one of Europe's leading flax-growing areas, so the linen tradition is still partly living rather than purely historic.
Energy
Belgium emits about 7.31 tonnes of CO2 per person, a moderate level for a wealthy industrial economy, and its power sector is fairly low-carbon thanks to a large nuclear share (about 41 per cent in 2023) alongside renewables at a record 38.9 per cent of generation in 2025. The country is coal-free in electricity and is bound by the EU climate framework, including net zero by 2050 and steep 2030 targets.
Who owns the biggest hotels in Belgium?
By rooms · company records and press.
B&B Quay17 · ~3 roomsIndependentnot published
Yalo Hotel · ~92 roomsIndependentnot published
Hotel Navarra · ~94 roomsIndependentnot published
Crowne Plaza Brussel Airport · ~315 roomsFranchisenot published
Mansion9bruges · ~4 roomsIndependentnot published
Visitors, over time
20158,355k
20167,481k
20178,385k
20189,119k
20199,343k
20202,584k
International tourism receipts run at about US$7.45 billion in 2020 (World Bank / UN Tourism). That is 1.8% of everything the country earns from exports.
How much of your money actually stays here?
Tap the holiday you are planning.
All-inclusive resortForeign-owned hotel and tourist restaurantsLocally owned stay and local restaurantsGuesthouse, markets and public transport
Resort guest, villa renter, family, nomad or backpacker. The honest playbook for each, from the same sourced numbers.
Already booked a resort? · the rescue list
Five swaps that move your money back on-island
1. Eat where the country eats Choose kitchens cooking what the land here grows, sugar beets, potatoes, wheat, lettuce, maize, barley and pears, over an imported menu. The checked list →
2. Book with a local operator Never the lobby desk. The margin on a tour is the part that stays. Eco tours →
3. Stay somewhere locally owned Ownership decides where the room rate books. Eco stays →
4. Use the transport residents use One of the world's densest rail networks links every city within an hour or two, with excellent trams and cycling, so a car is rarely needed.
5. Buy the craft, not the souvenir Natural-materials work made here pays the maker directly; imported gifts pay a shipping line.
swipe →
First time here
Belgium is a small, intensively farmed country that leads Europe on recycling and delivers near-universal safe tap water, though dense traffic, port-industry pollution and very low wildlife diversity temper its eco standing.
Best time: Late April and May for the bluebells and mild weather, and May to September overall.
Getting around
One of the world's densest rail networks links every city within an hour or two, with excellent trams and cycling, so a car is rarely needed.
Transport is where the fare either stays or leaves.
Eating here
The everyday plate that actually grows here is sugar beets, potatoes, wheat, lettuce, maize, barley and pears. Ordering those keeps the money with the grower and cuts the imported share of the meal.
Eating what the country grows is the cheapest way to cut the import bill.
Good to know
Cards everywhere; EUR. Three languages, one small country.
Rate my hotel. Tap yours for the honest verdict.
Ownership from company records and press.
B&B Quay17Yalo HotelHotel NavarraCrowne Plaza Brussel AirportMansion9bruges
.
Who owns the big hotels
B&B Quay17Independent · 3 rooms
Yalo HotelIndependent · 92 rooms
Hotel NavarraIndependent · 94 rooms
Crowne Plaza Brussel AirportFranchise · 315 rooms
Mansion9brugesIndependent · 4 rooms
None of the 5 properties listed here publishes who ultimately owns it, so no claim is made either way. Ownership is what decides how much of a room rate stays in the country, which is why we show it when a listing states it.
Society and Governance in Belgium.
How well is Belgium actually run?
Governance, measured · World Bank WGI
Four measured answers, none of them opinion. Averaged across corruption control, delivery and accountability, Belgium scores 78 out of 100 (2024, World Bank Worldwide Governance Indicators). That is a state that generally does what it says it will do, which is what makes a climate pledge worth reading.
How well is Belgium run? · each scored out of 100, higher is better
Clean government, scored 78 of 100
Control of corruption scores 77.6 out of 100 (2024, World Bank Worldwide Governance Indicators). That puts it in the cleanest quarter of governments measured.
78
Freedom and rights, scored 83 of 100
Voice and accountability, which measures free expression, free media and the ability to choose a government, scores 83.1 out of 100 (2024, World Bank WGI). Citizens here can question their government openly.
83
Government effectiveness, scored 75 of 100
Government effectiveness, which measures the quality of public services and how well policy is actually delivered, scores 74.6 out of 100 (2024, World Bank WGI). Delivery is rated above average.
75
Income equality, scored 27 of 100
The Gini index of income inequality reads 26.8 (2023, World Bank). Zero is perfect equality and 100 is one person holding everything. Below 40 is the level usually treated as manageable, and Belgium sits inside it.
27
LGBTQ+ status: HighSolo female travel: EasyIndustry to avoid: The Antwerp port and petrochemical cluster, a source of air and PFAS pollution.
What is daily life in Belgium really like? Measured
Getting around, breathing, throwing away, learning. The honest checklist.
TransportAirWaterWastePower
✓How you get around One of the world's densest rail networks links every city within an hour or two, with excellent trams and cycling, so a car is rarely needed.
✓Air quality, measured Modelled annual mean 7.5. The WHO guideline is 5 µg/m³.
✓Where the air is cleanest The Ardennes and rural Wallonia, with PM2.5 around 4.6 micrograms per cubic metre in 2024 against 8.1 in Flanders.
✓Tap water Drinkable
✓What to drink Tap water is safe; locals drink it in most cities.
✓Plastic rules The EU Single-Use Plastics Directive has applied since July 2021, banning single-use plastic straws, cutlery and plates, with regional bans on free carrier bags.
✓Sockets and voltage Type C/F, 230V
Made in Belgium.
Flanders has a deep textile heritage: flax and linen cultivation along the River Lys around Kortrijk, and world-famous lace from Bruges, Brussels and Mechelen, on top of the medieval wool and cloth trade that made the Flemish cities rich. The region remains one of Europe's leading flax-growing areas, so the linen tradition is still partly living rather than purely historic. Every step of processing done at home is value that stops leaving the country.
What Belgium actually sells the world
The single biggest thing Belgium sells the world is pharmaceuticals, 15.8% of all exports in 2023 (about US$62.80 billion, UN Comtrade). The next four are mineral fuels and oils at 13.2%, vehicles at 11.3%, machinery and mechanical appliances at 6.5%, plastics at 5.0%.
Made now · natural materials
Linen cultivation along the River Lys around Kortrijk
Worked in Belgium from local material, and still a working craft rather than a museum piece.
Made now · natural materials
Bruges lace
Worked in Belgium from local material, and still a working craft rather than a museum piece.
Made now · natural materials
Brussels
Worked in Belgium from local material, and still a working craft rather than a museum piece.
Made now · natural materials
Mechelen
Worked in Belgium from local material, and still a working craft rather than a museum piece.
Could make · grown here already
Potatoes
Grown in Belgium and mostly sold raw. Processing it here would keep the margin here.
Could make · grown here already
Frites
Grown in Belgium and mostly sold raw. Processing it here would keep the margin here.
Could make · grown here already
Moules-frites
Grown in Belgium and mostly sold raw. Processing it here would keep the margin here.
The maths for an entrepreneur. Belgium produces about US$725 billion a year, which is roughly US$60,750 per person (2025, World Bank). Farming is 0.7% of that, while food is 11.8% of everything the country imports. The country buys in more food than its own farms contribute to the economy, and every point of that gap is a business someone could build here rather than ship in. With 28.3% of the land arable, the raw material for that is already in the ground.
A living tradition of Belgium, still practised rather than archived.
Gilles
A living tradition of Belgium, still practised rather than archived.
Processional giants
A living tradition of Belgium, still practised rather than archived.
Dragons (Ath
A living tradition of Belgium, still practised rather than archived.
BrusselsA living tradition of Belgium, still practised rather than archived.
Ducasse of Mons (the Doudou)A living tradition of Belgium, still practised rather than archived.
Does Belgium protect its heritage by law?
Partly, and the gaps say as much as the protections.
What is kept alive. Belgium sustains a notable living folk heritage, most famously the Carnival of Binche, whose Gilles parade in wax masks and ostrich-feather hats on Shrove Tuesday, a tradition inscribed by UNESCO. Processional giants and dragons, the Ducasse of Mons and the Holy Blood Procession in Bruges continue as community rituals, and Belgian beer culture is recognised as intangible heritage. These traditions are genuine and locally rooted, though set within a highly modernised and largely secular society.
Who it belongs to. Belgian tourism is predominantly urban and mass-market, centred on Brussels, Bruges, Ghent and Antwerp rather than community-run rural experiences. Living traditions are rich, including the UNESCO-listed Carnival of Binche, Belgian beer culture and the historic beguinages. Community-based tourism exists mainly in the Ardennes and the Flemish countryside but is modest in scale.
Only here. The Hallerbos 'Blue Forest' near Halle, which carpets with millions of wild bluebells for about ten days each spring..
Three futures for Belgium, every one run forward from measured data.
Where the making actually happens
Named craft workshops on the open map: 't Allegaartje, 't Atelier, Academia, Ambiance Party, Art et Graphe, Arts & Vies.
Every measured trend on one line
Run forward at the pace already recorded.
+3%
Forest cover
2000: 22 % → 2023: 22.6 %
+2522%
Renewable electricity
1995: 0.9 % → 2021: 23.5 %
-39%
CO2 per person
1995: 12.1 t → 2024: 7.3 t
-54%
Tourist arrivals
1995: 5560 k → 2020: 2584 k
-28%
Protected land
2013: 22.9 % → 2025: 16.4 %
-63%
Farm workforce
1995: 2.68 % → 2025: 0.99 %
+4%
Protected sea
2013: 36.7 % → 2025: 38.3 %
-3%
Agricultural land
2000: 45.8 % → 2023: 44.4 %
+9%
Urban population
1995: 80.3 % → 2025: 87.7 %
-62%
Air pollution
1995: 22.1 µg/m³ → 2023: 8.4 µg/m³
-13%
Fresh water per person
1995: 1183.8 m³ → 2022: 1027.4 m³
+8%
Adult overweight
1995: 47.5 % → 2022: 51.1 %
+0%
Electricity access
1995: 100 % → 2024: 100 %
+114%
GDP per person
1995: 28414 → 2025: 60750
+18%
Population
1995: 10137 k → 2025: 11942 k
+800%
Renewable energy use
1995: 1.3 % → 2021: 11.7 %
-23%
Energy per person
1995: 5262 kg → 2024: 4078 kg
-23%
Protected area, total
2013: 24.3 % → 2025: 18.6 %
+7%
Life expectancy
1995: 76.8 yrs → 2024: 82.3 yrs
+6%
Cereal yield
2000: 8021 ha → 2023: 8486 ha
-41%
Fertiliser use
2002: 326.2 ha → 2023: 191.7 ha
-37%
Rural population
1995: 19.7 % → 2025: 12.3 %
+212%
Water productivity
1995: 38.7 $/m3 → 2022: 120.9 $/m3
+35%
Health spending
2000: 8 % → 2023: 10.8 %
+3%
Forest area
2000: 6673 km2 → 2023: 6893 km2
-4%
Electric power use
1995: 7380 kWh → 2024: 7099 kWh
-26%
Emissions: Agriculture
1990: 12.1 e → 2023: 8.9 e
-30%
Emissions: Building
1990: 25 e → 2023: 17.5 e
-43%
Emissions: Electricity/Heat
1990: 31.8 e → 2023: 18 e
-28%
Emissions: Energy
1990: 108.8 e → 2023: 78.6 e
-38%
Emissions: Industrial Processes
1990: 10.7 e → 2023: 6.6 e
-42%
Emissions: Manufacturing/Construction
1990: 28.2 e → 2023: 16.4 e
+17%
Emissions: Transportation
1990: 20.7 e → 2023: 24.2 e
World Bank open data, recorded series
How much forest is left?
Forest cover moved from 22.0% to 22.6% across 23 recorded years.
World Bank AG.LND.FRST.ZS
How clean is the grid?
Renewable electricity moved from 0.9% to 23.5% across 26 recorded years.
World Bank EG.ELC.RNEW.ZS
How much climate pollution per person?
CO2 per person moved from 12.1 t to 7.3 t across 29 recorded years.
World Bank EN.GHG.CO2.PC.CE.AR5
How many people visit?
Tourist arrivals moved from 5560k to 2584k across 25 recorded years.
World Bank ST.INT.ARVL
How much land is protected?
Protected land moved from 22.9% to 16.4% across 12 recorded years.
World Bank ER.LND.PTLD.ZS
How many people still farm?
Farm workforce moved from 2.7% to 1.0% across 30 recorded years.
World Bank SL.AGR.EMPL.ZS
How much sea is protected?
Protected sea moved from 36.7% to 38.3% across 12 recorded years.
World Bank ER.MRN.PTMR.ZS
How much land is farmed?
Agricultural land moved from 45.8% to 44.4% across 23 recorded years.
World Bank AG.LND.AGRI.ZS
How fast is it urbanising?
Urban population moved from 80.3% to 87.7% across 30 recorded years.
World Bank SP.URB.TOTL.IN.ZS
Is the air getting cleaner?
Air pollution moved from 22.1 µg/m³ to 8.4 µg/m³ across 28 recorded years.
World Bank EN.ATM.PM25.MC.M3
Is water getting scarcer?
Fresh water per person moved from 1183.8 m³ to 1027.4 m³ across 27 recorded years.
World Bank ER.H2O.INTR.PC
Is diet-related disease rising?
Adult overweight moved from 47.5% to 51.1% across 27 recorded years.
World Bank SH.STA.OWAD.ZS
Who has power?
Electricity access moved from 100.0% to 100.0% across 29 recorded years.
World Bank EG.ELC.ACCS.ZS
Is income rising?
GDP per person moved from 28414 to 60750 across 30 recorded years.
World Bank NY.GDP.PCAP.CD
How fast is it growing?
Population moved from 10137k to 11942k across 30 recorded years.
World Bank SP.POP.TOTL
What share of all energy is renewable?
Renewable energy use moved from 1.3% to 11.7% across 26 recorded years.
World Bank EG.FEC.RNEW.ZS
How much energy does one person use?
Energy per person moved from 5262 kg to 4078 kg across 29 recorded years.
World Bank EG.USE.PCAP.KG.OE
How much land and sea is protected together?
Protected area, total moved from 24.3% to 18.6% across 12 recorded years.
World Bank ER.PTD.TOTL.ZS
How long do people live?
Life expectancy moved from 76.84 yrs to 82.3 yrs across 29 recorded years.
World Bank SP.DYN.LE00.IN
How much does a hectare of cereal produce?
Cereal yield moved from 8021 kg/ha to 8486 kg/ha across 23 recorded years.
World Bank AG.YLD.CREL.KG
How much fertiliser goes on the land?
Fertiliser use moved from 326.22 kg/ha to 191.66 kg/ha across 21 recorded years.
World Bank AG.CON.FERT.ZS
How many people still live rurally?
Rural population moved from 19.66% to 12.33% across 30 recorded years.
World Bank SP.RUR.TOTL.ZS
How much value per cubic metre of water?
Water productivity moved from 38.71 $/m3 to 120.92 $/m3 across 27 recorded years.
World Bank ER.GDP.FWTL.M3.KD
How much goes on health?
Health spending moved from 8.0% to 10.8% across 23 recorded years.
World Bank SH.XPD.CHEX.GD.ZS
How much forest is there in total?
Forest area moved from 6673 km2 to 6893 km2 across 23 recorded years.
World Bank AG.LND.FRST.K2
How much electricity per person?
Electric power use moved from 7380 kWh to 7099 kWh across 29 recorded years.
World Bank EG.USE.ELEC.KH.PC
How have agriculture emissions moved?
Agriculture emissions moved from 12.08 to 8.91 MtCO2e across 33 recorded years.
Climate Watch (WRI), historical emissions
How have building emissions moved?
Building emissions moved from 25.03 to 17.47 MtCO2e across 33 recorded years.
Climate Watch (WRI), historical emissions
How have electricity/heat emissions moved?
Electricity/Heat emissions moved from 31.8 to 18.02 MtCO2e across 33 recorded years.
Climate Watch (WRI), historical emissions
How have energy emissions moved?
Energy emissions moved from 108.82 to 78.56 MtCO2e across 33 recorded years.
Climate Watch (WRI), historical emissions
How have industrial processes emissions moved?
Industrial Processes emissions moved from 10.68 to 6.6 MtCO2e across 33 recorded years.
Climate Watch (WRI), historical emissions
How have manufacturing/construction emissions moved?
Manufacturing/Construction emissions moved from 28.2 to 16.4 MtCO2e across 33 recorded years.
Climate Watch (WRI), historical emissions
How have transportation emissions moved?
Transportation emissions moved from 20.68 to 24.23 MtCO2e across 33 recorded years.
Climate Watch (WRI), historical emissions
Worst caseCurrent pathBest case
Worst case
Every measured decline continues at the pace already recorded. The weakest pillar, wildlife at 2/5, is the one that gives way first.
Computed from: recorded series extended with no policy change
Current path
Every line above is a recorded World Bank series for this country. The current path is simply those series continuing at the pace already measured.
Computed from: recorded series, no policy change assumed
Best case
The pledges are met on their own stated timetables and the weakest pillars are lifted to match the strongest. Belgium already shows it can do this: recycling scores 5/5.
Computed from: each published target delivered on its own date
What the best case actually asks for
Lift wildlife
It scores 2 out of 5 today, among the weakest parts of Belgium's record. As a densely settled, heavily modified corner of temperate north-west Europe, Belgium has effectively no strict endemic species and limited large wildlife. It still holds wild boar, red and roe deer, foxes and reintroduced beaver in the Ardennes, and the Zwin coastal reserve is important for migratory birds. Some recovery is under way as beaver return and wolves disperse from Germany. Lifting it toward the 5/5 the strongest pillars already reach is what the best case turns on.
measured each year
Costs: spending and enforcement, not new technology
Lift conservation
It scores 3 out of 5 today, among the weakest parts of Belgium's record. Terrestrial protected areas cover 16.3 per cent of Belgium (World Bank), with Natura 2000 sites at roughly 12.7 per cent of land, below the EU average. About 37 per cent of the small Belgian North Sea is designated protected under the Marine Spatial Plan across five sites, though these are limited in absolute terms and the effectiveness of such paper protections is debated. Conservation is moderate rather than expansive in this crowded landscape. Lifting it toward the 5/5 the strongest pillars already reach is what the best case turns on.
measured each year
Costs: spending and enforcement, not new technology
Lift culture
It scores 3 out of 5 today, among the weakest parts of Belgium's record. Belgian tourism is predominantly urban and mass-market, centred on Brussels, Bruges, Ghent and Antwerp rather than community-run rural experiences. Living traditions are rich, including the UNESCO-listed Carnival of Binche, Belgian beer culture and the historic beguinages. Community-based tourism exists mainly in the Ardennes and the Flemish countryside but is modest in scale. Lifting it toward the 5/5 the strongest pillars already reach is what the best case turns on.
measured each year
Costs: spending and enforcement, not new technology
Government and Goals in Belgium.
Who is in charge of Belgium now · Office-holders from the UN Protocol and Liaison Service public list of Heads of State and Heads of Government, 8 September 2026. Legislature and election dates from IFES ElectionGuide. Constitution dates from the Constitute Project. Governance scores from the World Bank Worldwide Governance Indicators 2024.
Bart De Wever
Prime Minister
Bart De Wever is the head of government of Belgium, in office since 3 February 2025. Every climate, protection and energy pledge on this page is delivered, or not, under this administration.
Public opinion, measured
Voice and accountability, the freedom to question government: 83.1 / 100. Among the strongest measured. World Bank WGI 2024
Control of corruption: 77.6 / 100. Among the strongest measured. World Bank WGI 2024
Political stability and absence of violence: 68 / 100. Above the halfway mark of governments measured. World Bank WGI 2024
Rule of law: 79 / 100. Among the strongest measured. World Bank WGI 2024
Regulatory quality: 74.5 / 100. Above the halfway mark of governments measured. World Bank WGI 2024
Bart De WeverPrime Minister
Federal Parliament (Parlement fédéral, Federaal Parlement, FöderalesLegislature, bicameral
Last election9 June 2024
Constitution1831, as revised to 2025
Government typefederal parliamentary democracy under a constitutional monarchy
Belgium national goals: climate commitments on record · as recorded by Climate Watch, World Resources Institute
2050
Net zero
In Policy Document
Net-zero target as recorded by Climate Watch. Status: In Policy Document (9/30/2020) ↗
The questions people actually type, answered in full sentences from the sourced data above.
swipe →
Is Belgium sustainable?
Belgium scores 67 out of 100 on the Throne Eco Index, across twelve equally weighted pillars. Belgium is a small, intensively farmed country that leads Europe on recycling and delivers near-universal safe tap water, though dense traffic, port-industry pollution and very low wildlife diversity temper its eco standing.
Is the water in Belgium safe and plentiful?
Belgium draws its freshwater from the Meuse and Scheldt river basins plus groundwater and reservoirs, and delivers safely managed drinking water to 99.91 per cent of the population (World Bank/JMP). Despite that excellent safety record, the country has low renewable freshwater resources per head and high population density, and is regularly ranked among Europe's more water-stressed nations. Supply is reliable but not abundant.
Can Belgium feed itself?
Belgium is intensively farmed and runs an agri-food trade surplus, exporting far more processed food than it imports in value, even though food makes up about 11.5 per cent of merchandise imports as raw crops and feed flow through its ports (World Bank). It is a major producer of potatoes, pork, dairy, sugar beet and horticulture, and a world-leading exporter of frozen chips and prepared vegetables. Self-sufficiency in staples is high but the system leans on imported animal feed.
Is it easy to eat plant-based in Belgium?
The national food identity is firmly meat-and-dairy, built on pork, steak-frites, butter and chocolate, so plant-based eating is available in cities but not the default. Ghent pioneered a weekly Veggie Thursday (Donderdag Veggiedag) and urban vegan options are good. Fresh local vegetables such as chicory, leeks and Brussels sprouts are abundant in season.
How much of Belgium is actually protected?
Terrestrial protected areas cover 16.3 per cent of Belgium (World Bank), with Natura 2000 sites at roughly 12.7 per cent of land, below the EU average. About 37 per cent of the small Belgian North Sea is designated protected under the Marine Spatial Plan across five sites, though these are limited in absolute terms and the effectiveness of such paper protections is debated. Conservation is moderate rather than expansive in this crowded landscape.
What wildlife is left in Belgium?
As a densely settled, heavily modified corner of temperate north-west Europe, Belgium has effectively no strict endemic species and limited large wildlife. It still holds wild boar, red and roe deer, foxes and reintroduced beaver in the Ardennes, and the Zwin coastal reserve is important for migratory birds. Some recovery is under way as beaver return and wolves disperse from Germany.
Is Belgium on clean energy?
Belgium emits about 7.31 tonnes of CO2 per person, a moderate level for a wealthy industrial economy, and its power sector is fairly low-carbon thanks to a large nuclear share (about 41 per cent in 2023) alongside renewables at a record 38.9 per cent of generation in 2025. The country is coal-free in electricity and is bound by the EU climate framework, including net zero by 2050 and steep 2030 targets. A long-planned nuclear phase-out has been partly delayed to protect low-carbon supply.
How polluted is Belgium?
EU Single-Use Plastics rules apply and packaging is tightly managed, but dense road traffic and the Antwerp port and petrochemical cluster, one of the world's largest, drive local air, industrial and PFAS pollution. The population-weighted PM2.5 mean was about 7.5 micrograms per cubic metre in 2024 (IRCEL), still above the WHO guideline of 5. Air is cleaner in rural Wallonia than in Flanders.
Does recycling work in Belgium?
Belgium recycles about 55.8 per cent of municipal waste (Eurostat, 2023) and landfills only around 0.4 per cent, placing it among the EU's clear leaders. The Fost Plus packaging scheme, built on the sorted blue-bag (PMD) system, underpins very high packaging recovery. Sorting is mandatory and strictly enforced.
Is the farming in Belgium organic?
Organic farming covers about 7.6 per cent of Belgium's utilised agricultural area (Eurostat/EEA), but with a sharp regional split: Wallonia is at 12.7 per cent and aiming for 30 per cent by 2030, while intensively farmed Flanders sits near 1.6 per cent. The national average is solid for a densely farmed country.
Are there natural materials and craft in Belgium?
Flanders has a deep textile heritage: flax and linen cultivation along the River Lys around Kortrijk, and world-famous lace from Bruges, Brussels and Mechelen, on top of the medieval wool and cloth trade that made the Flemish cities rich. The region remains one of Europe's leading flax-growing areas, so the linen tradition is still partly living rather than purely historic.
Is there living culture in Belgium?
Belgian tourism is predominantly urban and mass-market, centred on Brussels, Bruges, Ghent and Antwerp rather than community-run rural experiences. Living traditions are rich, including the UNESCO-listed Carnival of Binche, Belgian beer culture and the historic beguinages. Community-based tourism exists mainly in the Ardennes and the Flemish countryside but is modest in scale.
What heritage does Belgium keep alive?
Belgium sustains a notable living folk heritage, most famously the Carnival of Binche, whose Gilles parade in wax masks and ostrich-feather hats on Shrove Tuesday, a tradition inscribed by UNESCO. Processional giants and dragons, the Ducasse of Mons and the Holy Blood Procession in Bruges continue as community rituals, and Belgian beer culture is recognised as intangible heritage. These traditions are genuine and locally rooted, though set within a highly modernised and largely secular society.
So is Belgium actually green? The measured answer
What is working: sea protected at 38.3%.
What is not: renewable electricity at 23.5% against a 100% mark.
Belgium sits 46 of 77 at 67/100. Every name links to its own destination page, built exactly like this one. The full ranking →
What is Belgium particularly good at?
✓Recycling, scored 5/5. Belgium recycles about 55.8 per cent of municipal waste (Eurostat, 2023) and landfills only around 0.4 per cent, placing it among the EU's clear leaders. The Fost Plus packaging scheme, built on the sorted blue-bag (PMD) system, underpins very high packaging recovery. Sorting is mandatory and strictly enforced.
✓Food and farming, scored 4/5. Belgium is intensively farmed and runs an agri-food trade surplus, exporting far more processed food than it imports in value, even though food makes up about 11.5 per cent of merchandise imports as raw crops and feed flow through its ports (World Bank). It is a major producer of potatoes, pork, dairy, sugar beet and horticulture, and a world-leading exporter of frozen chips and prepared vegetables. Self-sufficiency in staples is high but the system leans on imported animal feed.
✓Natural fibres, scored 4/5. Flanders has a deep textile heritage: flax and linen cultivation along the River Lys around Kortrijk, and world-famous lace from Bruges, Brussels and Mechelen, on top of the medieval wool and cloth trade that made the Flemish cities rich. The region remains one of Europe's leading flax-growing areas, so the linen tradition is still partly living rather than purely historic.
Where does Belgium score worst?
✕Pollution, scored 3/5. EU Single-Use Plastics rules apply and packaging is tightly managed, but dense road traffic and the Antwerp port and petrochemical cluster, one of the world's largest, drive local air, industrial and PFAS pollution. The population-weighted PM2.5 mean was about 7.5 micrograms per cubic metre in 2024 (IRCEL), still above the WHO guideline of 5. Air is cleaner in rural Wallonia than in Flanders.
✕Water, scored 3/5. Belgium draws its freshwater from the Meuse and Scheldt river basins plus groundwater and reservoirs, and delivers safely managed drinking water to 99.91 per cent of the population (World Bank/JMP). Despite that excellent safety record, the country has low renewable freshwater resources per head and high population density, and is regularly ranked among Europe's more water-stressed nations. Supply is reliable but not abundant.
✕Wildlife, scored 2/5. As a densely settled, heavily modified corner of temperate north-west Europe, Belgium has effectively no strict endemic species and limited large wildlife. It still holds wild boar, red and roe deer, foxes and reintroduced beaver in the Ardennes, and the Zwin coastal reserve is important for migratory birds. Some recovery is under way as beaver return and wolves disperse from Germany.
Similar countries doing it better and worse
FranceScored on the same twelve pillars as Belgium.78
SwitzerlandScored on the same twelve pillars as Belgium.75
GermanyScored on the same twelve pillars as Belgium.75
United KingdomScored on the same twelve pillars as Belgium.65
MontenegroScored on the same twelve pillars as Belgium.62
SerbiaScored on the same twelve pillars as Belgium.58
A note from the lens of mother natureswipe →
Energy, 3/5
Belgium emits about 7.31 tonnes of CO2 per person, a moderate level for a wealthy industrial economy, and its power sector is fairly low-carbon thanks to a large nuclear share (about 41 per cent in 2023) alongside renewables at a record 38.9 per cent of generation in 2025. The country is coal-free in electricity and is bound by the EU climate framework, including net zero by 2050 and steep 2030 targets.
Food and farming, 4/5
Belgium is intensively farmed and runs an agri-food trade surplus, exporting far more processed food than it imports in value, even though food makes up about 11.5 per cent of merchandise imports as raw crops and feed flow through its ports (World Bank). It is a major producer of potatoes, pork, dairy, sugar beet and horticulture, and a world-leading exporter of frozen chips and prepared vegetables.
Heritage, 3/5
Belgium sustains a notable living folk heritage, most famously the Carnival of Binche, whose Gilles parade in wax masks and ostrich-feather hats on Shrove Tuesday, a tradition inscribed by UNESCO. Processional giants and dragons, the Ducasse of Mons and the Holy Blood Procession in Bruges continue as community rituals, and Belgian beer culture is recognised as intangible heritage.
The Belgium Directory.
Everything on Hold The Throne that sits in Belgium, checked and listed.
World Bank Worldwide Governance Indicators, 2024. Percentile among all governments measured.
Government effectiveness
74.6 / 100
World Bank Worldwide Governance Indicators, 2024. Percentile among all governments measured.
Rule of law
79 / 100
World Bank Worldwide Governance Indicators, 2024. Percentile among all governments measured.
Political stability
68 / 100
World Bank Worldwide Governance Indicators, 2024. Percentile among all governments measured.
Voice and accountability
83.1 / 100
World Bank Worldwide Governance Indicators, 2024. Percentile among all governments measured.
Environmental Performance Index
66.8 / 100 · 15 of 180
Yale Environmental Performance Index 2024, ranked 15 of 180 countries assessed.
Ecosystem vitality
68.5 / 100 · 17 of 180
Yale Environmental Performance Index 2024, ranked 17 of 180 countries assessed.
Biodiversity and habitat
66.2 / 100 · 28 of 180
Yale Environmental Performance Index 2024, ranked 28 of 180 countries assessed.
Air pollution
94.3 / 100 · 4 of 180
Yale Environmental Performance Index 2024, ranked 4 of 180 countries assessed.
Terrestrial biomes protected
51.6 / 100 · 93 of 180
Yale Environmental Performance Index 2024, ranked 93 of 180 countries assessed.
Marine protected areas
47.1 / 100 · 104 of 131
Yale Environmental Performance Index 2024, ranked 104 of 131 countries assessed.
How Belgium Is Scored. The Throne Standard.
Every destination on the index is scored the same way, so a 4 in Barbados means exactly what a 4 means in Iceland. No self-declared data and no brochure claims are accepted. Every figure on this page carries its named source and year, and the history on each page names what empire took as plainly as it scores the present.
The 12 pillars every destination is scored on, equally weighted
01
Conservation
Land and sea actually protected, not pledged
02
Wildlife
What survives, what is endemic, what is lost
03
Water
Fresh water per person, and the ocean’s health
04
Food & farming
Whether the place can feed itself
05
Organic & clean
Certified land and pesticide reality
06
Climate & energy
Emissions per person, how the grid is powered
07
Waste
Where the rubbish goes, what comes back
08
Health
What people eat and die of
09
Heritage
Living culture, and what the law keeps standing
10
Ownership
Who owns the economy, how much of a dollar stays
11
Governance
Freedom, honesty, promises kept
12
Future
Measured trends run forward, pledges against pace
What each 0 to 5 pillar score means, in plain words
The institutions above are the ones cited on this page, ranked by how many of its figures they carry. This same sectioned page renders for all 77 scored destinations, each with its own researched history, comparison charts and three-way future. Read the full methodology
Every figure on this page, and where it came from: 90 sources across 31 institutions
IUCN Red List of Threatened Species v2026-1, accessed19 FIGURES
GBIF, category for Oryctolagus cuniculus, Endangered on the IUCN Red List, and recorded in Belgium in GBIF occurrence data (mammal). check
GBIF, category for Oryctolagus cuniculus corroboration check
GBIF, category for Oryctolagus cuniculus corroboration check
GBIF, category for Balearica regulorum, Endangered on the IUCN Red List, and recorded in Belgium in GBIF occurrence data (bird). check
GBIF, category for Balearica regulorum corroboration check
GBIF, category for Balearica regulorum corroboration check
GBIF, category for Salamandra salamandra, Vulnerable on the IUCN Red List, and recorded in Belgium in GBIF occurrence data (amphibian). check
GBIF, category for Salamandra salamandra corroboration check
GBIF, category for Salamandra salamandra corroboration check
GBIF, category for Aesculus hippocastanum, Vulnerable on the IUCN Red List, and recorded in Belgium in GBIF occurrence data (plant). check
GBIF, category for Aesculus hippocastanum corroboration check
GBIF, category for Aesculus hippocastanum corroboration check
GBIF, category for Sequoiadendron giganteum, Endangered on the IUCN Red List, and recorded in Belgium in GBIF occurrence data (conifer). check
GBIF, category for Sequoiadendron giganteum corroboration check
GBIF, category for Sequoiadendron giganteum corroboration check
GBIF, category for Sequoiadendron giganteum corroboration check
GBIF, category for Anguilla anguilla, Critically Endangered on the IUCN Red List, and recorded in Belgium in GBIF occurrence data (species). check
GBIF, category for Anguilla anguilla corroboration check
GBIF, category for Anguilla anguilla corroboration check
World Bank16 FIGURES
Forest area (% of land area) AG.LND.FRST.ZS (22.6%), 2023 check
Terrestrial protected areas ER.LND.PTLD.ZS (16.3%), 2024 check
Marine protected areas ER.MRN.PTMR.ZS (38.3%), 2025 check
Food imports (% of merchandise imports) (11.81%), 2024 check
Threatened species (mammals EN.MAM.THRD.NO, birds EN.BIR.THRD.NO, fish EN.FSH.THRD.NO, higher plants EN.HPT.THRD.NO), 2022 check
Renewable electricity output (% of total) EG.ELC.RNEW.ZS, 2021 check
CO2 emissions per capita EN.GHG.CO2.PC.CE.AR5, 2024 check
Municipal waste recycling rate (55.8%), 2023 check
UN SDG Global Database, electronic waste recycled (%) EN_EWT_RCYR, Belgium, 2018 (72.5%), country-reported check
Characteristics of the railway network in Europe, One of the world's densest rail networks links every city within an hour or two, with excellent trams and cycl check
recycling rate of municipal waste (cei_wm011) check
municipal waste by treatment operation (env_wasmun) check
Flanders Investment & Trade (Government of Flanders)4 FIGURES
Chemicals sector, EU Single-Use Plastics rules apply and packaging is tightly managed, but dense road traffic and the Antwerp po check
BirdLife International, IUCN and UNEP-WCMC3 FIGURES
UN SDG Global Database, terrestrial Key Biodiversity Areas covered by protected areas (%) ER_PTD_TERR, Belgium, 2025 (76.5%), country-reported check
UN SDG Global Database, marine Key Biodiversity Areas covered by protected areas (%) ER_MRN_MPA, Belgium, 2025 (96.9%), country-reported check
UN SDG Global Database, freshwater Key Biodiversity Areas covered by protected areas (%) ER_PTD_FRHWTR, Belgium, 2025 (86.0%), country-reported check
Collet3 FIGURES
Lavachery & Woodbury, Raw material exploitation strategies on the flint mining site of Spiennes (Hainaut, Belgium), Journal of Lithic Studies 3(2), 2016, 127-162, doi:10.2218/jls.v3i2.1821, Later, the Neolithic flint mines at Spiennes near Mons were worked for two thousand years from around 4300 BC check
Lavachery & Woodbury, Raw material exploitation strategies on the flint mining site of Spiennes (Hainaut, Belgium), Journal of Lithic Studies 3(2), 2016, 127-162, doi:10.2218/jls.v3i2.1821 corroboration check
Lavachery & Woodbury, Raw material exploitation strategies on the flint mining site of Spiennes (Hainaut, Belgium), Journal of Lithic Studies 3(2), 2016, 127-162, doi:10.2218/jls.v3i2.1821 corroboration check
FAO, Global Forest Resources Assessment3 FIGURES
UN SDG Global Database, forest area (% of land area) AG_LND_FRST, Belgium, 2025 (22.0%), country-reported check
UN SDG Global Database, forest area under a long-term management plan (%) AG_LND_FRSTMGT, Belgium, 2025 (48.7%), country-reported check
UN SDG Global Database, forest area inside legally established protected areas (%) AG_LND_FRSTPRCT, Belgium, 2025 (26.6%), country-reported check
FPS Foreign Affairs3 FIGURES
Foreign Trade and Development Cooperation (Belgium), Belgium turns its gaze seaward, About 37 per cent of the small Belgian North Sea is designated protected under the Marine Spatial Plan across check
Foreign Trade and Development Cooperation (Belgium), Belgium turns its gaze seaward corroboration check
Foreign Trade and Development Cooperation (Belgium), Belgium turns its gaze seaward corroboration check
Our World in Data / Ember3 FIGURES
Share of electricity produced from renewables, Belgium, 2025 (38.9%) check
Belgium (reporter 56), 2023 exports, HS chapter 30 pharmaceutical products, The largest single export, pharmaceuticals, is 15.8% of the total (2023, UN Comtrade). check
indicator XGDP.FSGOV, government expenditure on education as a percentage of GDP, Belgium, Public spending on education runs at 6.3% of GDP and 12.0% of all government spending, and secondary enrolment check
indicator XGDP.FSGOV, government expenditure on education as a percentage of GDP, Belgium corroboration check
indicator XGDP.FSGOV, government expenditure on education as a percentage of GDP, Belgium corroboration check
Unesco Platform Vlaanderen3 FIGURES
Werelderfgoed in Vlaanderen, Living traditions are rich, including the UNESCO-listed Carnival of Binche, Belgian beer culture and the histo check
official site of the City of Binche tourist office, Le gille, Belgium sustains a notable living folk heritage, most famously the Carnival of Binche, whose Gilles parade in check
official site of the City of Binche tourist office, Le gille corroboration check
Other published sources2 FIGURES
Not assessed at all: Andrena bicolor has no global IUCN assessment (IUCN Red List v2026-1) check
Banned in Brussels (2017) and Flanders (effective 2023); legal in Wallonia only, about 25,000 birds a year across seven producers check
WHO/UNICEF Joint Monitoring Programme2 FIGURES
UN SDG Global Database, population using safely managed drinking water (%) SH_H2O_SAFE, Belgium, 2024 (99.5%), modelled estimate check
UN SDG Global Database, population using safely managed sanitation (%) SH_SAN_SAFE, Belgium, 2024 (94.9%), modelled estimate check

 FranceScored on the same twelve pillars as Belgium.78
 SwitzerlandScored on the same twelve pillars as Belgium.75
 GermanyScored on the same twelve pillars as Belgium.75
 United KingdomScored on the same twelve pillars as Belgium.65
 MontenegroScored on the same twelve pillars as Belgium.62
 SerbiaScored on the same twelve pillars as Belgium.58