Destinations › Oceania · The Destination Index · universal template · every figure sourced
Australia.
Oceania, continent between the Indian Ocean and the South Pacific Ocean. 7,741,220 sq km and 27,614,411 people, 25,760 km of coastline, generally arid to semiarid; temperate in south and east; tropical in north.
Region · OceaniaPopulation · ~27,614,411Languages · English, Mandarin, Arabic, Vietnamese. Over 150 Aboriginal languages still spokenEco Index · 70/100 · Passable
The Eco Index across 12 pillars · scored 0 to 5 · World Bank, OWID, WHO/UNICEF JMP, FiBL, Protected Planet, IUCN, UNESCO (2023-24)
Conservation
Wildlife
Water
Food & farming
Organic & clean
Climate & energy
Waste
Health
Heritage
Ownership
Governance
Future
The History of Australia.
Australia is home to the world's oldest continuous living cultures, with Aboriginal and Torres Strait Islander traditions stretching back tens of thousands of years. Songlines, or Dreaming tracks, map Country through story and song, and ceremony, corroboree, the yidaki (didgeridoo) and Torres Strait Islander dance remain living practice.
Where the name comes from
From the Latin terra australis, 'southern land', a landmass Europeans had theorised before they reached it. Its peoples had hundreds of names for their own country long before that, none of them 'Australia'. Source: national and regional toponymic records.
The land itself: a low plateau across most of the continent, dry through the interior, with a fertile plain in the south east. Its high point is Mount Kosciuszko, 2,228 m. Source: national mapping and survey records.
Where it starts
Sixty-five thousand years, unbroken
Optical dating at Madjedbebe on Mirarr country puts human occupation there at around 65,000 years ago, the oldest published age for Australia, though other researchers argue an age above 50,000 years is unlikely to hold, and the same layers hold the oldest ground-edge stone axes found anywhere in the world. Burial and cremation at Lake Mungo are among the oldest known ritual burials anywhere. Painting continued in Arnhem Land and the Kimberley across tens of thousands of years, one of the longest unbroken art traditions on earth, and at Budj Bim the Gunditjmara built channels and weirs in volcanic rock around 6,600 years ago.
How it got here
1788, and 1992
Before 1788, hundreds of nations held distinct languages, laws, songlines and land management, including fire regimes now being relearned. British settlement from 1788 dispossessed Aboriginal and Torres Strait Islander peoples, with frontier violence and, later, forced child removals. The colonies federated in 1901. In 1992 the High Court recognised native title and rejected the doctrine that the land had belonged to no one.
The timeline
c. 65,000 years ago
Madjedbebe.
Optical dating of a rock shelter on Mirarr country sets the minimum age for human occupation of Australia at around 65,000 years. ↗
c. 65,000 years ago
The oldest tools of their kind.
The same layers hold the oldest ground-edge stone axes found anywhere in the world, along with ground ochres and seed-grinding stones. ↗
c. 40,000 years ago
Mungo.
Burial and cremation at Lake Mungo are among the oldest ritual burials known anywhere. ↗
c. 20,000 years ago onward
Rock art.
Painting continues in Arnhem Land and the Kimberley across tens of thousands of years, one of the longest unbroken art traditions on earth. ↗
c. 6,600 years ago
Budj Bim.
Gunditjmara communities in Victoria build channels, weirs and holding ponds in volcanic rock, among the oldest and largest aquaculture systems in the world. ↗
before 1788
Country.
Hundreds of nations hold distinct languages, laws, songlines and land management, including fire regimes still being relearned today. ↗
1788 to 1900s
Colonisation.
British settlement dispossesses Aboriginal and Torres Strait Islander peoples, with frontier violence and, later, forced child removals. ↗
1901
Federation.
Six self-governing British colonies federate as the Commonwealth of Australia on 1 January 1901. ↗
1992
Mabo.
The High Court recognises native title and rejects the doctrine that the land belonged to no one. ↗
The National Reserve System protects roughly 22 to 23 per cent of Australia's land across more than 14,500 areas, and marine protected areas cover about 45 per cent of its waters, rising above 50 per cent after the 2024 Heard and McDonald Islands expansion (World Bank, Pew). The flagship Great Barrier Reef Marine Park spans 344,000 square kilometres and enforcement through Parks Australia and GBRMPA is strong. A large share of the marine estate is only partially protected multiple-use zoning, and the reef is under climate stress.
Is wild Australia protected? 22% of the land is, against a 30% target for 2030
How protected is nature in Australia?
Forest cover17.42%
Terrestrial protected area22%
Marine protected area45.4%
1115 (mammals, birds, fish & plants) listed as threatened.
Found only here. The platypus and echidnas, the world's only egg-laying mammals, plus kangaroos, koalas, wombats and the quokka; the platypus, quokka and koala live nowhere else, while echidnas also range into New Guinea.
The watchlist
ThreatenedBaudin's Black Cockatoo (Zanda baudinii)Critically Endangered on the IUCN Red List, and recorded in Australia in GBIF occurrence data (bird).
ThreatenedHawksbill (Eretmochelys imbricata)Critically Endangered on the IUCN Red List, and recorded in Australia in GBIF occurrence data (turtle).
ThreatenedGrey Nurse (Carcharias taurus)Critically Endangered on the IUCN Red List, and recorded in Australia in GBIF occurrence data (shark or ray).
ThreatenedLined Earless Dragon (Tympanocryptis lineata)Critically Endangered on the IUCN Red List, and recorded in Australia in GBIF occurrence data (reptile).
ThreatenedNorthern Corroboree Frog (Pseudophryne pengilleyi)Critically Endangered on the IUCN Red List, and recorded in Australia in GBIF occurrence data (amphibian).
ThreatenedNeedle Geebung (Persoonia acerosa)Critically Endangered on the IUCN Red List, and recorded in Australia in GBIF occurrence data (plant).
ThreatenedPersoonia saccataCritically Endangered on the IUCN Red List, and recorded in Australia in GBIF occurrence data (plant).
Critically Endangered, the last IUCN category before Extinct in the Wild, and still recorded in Australia. GBIF holds 122 verified occurrence records.
Hawksbill (Eretmochelys imbricata)
Critically Endangered, the last IUCN category before Extinct in the Wild, and still recorded in Australia. GBIF holds 16 verified occurrence records.
Grey Nurse (Carcharias taurus)
Critically Endangered, the last IUCN category before Extinct in the Wild, and still recorded in Australia. GBIF holds 30 verified occurrence records.
Lined Earless Dragon (Tympanocryptis lineata)
Critically Endangered, the last IUCN category before Extinct in the Wild, and still recorded in Australia. GBIF holds 26 verified occurrence records.
Species named here are drawn from GBIF occurrence records for Australia filtered to the IUCN Red List threatened categories. Species are listed where GBIF holds occurrence records for them in this country. Record counts are not published here because the figure cannot be reproduced from a public GBIF query.
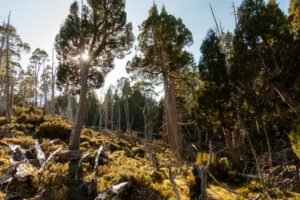
Nature reserve in Tasmania, mapped and named in the open record for Australia. OpenStreetMap.
Water and Ocean in Australia.
Australia is the driest inhabited continent and its populous south depends on the chronically over-allocated Murray-Darling Basin and on seawater desalination plants that back up Perth, Sydney, Melbourne and Adelaide during recurrent drought. Against that supply stress, drinking water is safe for almost the whole population, with the WHO/UNICEF JMP putting safely managed access near 99 per cent, though a minority of remote Indigenous communities still fall short. The tropical north and Tasmania hold far more freshwater than the settled south-east.
Does Australia have enough fresh water? Yes, with headroom
Tap water is safe and excellent in cities; carry it in the Outback where bores and tanks are the norm.
Cleanest water: Tasmania's wilderness rivers and the alpine catchments.
How much fresh water does Australia have, per person?
18,909 m³
Australia
1,000 m³
the UN “water scarce” line
Australia withdraws about 11,620 million cubic metres of fresh water a year (2022). That is 4.7% of the fresh water actually available to it, which FAO counts as no water stress. Of what is taken, farming takes 67%, homes and towns 15%, industry 19%. Source: FAO AQUASTAT.
What are the rules on Australia beaches?
✓Tap water: Drinkable.
✓Plastic rules: Every state and territory has banned lightweight single-use plastic bags, with progressive bans on straws, cutlery and polystyrene rolled out from 2021 to 2023..
✓Solo travel: rated easy on the record for this destination.
✓Marine protection: 45.4% of the sea is protected. The 30x30 pledge is met.
Named on the open map: Almonta Beach, Alva Beach, Back Beach, Betka Beach, Bimbi Beach, Binalong Bay, Boomer Beach, Cheviot Beach. That is 19 named beaches in the public record for Australia, each one a place you can look up before you go. OpenStreetMap.
Where does the sewage go?
95.8%
of people have safely managed sanitation
95.8% of people here use a safely managed sanitation service, meaning waste is contained, emptied and treated rather than reaching the ground or the sea untreated (2024, World Bank / WHO-UNICEF JMP, SDG 6.2.1). That is close to universal coverage.
How is the sea around Australia doing?
One cross-section, every answer measured.
Surface
What the coast carries
Heat and UV are the real hazards; the north has wet season Dec–Mar with croc and stinger risks.
Nearshore
Protected water
45.4% of territorial waters are protected, against the 30% pledged for 2030 under the Global Biodiversity Framework.
Cleanest
Where the water is cleanest
Tasmania's wilderness rivers and the alpine catchments..
The record
Measured
Australia is the driest inhabited continent and its populous south depends on the chronically over-allocated Murray-Darling Basin and on seawater desalination plants that back up Perth, Sydney, Melbourne and Adelaide during recurrent drought. Against that supply stress, drinking water is safe for almost the whole population, with the WHO/UNICEF JMP putting safely managed access near 99 per cent, though a minority of remote Indigenous communities still fall short.
Sea protected
45.4%
Against the 30% pledged for 2030 under the Global Biodiversity Framework.
Threatened species
1115 (mammals, birds, fish & plants)
Mammals, birds, fish and higher plants on the IUCN list.
Cleanest water
here
Tasmania's wilderness rivers and the alpine catchments..
How hard is the water supply being pushed?
Of every 10 buckets nature refills, 0 are already taken. Withdrawals run at 4.7% of what Australia renews internally each year (2022, World Bank / FAO AQUASTAT). That is inside the 25% mark generally treated as water stress, so the supply has headroom.
When is the best time to visit Australia? Tap your month.
Tap your month.
JanFebMarAprMayJunJulAugSepOctNovDec
.
How much fresh water does Australia actually have?
Nature renews about 18,909 cubic metres of fresh water per person per year here. That ranks Australia 175 of 208 countries measured, placing it among the 40 best-watered countries measured. The UN treats anything under 1,000 cubic metres as water scarce, and this is above that line. World Bank / FAO AQUASTAT.
Australia is a major net food exporter, selling roughly 70 per cent of its agricultural production abroad while importing only about 11 per cent of the food it consumes by value (ABARES). More than nine in ten of the fresh fruit, vegetables, meat, milk and eggs on supermarket shelves are domestically produced. It is one of the world's largest beef, wheat, wool and canola exporters.
Where does the food in Australia come from?
6.5% imported
about US$20,237m a year
On the plate: Tropical and temperate fruit, macadamias, and native bush foods like finger lime, wattleseed and Kakadu plum.
How often each food is on the plate
Share of people eating each one regularly. These overlap, so they do not add up to 100%.
Tropical24%
Temperate fruit15%
1 of 10
bites are imported
The island buys in more food energy than it eats. About US$20,237m a year leaves the country to pay for it. The green slice is roughly what still grows here.
Food is 6.5% of everything Australia imports (2025, World Bank). Farming itself is 2.3% of the economy and 47.2% of the land is agricultural, of which 4% is arable. The green slice is roughly what still grows here.
What is killing people in Australia? The imported diet.
Cause of death, and the diet behind it.
Non-communicable diseases, all combined89.6%
Diabetes7.4%
Adults living with overweight or obesity. 64%.
Can Australia feed itself?
4.0%
Arable land
47.2%
Agricultural land
329,147
Farmers
76,577,044
Arable acres
2.3%
Agriculture, share of GDP
Harvest: Southern-hemisphere summer and autumn, December to May, while the tropical north runs on a wet season (November to April) and dry season (May to October).
Feeding itself
Australia is a major net food exporter, selling roughly 70 per cent of its agricultural production abroad while importing only about 11 per cent of the food it consumes by value (ABARES). More than nine in ten of the fresh fruit, vegetables, meat, milk and eggs on supermarket shelves are domestically produced.
Certification
Australia holds the largest area of certified organic agricultural land of any country on Earth, about 53 million hectares in recent FiBL/IFOAM data, most of it extensive organic grazing rangeland rather than intensive cropland. FiBL put the organic share of farmland near 10 per cent.
Water for crops
Australia is the driest inhabited continent and its populous south depends on the chronically over-allocated Murray-Darling Basin and on seawater desalination plants that back up Perth, Sydney, Melbourne and Adelaide during recurrent drought. Against that supply stress, drinking water is safe for almost the whole population, with the WHO/UNICEF JMP putting safely managed access near 99 per cent, though a minority of remote Indigenous communities still fall short.
Why the organic number looks like that. Certified-organic farmland is not separately reported for Australia, and that is a certification gap rather than proof nothing is grown cleanly. What the official land record does show: 47.2% of the country is agricultural land and 4% is arable (2023, World Bank). Certification is paid for per farm per year by a foreign body, which prices out smallholders, so the organic number reads worse than the practice.
The plant-based kitchen here is not an import. By tonnage, the largest crops grown in Australia are wheat, sugarcane, barley and rape or colza seed (FAO, FAOSTAT crop production, 2024). That is what the land itself puts on a plate.
Buy direct where residents buy: Belligen Growers Market, Berrima Schoolyard Market, Bittern Sunday market, Carlton Farmers Market, Ceres Makers and Flea Market, Coffs Coast Growers Market. Each is a mapped, named marketplace, so the money stays with the seller rather than the importer. OpenStreetMap.
Australia is one of the highest per-person emitters in the world at about 14.5 tonnes of CO2 in 2024, and it remains a leading global exporter of coal and gas. Renewables reached 38.6 per cent of electricity generation in 2025 and are rising quickly, and the Climate Change Act 2022 legislates net zero by 2050 with a 43 per cent cut on 2005 levels by 2030. Yet the scale of continuing fossil-fuel extraction and export, alongside very high domestic emissions, keeps the overall picture heavy. On this measure the country sits in the lowest band despite genuine progress in the power sector.
What powers Australia?
Renewable 38.7%Fossil 61.3%
Climate pollution per person
The safe amount, what the planet can absorb
2 tonnes
One person here
14.1 tonnes
The world average, for comparison
4.7 tonnes
The worst it ever got
19.24 tonnes
The grid
Australia is one of the highest per-person emitters in the world at about 14.5 tonnes of CO2 in 2024, and it remains a leading global exporter of coal and gas. Renewables reached roughly 35 per cent of electricity generation in 2023 and are rising quickly, and the Climate Change Act 2022 legislates net zero by 2050 with a 43 per cent cut on 2005 levels by 2030.
Pollution
Every state and territory has banned lightweight single-use plastic bags, and most have progressively banned straws, cutlery, plates and polystyrene between 2021 and 2023. Ambient air is clean, with a modelled PM2.5 annual mean around 6.4 micrograms per cubic metre (World Bank), close to the WHO guideline.
Water stress
Australia is the driest inhabited continent and its populous south depends on the chronically over-allocated Murray-Darling Basin and on seawater desalination plants that back up Perth, Sydney, Melbourne and Adelaide during recurrent drought. Against that supply stress, drinking water is safe for almost the whole population, with the WHO/UNICEF JMP putting safely managed access near 99 per cent, though a minority of remote Indigenous communities still fall short.
What pollutes most here
1The gridThe share of electricity still generated from fossil fuel.64.9%
2IndustryOpen-cut coal and gas in the Hunter Valley and Bowen Basin, plus broadscale land clearing..named
3AirModelled annual mean against a WHO guideline of 5 µg/m³.6.4
4On the recordEvery state and territory has banned lightweight single-use plastic bags, and most have progressively banned straws, cutlery, plates and polystyrene between 2021 and 2023.
What has Australia promised on climate?
Net zero, whole economy2050
Electricity renewable today26.7% (2021)
Land protected, against a 30% target22% by 2025
Sea protected, against a 30% target45.4% by 2025
The net-zero target year on file with Climate Watch is 2050, status: in law; in policy document. Measured against it, 26.7% of electricity is already renewable (2021, World Bank), so 73.3% of the grid is still to be converted. The pledge on file is measured here against what has actually been delivered, not taken on its own (UNFCCC NDC Registry, CBD Kunming-Montreal Target 3).
The biggest line item
One return flight against a whole year of living.
A resident's entire year14.1 t CO2e
Safe-climate budget, per year2 t CO2e
London return, economy3.06 t CO2e
Paris return, economy3.05 t CO2e
Frankfurt return, economy2.96 t CO2e
New York return, economy2.93 t CO2e
Los Angeles return, economy2.22 t CO2e
How much CO2 does flying to Australia emit?
Tap where you would fly from. One return flight, economy.
Every prompt runs on a machine in a building on somebody’s grid. What that costs the planet depends less on the prompt than on what is burning to power it. Here is what would power one in Australia.
Data centres
160
Registered colocation and interconnection facilities, PeeringDB, 2026
Grid renewable
38.7 %
What a machine here runs on.
What powers a data centre in Australia?
Most of the power behind a machine here is still burned.
Renewable 38.7%Fossil 61.3%
Cooling water. Every one of those halls runs on the national grid, which is 26.7% renewable today (World Bank). A data centre is only as clean as the electricity behind it, so the same figure that decides this country's climate score also decides the footprint of the AI running inside it. Cooling water use is not separately published by facility, and no operator here reports it.
The rules. Australia has 160 colocation and interconnection facilities on the public PeeringDB register, concentrated in Sydney (15), Brisbane (13), Adelaide (12), alongside 36 internet exchanges (IX Australia Perth (WA-IX), Equinix Sydney, ACTIX, IX Australia Melbourne (VIC-IX)). Named sites include Equinix SY1/SY2 - Sydney, PIPE Networks Brisbane, PIPE Networks Sydney, PIPE Networks Melbourne.
Where the cables land. 27 landing points · Adelaide, SA, Alexandria, NSW, Alyangula, NT, Boat Harbour, TAS
74% residents to 26% visitors across a year. 9,466,000 international arrivals in 2019 against 27,614,411 people who live here (2025, World Bank / UN Tourism).
Where a visitor dollar goes in Australia
1,828k
Visitors a year
0.1
Visitors per resident
How deep in debt is Australia?· for every $100 Australia earns in a year, it owes…
Pay to the order of: the creditorsmemo · the 2020 peak
$ 57The worst year on the IMF record. Australia owed $57 for every $100 it earned.
IMF World Economic Outlook, 2020signed, the creditors
Pay to the order of: the creditorsmemo · today
$ 51What is owed now, for every $100 of national income (2026).
IMF World Economic Outlook, 2026signed, the creditors
Pay to the order of: the creditorsmemo · projected 2031
$ 49The IMF's own forecast has this falling to $49 by 2031.
IMF World Economic Outlook projection, 2031signed, the forecast
For every $100 Australia earns in a year, it owes $51 (2026, IMF World Economic Outlook). The interest on that is paid before schools, clinics or coastline get their turn.
Where does a tourist dollar actually go in Australia?
Play one tourist dollar around the board. Every square is a measured fact from this page.
START!
1
GO: a visitor lands
$100 goes on the table. 9,466,000 international arrivals in 2019 against 27,614,411 residents, one visitor a year for every 3 residents (World Bank / UN Tourism).
$100 in play
2
The bed
Who owns the largest places to stay in Australia is not published in the records we can check, so this square is left open rather than guessed. Where a listing names its owner, it is shown in the ownership table below.
not published
3
The plate
Food is only 6.5% of everything Australia imports (2025, World Bank), so most of a meal is bought from producers inside the country. Eating what the land here actually grows, wheat, sugarcane, barley, rapeseed, cotton, sorghum, lentils, grapes, keeps that money with the grower.
mostly home-grown
4
The power
73.3% of the electricity is fossil (2021, World Bank). Lighting, cooling and hot water are paid for largely in imported fuel.
burns away
5
What actually stays
On the parts that can be measured, the power leaves and the plate stays. It is genuinely a coin toss, decided by what you book.
split
6
Pay the bank first
Australia owes $51 for every $100 it earns (IMF World Economic Outlook, 2026 projection). The interest is paid before anything else on this board.
$51 per $100
7
No plan B
35.0% of everything Australia sells abroad is mineral fuels and oils (2023, UN Comtrade). One market moving takes the whole board with it.
35.0% one export
8
Community chest
Tourism earns 8.7% of everything Australia makes from exports (2020, World Bank / UN Tourism). That is how much of the economy depends on the game continuing.
8.7% of exports
9
The flight
Getting here is usually the biggest single line on the bill. From London a return economy seat is 3.06 t CO2, on the UK Government's published conversion factors. It is the one part of the trip this board cannot reduce.
3.06 t CO2
10
Back to GO
The economy turns over about US$2,124 billion a year (IMF World Economic Outlook, 2026 projection). Every lap of this board is a choice about how much of it stays.
US$2,124bn
GDPUS$1,798.5bn
Agriculture, share of GDP2.3%
Visitors a year1,828,000
Visitors per resident0.1
Residents~27,614,411
Agriculture
Farming is 2.3% of the economy. Australia is a major net food exporter, selling roughly 70 per cent of its agricultural production abroad while importing only about 11 per cent of the food it consumes by value (ABARES).
Natural materials
Australia is the world's largest producer of fine apparel wool and its biggest wool exporter, led by Merino from a national flock of tens of millions of sheep (China shears more greasy wool by weight, FAOSTAT 2024), and irrigated cotton is a major crop. Alongside the pastoral wool heritage sit rich Indigenous fibre traditions such as spinifex and pandanus string bags and possum-skin cloaks.
Energy
Australia is one of the highest per-person emitters in the world at about 14.5 tonnes of CO2 in 2024, and it remains a leading global exporter of coal and gas. Renewables reached roughly 35 per cent of electricity generation in 2023 and are rising quickly, and the Climate Change Act 2022 legislates net zero by 2050 with a 43 per cent cut on 2005 levels by 2030.
Who owns the biggest hotels in Australia?
By rooms · company records and press.
Brogers End · ~2 roomsIndependentnot published
Silky Oaks Lodge · ~40 roomsCorporatenot published
Southern Ocean Lodge · ~25 roomsIndependentnot published
Daintree Ecolodge · ~15 roomsIndependentnot published
Elysian Eco Retreat · ~10 roomsIndependentnot published
Mt. Mulligan Lodge · ~12 roomsIndependentnot published
Saffire Freycinet · ~20 roomsCorporatenot published
Visitors, over time
20157,449k
20168,269k
20178,815k
20189,246k
20199,466k
20201,828k
International tourism receipts run at about US$26.23 billion in 2020 (World Bank / UN Tourism). That is 8.7% of everything the country earns from exports.
How much of your money actually stays here?
Tap the holiday you are planning.
All-inclusive resortForeign-owned hotel and tourist restaurantsLocally owned stay and local restaurantsGuesthouse, markets and public transport
Resort guest, villa renter, family, nomad or backpacker. The honest playbook for each, from the same sourced numbers.
Already booked a resort? · the rescue list
Five swaps that move your money back on-island
1. Eat where the country eats Choose kitchens cooking what the land here grows, wheat, sugarcane, barley, rapeseed, cotton, sorghum, lentils and grapes, over an imported menu. The checked list →
2. Book with a local operator Never the lobby desk. The margin on a tour is the part that stays. Eco tours →
3. Stay somewhere locally owned Ownership decides where the room rate books. Eco stays →
4. Use the transport residents use Vast distances mean domestic flights for long hauls and self-drive road trips, with good trains, trams and ferries within the cities.
5. Buy the craft, not the souvenir Natural-materials work made here pays the maker directly; imported gifts pay a shipping line.
swipe →
First time here
Australia pairs the planet's most distinctive wildlife and an enormous protected estate on land and sea with clean air and abundant home-grown food, offset by drought-prone water and a heavy coal and gas export economy.
Best time: Spring (September to November) and autumn (March to May) for the south and east; the tropical north is best in the dry season, May to October.
Getting around
Vast distances mean domestic flights for long hauls and self-drive road trips, with good trains, trams and ferries within the cities.
Transport is where the fare either stays or leaves.
Eating here
The everyday plate that actually grows here is wheat, sugarcane, barley, rapeseed, cotton, sorghum, lentils and grapes. Ordering those keeps the money with the grower and cuts the imported share of the meal.
Eating what the country grows is the cheapest way to cut the import bill.
Good to know
Cards everywhere, cash almost never needed; AUD. Drive on the left.
None of the 7 properties listed here publishes who ultimately owns it, so no claim is made either way. Ownership is what decides how much of a room rate stays in the country, which is why we show it when a listing states it.
Society and Governance in Australia.
How well is Australia actually run?
Governance, measured · World Bank WGI
Four measured answers, none of them opinion. Averaged across corruption control, delivery and accountability, Australia scores 85 out of 100 (2024, World Bank Worldwide Governance Indicators). That is a state that generally does what it says it will do, which is what makes a climate pledge worth reading.
How well is Australia run? · each scored out of 100, higher is better
Clean government, scored 85 of 100
Control of corruption scores 85.3 out of 100 (2024, World Bank Worldwide Governance Indicators). That puts it in the cleanest quarter of governments measured.
85
Freedom and rights, scored 83 of 100
Voice and accountability, which measures free expression, free media and the ability to choose a government, scores 83.3 out of 100 (2024, World Bank WGI). Citizens here can question their government openly.
83
Government effectiveness, scored 87 of 100
Government effectiveness, which measures the quality of public services and how well policy is actually delivered, scores 86.5 out of 100 (2024, World Bank WGI). Delivery is rated among the strongest measured.
87
Income equality, scored 34 of 100
The Gini index of income inequality reads 33.8 (2020, World Bank). Zero is perfect equality and 100 is one person holding everything. Below 40 is the level usually treated as manageable, and Australia sits inside it.
34
LGBTQ+ status: HighSolo female travel: EasyIndustry to avoid: Open-cut coal and gas in the Hunter Valley and Bowen Basin, plus broadscale land clearing.
What is daily life in Australia really like? Measured
Getting around, breathing, throwing away, learning. The honest checklist.
TransportAirWaterWastePower
✓How you get around Vast distances mean domestic flights for long hauls and self-drive road trips, with good trains, trams and ferries within the cities.
✓Air quality, measured Modelled annual mean 6.4. The WHO guideline is 5 µg/m³.
✓Where the air is cleanest Tasmania's north-west coast, where the Cape Grim station records some of the cleanest air on Earth.
✓Tap water Drinkable
✓What to drink Tap water is safe and excellent in cities; carry it in the Outback where bores and tanks are the norm.
✓Plastic rules Every state and territory has banned lightweight single-use plastic bags, with progressive bans on straws, cutlery and polystyrene rolled out from 2021 to 2023.
✓Sockets and voltage Type I, 230V
Made in Australia.
Australia is the world's largest producer of fine apparel wool and its biggest wool exporter, led by Merino from a national flock of tens of millions of sheep (China shears more greasy wool by weight, FAOSTAT 2024), and irrigated cotton is a major crop. Alongside the pastoral wool heritage sit rich Indigenous fibre traditions such as spinifex and pandanus string bags and possum-skin cloaks. Every step of processing done at home is value that stops leaving the country.
What Australia actually sells the world
The single biggest thing Australia sells the world is mineral fuels and oils, 35.0% of all exports in 2023 (about US$129.17 billion, UN Comtrade). The next four are ores, slag and ash at 28.1%, pearls, gemstones and precious metals at 5.4%, cereals at 3.5%, salt, sulphur, stone and cement at 3.5%.
Sells now · 35.0% of exports
Mineral fuels and oils
Mineral fuels and oils is 35.0% of everything Australia sold abroad in 2023, worth about US$129.17 billion. UN Comtrade.
Sells now · 28.1% of exports
Ores, slag and ash
Ores, slag and ash is 28.1% of everything Australia sold abroad in 2023, worth about US$103.64 billion. UN Comtrade.
Sells now · 5.4% of exports
Pearls, gemstones and precious metals
Pearls, gemstones and precious metals is 5.4% of everything Australia sold abroad in 2023, worth about US$20.06 billion. UN Comtrade.
Sells now · 3.5% of exports
Cereals
Cereals is 3.5% of everything Australia sold abroad in 2023, worth about US$12.86 billion. UN Comtrade.
Sells now · 3.5% of exports
Salt, sulphur, stone and cement
Salt, sulphur, stone and cement is 3.5% of everything Australia sold abroad in 2023, worth about US$12.82 billion. UN Comtrade.
Buys in · 15.6% of imports
Vehicles
Australia imported US$44.86 billion of vehicles in 2023, 15.6% of everything it bought abroad, and sells none of it back. Every point of that is a business that could be built at home rather than shipped in. UN Comtrade.
Buys in · 14.0% of imports
Machinery and mechanical appliances
Australia imported US$40.41 billion of machinery and mechanical appliances in 2023, 14.0% of everything it bought abroad, and sells none of it back. Every point of that is a business that could be built at home rather than shipped in. UN Comtrade.
Buys in · 10.3% of imports
Electrical machinery and electronics
Australia imported US$29.70 billion of electrical machinery and electronics in 2023, 10.3% of everything it bought abroad, and sells none of it back. Every point of that is a business that could be built at home rather than shipped in. UN Comtrade.
Buys in · 3.9% of imports
Pharmaceuticals
Australia imported US$11.35 billion of pharmaceuticals in 2023, 3.9% of everything it bought abroad, and sells none of it back. Every point of that is a business that could be built at home rather than shipped in. UN Comtrade.
The maths for an entrepreneur. Australia produces about US$1,799 billion a year, which is roughly US$65,130 per person (2025, World Bank). Farming is 2.3% of that, while food is 6.5% of everything the country imports. The country buys in more food than its own farms contribute to the economy, and every point of that gap is a business someone could build here rather than ship in.
A living tradition of Australia, still practised rather than archived.
Dreaming
A living tradition of Australia, still practised rather than archived.
Corroboree ceremony
A living tradition of Australia, still practised rather than archived.
Yidaki (didgeridoo)
A living tradition of Australia, still practised rather than archived.
Torres Strait Islander dance and songA living tradition of Australia, still practised rather than archived.
Does Australia protect its heritage by law?
Partly, and the gaps say as much as the protections.
What is kept alive. Australia is home to the world's oldest continuous living cultures, with Aboriginal and Torres Strait Islander traditions stretching back tens of thousands of years. Songlines, or Dreaming tracks, map Country through story and song, and ceremony, corroboree, the yidaki (didgeridoo) and Torres Strait Islander dance remain living practice. Colonisation, dispossession and language loss disrupted much of this heritage, though revival work, Indigenous ranger programmes and Welcome to Country ceremonies sustain it today.
Who it belongs to. Aboriginal and Torres Strait Islander peoples hold the world's oldest continuous living cultures, stretching back more than 60,000 years, and Indigenous-led tourism is a growing sector supported by initiatives such as Discover Aboriginal Experiences. Indigenous Protected Areas make up a large share of the National Reserve System, and caring-for-Country land management including cultural burning is increasingly central. Benefit-sharing is still developing and the wider tourism economy remains mainstream.
Only here. The platypus, an egg-laying mammal that lives in the wild only in Australia..
Three futures for Australia, every one run forward from measured data.
Where the making actually happens
Named cultural and craft sites on the open map: Tamworth Regional Craft Centre (Tamworth), Burnside Arts and Craft Centre (Adelaide), Craft and Design Centre (Canberra), History and Craft Centre (Townsville), Walker Street Craft Centre (Bundaberg). OpenStreetMap.
Every measured trend on one line
Run forward at the pace already recorded.
+1%
Forest cover
1995: 17.3 % → 2023: 17.4 %
+178%
Renewable electricity
1995: 9.6 % → 2021: 26.7 %
-16%
CO2 per person
1995: 16.8 t → 2024: 14.1 t
-51%
Tourist arrivals
1995: 3726 k → 2020: 1828 k
+71%
Protected land
2013: 12.9 % → 2025: 22 %
-59%
Farm workforce
1995: 5.32 % → 2025: 2.18 %
+3%
Protected sea
2013: 43.9 % → 2025: 45.4 %
-22%
Agricultural land
1995: 60.3 % → 2023: 47.2 %
+3%
Urban population
1995: 85.3 % → 2025: 87.7 %
+5%
Air pollution
1995: 6.13 µg/m³ → 2023: 6.42 µg/m³
-31%
Fresh water per person
1995: 27325.9 m³ → 2022: 18909.5 m³
+25%
Adult overweight
1995: 51.1 % → 2022: 64 %
+0%
Electricity access
1995: 100 % → 2024: 100 %
+218%
GDP per person
1995: 20479 → 2025: 65130
+53%
Population
1995: 18005 k → 2025: 27614 k
+50%
Renewable energy use
1995: 8.2 % → 2021: 12.3 %
-8%
Energy per person
1995: 5138 kg → 2024: 4751 kg
+19%
Protected area, total
2013: 28.1 % → 2025: 33.5 %
+7%
Life expectancy
1995: 77.8 yrs → 2024: 83.1 yrs
+45%
Cereal yield
1995: 1860 ha → 2024: 2690 ha
-8%
Fertiliser use
1995: 111.4 ha → 2023: 102.7 ha
-17%
Rural population
1995: 14.7 % → 2025: 12.3 %
+283%
Water productivity
1995: 35.7 $/m3 → 2022: 137 $/m3
+37%
Health spending
2000: 7.6 % → 2023: 10.4 %
+1%
Forest area
1995: 1328482 km2 → 2023: 1340051 km2
+9%
Electric power use
1995: 9028 kWh → 2024: 9801 kWh
+20%
Emissions: Agriculture
1990: 179.4 e → 2023: 214.6 e
+44%
Emissions: Building
1990: 9.4 e → 2023: 13.5 e
+39%
Emissions: Electricity/Heat
1990: 143.2 e → 2023: 199.8 e
+44%
Emissions: Energy
1990: 288.7 e → 2023: 416.3 e
+58%
Emissions: Industrial Processes
1990: 11.6 e → 2023: 18.4 e
-7%
Emissions: Manufacturing/Construction
1990: 43.1 e → 2023: 40.2 e
World Bank open data, recorded series
How much forest is left?
Forest cover moved from 17.3% to 17.4% across 28 recorded years.
World Bank AG.LND.FRST.ZS
How clean is the grid?
Renewable electricity moved from 9.6% to 26.7% across 26 recorded years.
World Bank EG.ELC.RNEW.ZS
How much climate pollution per person?
CO2 per person moved from 16.8 t to 14.1 t across 29 recorded years.
World Bank EN.GHG.CO2.PC.CE.AR5
How many people visit?
Tourist arrivals moved from 3726k to 1828k across 25 recorded years.
World Bank ST.INT.ARVL
How much land is protected?
Protected land moved from 12.9% to 22.0% across 12 recorded years.
World Bank ER.LND.PTLD.ZS
How many people still farm?
Farm workforce moved from 5.3% to 2.2% across 30 recorded years.
World Bank SL.AGR.EMPL.ZS
How much sea is protected?
Protected sea moved from 43.9% to 45.4% across 12 recorded years.
World Bank ER.MRN.PTMR.ZS
How much land is farmed?
Agricultural land moved from 60.3% to 47.2% across 28 recorded years.
World Bank AG.LND.AGRI.ZS
How fast is it urbanising?
Urban population moved from 85.3% to 87.7% across 30 recorded years.
World Bank SP.URB.TOTL.IN.ZS
Is the air getting cleaner?
Air pollution moved from 6.1 µg/m³ to 6.4 µg/m³ across 28 recorded years.
World Bank EN.ATM.PM25.MC.M3
Is water getting scarcer?
Fresh water per person moved from 27325.9 m³ to 18909.5 m³ across 27 recorded years.
World Bank ER.H2O.INTR.PC
Is diet-related disease rising?
Adult overweight moved from 51.1% to 64.0% across 27 recorded years.
World Bank SH.STA.OWAD.ZS
Who has power?
Electricity access moved from 100.0% to 100.0% across 29 recorded years.
World Bank EG.ELC.ACCS.ZS
Is income rising?
GDP per person moved from 20479 to 65130 across 30 recorded years.
World Bank NY.GDP.PCAP.CD
How fast is it growing?
Population moved from 18005k to 27614k across 30 recorded years.
World Bank SP.POP.TOTL
What share of all energy is renewable?
Renewable energy use moved from 8.2% to 12.3% across 26 recorded years.
World Bank EG.FEC.RNEW.ZS
How much energy does one person use?
Energy per person moved from 5138 kg to 4751 kg across 29 recorded years.
World Bank EG.USE.PCAP.KG.OE
How much land and sea is protected together?
Protected area, total moved from 28.1% to 33.5% across 12 recorded years.
World Bank ER.PTD.TOTL.ZS
How long do people live?
Life expectancy moved from 77.83 yrs to 83.05 yrs across 29 recorded years.
World Bank SP.DYN.LE00.IN
How much does a hectare of cereal produce?
Cereal yield moved from 1860 kg/ha to 2690 kg/ha across 29 recorded years.
World Bank AG.YLD.CREL.KG
How much fertiliser goes on the land?
Fertiliser use moved from 111.39 kg/ha to 102.69 kg/ha across 28 recorded years.
World Bank AG.CON.FERT.ZS
How many people still live rurally?
Rural population moved from 14.71% to 12.28% across 30 recorded years.
World Bank SP.RUR.TOTL.ZS
How much value per cubic metre of water?
Water productivity moved from 35.74 $/m3 to 137.04 $/m3 across 27 recorded years.
World Bank ER.GDP.FWTL.M3.KD
How much goes on health?
Health spending moved from 7.59% to 10.4% across 23 recorded years.
World Bank SH.XPD.CHEX.GD.ZS
How much forest is there in total?
Forest area moved from 1328482 km2 to 1340051 km2 across 28 recorded years.
World Bank AG.LND.FRST.K2
How much electricity per person?
Electric power use moved from 9028 kWh to 9801 kWh across 29 recorded years.
World Bank EG.USE.ELEC.KH.PC
How have agriculture emissions moved?
Agriculture emissions moved from 179.38 to 214.6 MtCO2e across 33 recorded years.
Climate Watch (WRI), historical emissions
How have building emissions moved?
Building emissions moved from 9.36 to 13.46 MtCO2e across 33 recorded years.
Climate Watch (WRI), historical emissions
How have electricity/heat emissions moved?
Electricity/Heat emissions moved from 143.23 to 199.79 MtCO2e across 33 recorded years.
Climate Watch (WRI), historical emissions
How have energy emissions moved?
Energy emissions moved from 288.71 to 416.29 MtCO2e across 33 recorded years.
Climate Watch (WRI), historical emissions
How have industrial processes emissions moved?
Industrial Processes emissions moved from 11.61 to 18.35 MtCO2e across 33 recorded years.
Climate Watch (WRI), historical emissions
How have manufacturing/construction emissions moved?
Manufacturing/Construction emissions moved from 43.09 to 40.21 MtCO2e across 33 recorded years.
Climate Watch (WRI), historical emissions
Worst caseCurrent pathBest case
Worst case
Every measured decline continues at the pace already recorded. The weakest pillar, energy at 1/5, is the one that gives way first.
Computed from: recorded series extended with no policy change
Current path
Every line above is a recorded World Bank series for this country. The current path is simply those series continuing at the pace already measured.
Computed from: recorded series, no policy change assumed
Best case
The pledges are met on their own stated timetables and the weakest pillars are lifted to match the strongest. Australia already shows it can do this: food and farming scores 5/5.
Computed from: each published target delivered on its own date
What the best case actually asks for
Lift energy
It scores 1 out of 5 today, among the weakest parts of Australia's record. Australia is one of the highest per-person emitters in the world at about 14.5 tonnes of CO2 in 2024, and it remains a leading global exporter of coal and gas. Renewables reached roughly 35 per cent of electricity generation in 2023 and are rising quickly, and the Climate Change Act 2022 legislates net zero by 2050 with a 43 per cent cut on 2005 levels by 2030. Yet the scale of continuing fossil-fuel extraction and export, alongside very high domestic emissions, keeps the overall picture heavy. On this measure the country sits in the lowest band despite genuine progress in the power sector. Lifting it toward the 5/5 the strongest pillars already reach is what the best case turns on.
measured each year
Costs: spending and enforcement, not new technology
Lift heritage
It scores 3 out of 5 today, among the weakest parts of Australia's record. Australia is home to the world's oldest continuous living cultures, with Aboriginal and Torres Strait Islander traditions stretching back tens of thousands of years. Songlines, or Dreaming tracks, map Country through story and song, and ceremony, corroboree, the yidaki (didgeridoo) and Torres Strait Islander dance remain living practice. Colonisation, dispossession and language loss disrupted much of this heritage, though revival work, Indigenous ranger programmes and Welcome to Country ceremonies sustain it today. Settler culture adds bush ballads and folk forms, but the deep tradition is Indigenous and, while enduring, remains disrupted. Lifting it toward the 5/5 the strongest pillars already reach is what the best case turns on.
measured each year
Costs: spending and enforcement, not new technology
Lift natural fibres
It scores 3 out of 5 today, among the weakest parts of Australia's record. Australia is the world's largest producer of fine apparel wool and its biggest wool exporter, led by Merino from a national flock of tens of millions of sheep (China shears more greasy wool by weight, FAOSTAT 2024), and irrigated cotton is a major crop. Alongside the pastoral wool heritage sit rich Indigenous fibre traditions such as spinifex and pandanus string bags and possum-skin cloaks. These are living, working material cultures rather than museum crafts. Lifting it toward the 5/5 the strongest pillars already reach is what the best case turns on.
measured each year
Costs: spending and enforcement, not new technology
Government and Goals in Australia.
Who is in charge of Australia now · Office-holders from the UN Protocol and Liaison Service public list of Heads of State and Heads of Government, 8 September 2026. Legislature and election dates from IFES ElectionGuide. Constitution dates from the Constitute Project. Governance scores from the World Bank Worldwide Governance Indicators 2024.
Anthony Albanese
Prime Minister
Anthony Albanese is the head of government of Australia, in office since 23 May 2022. Every climate, protection and energy pledge on this page is delivered, or not, under this administration.
Public opinion, measured
Voice and accountability, the freedom to question government: 83.3 / 100. Among the strongest measured. World Bank WGI 2024
Control of corruption: 85.3 / 100. Among the strongest measured. World Bank WGI 2024
Political stability and absence of violence: 79.4 / 100. Among the strongest measured. World Bank WGI 2024
Rule of law: 82.3 / 100. Among the strongest measured. World Bank WGI 2024
Regulatory quality: 82 / 100. Among the strongest measured. World Bank WGI 2024
Anthony AlbanesePrime Minister
ParliamentLegislature, bicameral
Last election3 May 2025
Constitution1901, as revised to 1985
Government typefederal parliamentary democracy under a constitutional monarchy; a Commonwealth realm
Australia national goals: climate commitments on record · as recorded by Climate Watch, World Resources Institute
2050
Net zero
In Law<br>In Policy Document
Net-zero target as recorded by Climate Watch. Status: In Law (9/8/2022) In Policy Document (10/16/2021) ↗
The questions people actually type, answered in full sentences from the sourced data above.
swipe →
Is Australia sustainable?
Australia scores 70 out of 100 on the Throne Eco Index, across twelve equally weighted pillars. Australia pairs the planet's most distinctive wildlife and an enormous protected estate on land and sea with clean air and abundant home-grown food, offset by drought-prone water and a heavy coal and gas export economy.
Is the water in Australia safe and plentiful?
Australia is the driest inhabited continent and its populous south depends on the chronically over-allocated Murray-Darling Basin and on seawater desalination plants that back up Perth, Sydney, Melbourne and Adelaide during recurrent drought. Against that supply stress, drinking water is safe for almost the whole population, with the WHO/UNICEF JMP putting safely managed access near 99 per cent, though a minority of remote Indigenous communities still fall short. The tropical north and Tasmania hold far more freshwater than the settled south-east.
Can Australia feed itself?
Australia is a major net food exporter, selling roughly 70 per cent of its agricultural production abroad while importing only about 11 per cent of the food it consumes by value (ABARES). More than nine in ten of the fresh fruit, vegetables, meat, milk and eggs on supermarket shelves are domestically produced. It is one of the world's largest beef, wheat, wool and canola exporters.
Is it easy to eat plant-based in Australia?
Fresh local produce is available year-round across climate zones from the tropical north to temperate Tasmania, and Melbourne and Sydney have among the most developed plant-based and vegan dining scenes in the world. Native bush foods such as macadamia, finger lime, wattleseed and vitamin-rich Kakadu plum are increasingly used. The mainstream diet remains meat-heavy, so plant-based eating is easy in cities but not the cultural default.
How much of Australia is actually protected?
The National Reserve System protects roughly 22 to 23 per cent of Australia's land across more than 14,500 areas, and marine protected areas cover about 45 per cent of its waters, rising above 50 per cent after the 2024 Heard and McDonald Islands expansion (World Bank, Pew). The flagship Great Barrier Reef Marine Park spans 344,000 square kilometres and enforcement through Parks Australia and GBRMPA is strong. A large share of the marine estate is only partially protected multiple-use zoning, and the reef is under climate stress.
What wildlife is left in Australia?
Australia's endemism is extraordinary: more than 80% of its native mammals live nowhere else, including the world's only egg-laying mammals, the platypus and echidnas, and the greatest diversity of marsupials on Earth. Iconic species include the koala, kangaroo, wombat and quokka. The record is not spotless, as Australia has suffered the worst modern mammal-extinction rate of any country, but fenced feral-predator sanctuaries and rewilding are expanding.
Is Australia on clean energy?
Australia is one of the highest per-person emitters in the world at about 14.5 tonnes of CO2 in 2024, and it remains a leading global exporter of coal and gas. Renewables reached roughly 35 per cent of electricity generation in 2023 and are rising quickly, and the Climate Change Act 2022 legislates net zero by 2050 with a 43 per cent cut on 2005 levels by 2030. Yet the scale of continuing fossil-fuel extraction and export, alongside very high domestic emissions, keeps the overall picture heavy.
How polluted is Australia?
Every state and territory has banned lightweight single-use plastic bags, and most have progressively banned straws, cutlery, plates and polystyrene between 2021 and 2023. Ambient air is clean, with a modelled PM2.5 annual mean around 6.4 micrograms per cubic metre (World Bank), close to the WHO guideline. The main caveats are episodic bushfire smoke that can spike air quality badly, as in the 2019 to 2020 Black Summer, and high per-capita plastic consumption.
Does recycling work in Australia?
Kerbside recycling is near-universal and Australia recovers around 60 per cent across all waste streams, though household municipal recycling sits lower at roughly 46 per cent (National Waste Report). Most of the recovered tonnage is construction, demolition and commercial waste rather than household material. Container-deposit schemes now operate in most states.
Is the farming in Australia organic?
Australia holds the largest area of certified organic agricultural land of any country on Earth, about 53 million hectares in recent FiBL/IFOAM data, most of it extensive organic grazing rangeland rather than intensive cropland. FiBL put the organic share of farmland near 10 per cent. The scale is unmatched even if it reflects vast low-intensity pastoral country.
Are there natural materials and craft in Australia?
Australia is the world's largest producer of fine apparel wool and its biggest wool exporter, led by Merino from a national flock of tens of millions of sheep (China shears more greasy wool by weight, FAOSTAT 2024), and irrigated cotton is a major crop. Alongside the pastoral wool heritage sit rich Indigenous fibre traditions such as spinifex and pandanus string bags and possum-skin cloaks. These are living, working material cultures rather than museum crafts.
Is there living culture in Australia?
Aboriginal and Torres Strait Islander peoples hold the world's oldest continuous living cultures, stretching back more than 60,000 years, and Indigenous-led tourism is a growing sector supported by initiatives such as Discover Aboriginal Experiences. Indigenous Protected Areas make up a large share of the National Reserve System, and caring-for-Country land management including cultural burning is increasingly central. Benefit-sharing is still developing and the wider tourism economy remains mainstream.
What heritage does Australia keep alive?
Australia is home to the world's oldest continuous living cultures, with Aboriginal and Torres Strait Islander traditions stretching back tens of thousands of years. Songlines, or Dreaming tracks, map Country through story and song, and ceremony, corroboree, the yidaki (didgeridoo) and Torres Strait Islander dance remain living practice. Colonisation, dispossession and language loss disrupted much of this heritage, though revival work, Indigenous ranger programmes and Welcome to Country ceremonies sustain it today.
So is Australia actually green? The measured answer
What is working: sea protected at 45.4%.
What is not: renewable electricity at 26.7% against a 100% mark.
Australia sits 26 of 77 at 70/100. Every name links to its own destination page, built exactly like this one. The full ranking →
What is Australia particularly good at?
✓Food and farming, scored 5/5. Australia is a major net food exporter, selling roughly 70 per cent of its agricultural production abroad while importing only about 11 per cent of the food it consumes by value (ABARES). More than nine in ten of the fresh fruit, vegetables, meat, milk and eggs on supermarket shelves are domestically produced. It is one of the world's largest beef, wheat, wool and canola exporters.
✓Conservation, scored 4/5. The National Reserve System protects roughly 22 to 23 per cent of Australia's land across more than 14,500 areas, and marine protected areas cover about 45 per cent of its waters, rising above 50 per cent after the 2024 Heard and McDonald Islands expansion (World Bank, Pew). The flagship Great Barrier Reef Marine Park spans 344,000 square kilometres and enforcement through Parks Australia and GBRMPA is strong. A large share of the marine estate is only partially protected multiple-use zoning, and the reef is under climate stress.
✓Culture, scored 4/5. Aboriginal and Torres Strait Islander peoples hold the world's oldest continuous living cultures, stretching back more than 60,000 years, and Indigenous-led tourism is a growing sector supported by initiatives such as Discover Aboriginal Experiences. Indigenous Protected Areas make up a large share of the National Reserve System, and caring-for-Country land management including cultural burning is increasingly central. Benefit-sharing is still developing and the wider tourism economy remains mainstream.
Where does Australia score worst?
✕Water, scored 3/5. Australia is the driest inhabited continent and its populous south depends on the chronically over-allocated Murray-Darling Basin and on seawater desalination plants that back up Perth, Sydney, Melbourne and Adelaide during recurrent drought. Against that supply stress, drinking water is safe for almost the whole population, with the WHO/UNICEF JMP putting safely managed access near 99 per cent, though a minority of remote Indigenous communities still fall short. The tropical north and Tasmania hold far more freshwater than the settled south-east.
✕Wildlife, scored 3/5. Australia's endemism is extraordinary: more than 80% of its native mammals live nowhere else, including the world's only egg-laying mammals, the platypus and echidnas, and the greatest diversity of marsupials on Earth. Iconic species include the koala, kangaroo, wombat and quokka. The record is not spotless, as Australia has suffered the worst modern mammal-extinction rate of any country, but fenced feral-predator sanctuaries and rewilding are expanding.
✕Energy, scored 1/5. Australia is one of the highest per-person emitters in the world at about 14.5 tonnes of CO2 in 2024, and it remains a leading global exporter of coal and gas. Renewables reached roughly 35 per cent of electricity generation in 2023 and are rising quickly, and the Climate Change Act 2022 legislates net zero by 2050 with a 43 per cent cut on 2005 levels by 2030. Yet the scale of continuing fossil-fuel extraction and export, alongside very high domestic emissions, keeps the overall picture heavy. On this measure the country sits in the lowest band despite genuine progress in the power sector.
Similar countries doing it better and worse
New ZealandScored on the same twelve pillars as Australia.80
FijiScored on the same twelve pillars as Australia.70
Papua New GuineaScored on the same twelve pillars as Australia.68
French PolynesiaScored on the same twelve pillars as Australia.63
A note from the lens of mother natureswipe →
Energy, 1/5
Australia is one of the highest per-person emitters in the world at about 14.5 tonnes of CO2 in 2024, and it remains a leading global exporter of coal and gas. Renewables reached roughly 35 per cent of electricity generation in 2023 and are rising quickly, and the Climate Change Act 2022 legislates net zero by 2050 with a 43 per cent cut on 2005 levels by 2030.
Consequence: It is the lowest-scoring part of Australia's record, so it is where the score moves first.
Food and farming, 5/5
Australia is a major net food exporter, selling roughly 70 per cent of its agricultural production abroad while importing only about 11 per cent of the food it consumes by value (ABARES). More than nine in ten of the fresh fruit, vegetables, meat, milk and eggs on supermarket shelves are domestically produced.
Heritage, 3/5
Australia is home to the world's oldest continuous living cultures, with Aboriginal and Torres Strait Islander traditions stretching back tens of thousands of years. Songlines, or Dreaming tracks, map Country through story and song, and ceremony, corroboree, the yidaki (didgeridoo) and Torres Strait Islander dance remain living practice.
The Australia Directory.
Everything on Hold The Throne that sits in Australia, checked and listed.
World Bank Worldwide Governance Indicators, 2024. Percentile among all governments measured.
Government effectiveness
86.5 / 100
World Bank Worldwide Governance Indicators, 2024. Percentile among all governments measured.
Rule of law
82.3 / 100
World Bank Worldwide Governance Indicators, 2024. Percentile among all governments measured.
Political stability
79.4 / 100
World Bank Worldwide Governance Indicators, 2024. Percentile among all governments measured.
Voice and accountability
83.3 / 100
World Bank Worldwide Governance Indicators, 2024. Percentile among all governments measured.
Environmental Performance Index
63.1 / 100 · 23 of 180
Yale Environmental Performance Index 2024, ranked 23 of 180 countries assessed.
Ecosystem vitality
62.5 / 100 · 40 of 180
Yale Environmental Performance Index 2024, ranked 40 of 180 countries assessed.
Biodiversity and habitat
55.2 / 100 · 64 of 180
Yale Environmental Performance Index 2024, ranked 64 of 180 countries assessed.
Air pollution
95.9 / 100 · 3 of 180
Yale Environmental Performance Index 2024, ranked 3 of 180 countries assessed.
Terrestrial biomes protected
67.1 / 100 · 61 of 180
Yale Environmental Performance Index 2024, ranked 61 of 180 countries assessed.
Marine protected areas
57.2 / 100 · 80 of 131
Yale Environmental Performance Index 2024, ranked 80 of 131 countries assessed.
How Australia Is Scored. The Throne Standard.
Every destination on the index is scored the same way, so a 4 in Barbados means exactly what a 4 means in Iceland. No self-declared data and no brochure claims are accepted. Every figure on this page carries its named source and year, and the history on each page names what empire took as plainly as it scores the present.
The 12 pillars every destination is scored on, equally weighted
01
Conservation
Land and sea actually protected, not pledged
02
Wildlife
What survives, what is endemic, what is lost
03
Water
Fresh water per person, and the ocean’s health
04
Food & farming
Whether the place can feed itself
05
Organic & clean
Certified land and pesticide reality
06
Climate & energy
Emissions per person, how the grid is powered
07
Waste
Where the rubbish goes, what comes back
08
Health
What people eat and die of
09
Heritage
Living culture, and what the law keeps standing
10
Ownership
Who owns the economy, how much of a dollar stays
11
Governance
Freedom, honesty, promises kept
12
Future
Measured trends run forward, pledges against pace
What each 0 to 5 pillar score means, in plain words
The institutions above are the ones cited on this page, ranked by how many of its figures they carry. This same sectioned page renders for all 77 scored destinations, each with its own researched history, comparison charts and three-way future. Read the full methodology
Every figure on this page, and where it came from: 86 sources across 38 institutions
World Bank17 FIGURES
Forest area (% of land area) AG.LND.FRST.ZS, 2023 check
Marine protected areas (% of territorial waters) ER.MRN.PTMR.ZS (45.4%), 2024 check
PM2.5 mean annual exposure EN.ATM.PM25.MC.M3 (6.4 ug/m3), 2023 check
Threatened species (mammals EN.MAM.THRD.NO, birds EN.BIR.THRD.NO, fish EN.FSH.THRD.NO, higher plants EN.HPT.THRD.NO), 2022 check
Terrestrial protected areas (% of land) ER.LND.PTLD.ZS, 2025 check
Renewable electricity output (% of total) EG.ELC.RNEW.ZS, 2021 check
CO2 emissions per capita EN.GHG.CO2.PC.CE.AR5, 2024 check
Australia, IUCN category Critically Endangered, class Aves, Critically Endangered on the IUCN Red List, and recorded in Australia in GBIF occurrence data (bird). check
Australia, IUCN category Critically Endangered, class Aves corroboration check
Australia, IUCN category Critically Endangered, class Testudines, Critically Endangered on the IUCN Red List, and recorded in Australia in GBIF occurrence data (turtle). check
Australia, IUCN category Critically Endangered, class Elasmobranchii, Critically Endangered on the IUCN Red List, and recorded in Australia in GBIF occurrence data (shark or ray). check
Australia, IUCN category Critically Endangered, class Squamata, Critically Endangered on the IUCN Red List, and recorded in Australia in GBIF occurrence data (reptile). check
Australia, IUCN category Critically Endangered, class Amphibia, Critically Endangered on the IUCN Red List, and recorded in Australia in GBIF occurrence data (amphibian). check
Australia, IUCN category Critically Endangered, kingdom Plantae, Critically Endangered on the IUCN Red List, and recorded in Australia in GBIF occurrence data (plant). check
NSW Environment Protection Authority7 FIGURES
About the plastics bans, Every state and territory has banned lightweight single-use plastic bags, and most have progressively banned s check
FAOSTAT Crops and livestock products trade, bulk dataset, 2024 data, It is one of the world's largest beef, wheat, wool and canola exporters. check
FAOSTAT Crops and livestock products trade, bulk dataset, 2024 data corroboration check
FAOSTAT Crops and livestock products trade, bulk dataset, 2024 data corroboration check
FAOSTAT Production of crops and livestock products, Oceania bulk dataset, 2024 data corroboration check
Study Australia4 FIGURES
Australian Government (Austrade), Australian Aboriginal and Torres Strait Islander Peoples, Aboriginal and Torres Strait Islander peoples hold the world's oldest continuous living cultures, stretching b check
Australian Government (Austrade), Australian Aboriginal and Torres Strait Islander Peoples corroboration check
Australian Government (Austrade), Australian Aboriginal and Torres Strait Islander Peoples corroboration check
Australian Government (Austrade), Australian Aboriginal and Torres Strait Islander Peoples corroboration check
BirdLife International, IUCN and UNEP-WCMC3 FIGURES
UN SDG Global Database, terrestrial Key Biodiversity Areas covered by protected areas (%) ER_PTD_TERR, Australia, 2025 (57.7%), country-reported check
UN SDG Global Database, marine Key Biodiversity Areas covered by protected areas (%) ER_MRN_MPA, Australia, 2025 (66.2%), country-reported check
UN SDG Global Database, freshwater Key Biodiversity Areas covered by protected areas (%) ER_PTD_FRHWTR, Australia, 2025 (37.8%), country-reported check
FAO, Global Forest Resources Assessment3 FIGURES
UN SDG Global Database, forest area (% of land area) AG_LND_FRST, Australia, 2025 (17.4%), country-reported check
UN SDG Global Database, forest area under a long-term management plan (%) AG_LND_FRSTMGT, Australia, 2025 (28.1%), country-reported check
UN SDG Global Database, forest area inside legally established protected areas (%) AG_LND_FRSTPRCT, Australia, 2025 (18.1%), country-reported check
UNESCO Institute for Statistics data, distributed3 FIGURES
the World Bank open data API, Public spending on education runs at 5.1% of GDP and 12.6% of all government spending, and secondary enrolment check
Learn About Wool, The Wool Market fact sheet corroboration check
Learn About Wool, The Wool Market fact sheet corroboration check
FiBL and IFOAM Organics International2 FIGURES
The World of Organic Agriculture yearbook news release, 2023 reference year, Australia holds the largest area of certified organic agricultural land of any country on Earth, about 53 mill check
The World of Organic Agriculture yearbook news release, 2023 reference year corroboration check
IUCN Species Survival Commission2 FIGURES
IUCN Red List Categories and Criteria version 3.1, second edition, 2012 corroboration check
IUCN Red List Categories and Criteria version 3.1, second edition, 2012 corroboration check
The World of Organic Agriculture (organic ~9.9% of farmland; 53M ha, world's largest), 2020-2024 check
Gunditj Mirring Traditional Owners Aboriginal Corporation1 FIGURE
Budj Bim Cultural Landscape, World Heritage, Gunditjmara communities in Victoria build channels, weirs and holding ponds in volcanic rock, among the oldest check
IEA, World Energy Balances1 FIGURE
UN SDG Global Database, renewable share of total final energy consumption (%) EG_FEC_RNEW, Australia, 2023 (14.4%), modelled estimate check

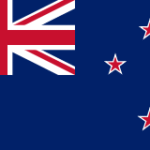 New ZealandScored on the same twelve pillars as Australia.80
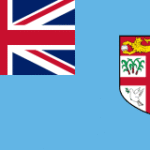 FijiScored on the same twelve pillars as Australia.70
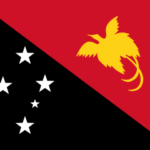 Papua New GuineaScored on the same twelve pillars as Australia.68
 French PolynesiaScored on the same twelve pillars as Australia.63