Destinations › Oceania · The Destination Index · universal template · every figure sourced
Fiji.
Oceania, island group in the South Pacific Ocean, about two-thirds of the way from Hawaii to New Zealand. 18,274 sq km and 933,154 people, 1,129 km of coastline, tropical marine; only slight seasonal temperature variation.
Region · OceaniaPopulation · ~933,154Languages · iTaukei (Fijian), Fiji Hindi, English. All three officialEco Index · 70/100 · Passable
The Eco Index across 12 pillars · scored 0 to 5 · World Bank, OWID, WHO/UNICEF JMP, FiBL, Protected Planet, IUCN, UNESCO (2023-24)
Conservation
Wildlife
Water
Food & farming
Organic & clean
Climate & energy
Waste
Health
Heritage
Ownership
Governance
Future
The History of Fiji.
Fiji sustains vigorous living iTaukei heritage alongside Indo-Fijian traditions. The meke, a combined dance and chant accompanied by the lali drum, remains central to community life, and the yaqona or kava ceremony is a daily living ancestral practice.
Where the name comes from
The Fijian name is Viti. 'Fiji' is the Tongan pronunciation, Fisi, which Europeans took up and spelled their own way. Source: national and regional toponymic records.
The land itself: mountainous islands of volcanic origin, ringed by reef. Its high point is Tomanivi, 1,324 m. Source: national mapping and survey records.
Where it starts
Three thousand years of ocean
The Lapita settlement at Bourewa on the south west coast of Viti Levu was founded around 1100 BC and lived in for roughly five hundred years, the earliest known in Fiji. Its people built stilt houses between a reef and a lagoon, and produced shell jewellery in quantity, slicing large cone shells and grinding them into bracelets and rings. Their dentate stamped pottery links Fiji to a voyaging tradition that runs back from here into the Bismarck archipelago.
How it got here
Drua, cession, indenture
Confederacies formed across the islands, with double-hulled drua capable of long ocean voyages and trade with Tonga and Samoa. Dutch and then British ships recorded the islands in 1643 and 1774. Fiji was ceded to Britain in 1874. Between 1879 and 1916 around 60,000 indentured labourers were brought from India, reshaping the population. Fiji became independent in 1970, and a new constitution in 2013 established a common national identity for all citizens.
The timeline
c. 1100 BC
Bourewa.
A Lapita settlement on the south west coast of Viti Levu, the earliest known in Fiji, lived in for around five hundred years. ↗
c. 1100 to 550 BC
Shell workshops.
The same site produced large quantities of shell jewellery, cone shells sliced, ground and polished into bracelets and rings. ↗
c. 1000 BC onward
Dentate stamped pottery.
Lapita pottery decorated with fine dot patterns links Fiji to a voyaging tradition running from the Bismarck archipelago into the Pacific. ↗
c. AD 1000 to 1800
Chiefdoms.
Confederacies form across the islands, with double-hulled drua capable of long ocean voyages and trade with Tonga and Samoa. ↗
1643 and 1774
European sighting.
Dutch ships under Tasman record the islands in 1643 and Cook passes in 1774, but neither stays. ↗
1874
Cession.
On 10 October 1874 Cakobau and other paramount chiefs sign the Deed of Cession, transferring sovereignty over the islands to the British Crown. ↗
1879 to 1916
Indenture.
Around 60,000 indentured labourers are brought from India, reshaping the population. ↗
1970
Independence, to the day.
Fiji becomes independent on 10 October 1970, ninety-six years to the day after the Deed of Cession, under the Fiji Independence Act passed at Westminster that July. ↗
2013
Constitution.
A new constitution establishes a common national identity for all citizens. ↗
Formal protection is low, with terrestrial protected areas covering about 3.9% of land and marine protected areas about 0.9% of territorial waters (World Bank). The stronger conservation story is customary, as most inshore fishing grounds are managed as qoliqoli by the clans that hold them. The Great Sea Reef was designated the Ramsar wetland Qoliqoli Cokovata on 16 January 2018, with the first community marine protected area declared in 2002 and nine more added in 2004.
Is wild Fiji protected? 3.9% of the land is, against a 30% target for 2030
Found only here. Fiji crested iguana, orange dove and collared lory, all found only in Fiji.
The watchlist
ThreatenedFiji Petrel (Pseudobulweria macgillivrayi)Critically Endangered on the IUCN Red List, and recorded in Fiji in GBIF occurrence data (bird).
ThreatenedHawksbill (Eretmochelys imbricata)Critically Endangered on the IUCN Red List, and recorded in Fiji in GBIF occurrence data (turtle).
ThreatenedHammerhead Shark (Sphyrna lewini)Critically Endangered on the IUCN Red List, and recorded in Fiji in GBIF occurrence data (shark or ray).
ThreatenedFiji Crested Iguana (Brachylophus vitiensis)Critically Endangered on the IUCN Red List, and recorded in Fiji in GBIF occurrence data (reptile).
ThreatenedElaeocarpus kambiCritically Endangered on the IUCN Red List, and recorded in Fiji in GBIF occurrence data (plant).
ThreatenedGiant clam (Tridacna gigas)Critically Endangered on the IUCN Red List, and recorded in Fiji in GBIF occurrence data (species).
ThreatenedSymmetromphalus hageniCritically Endangered on the IUCN Red List, and recorded in Fiji in GBIF occurrence data (species).
Critically Endangered, the last IUCN category before Extinct in the Wild, and still recorded in Fiji. GBIF holds 2 verified occurrence records.
Hawksbill (Eretmochelys imbricata)
Critically Endangered, the last IUCN category before Extinct in the Wild, and still recorded in Fiji. GBIF holds 57 verified occurrence records.
Hammerhead Shark (Sphyrna lewini)
Critically Endangered, the last IUCN category before Extinct in the Wild, and still recorded in Fiji. GBIF holds 436 verified occurrence records.
Fiji Crested Iguana (Brachylophus vitiensis)
Critically Endangered, the last IUCN category before Extinct in the Wild, and still recorded in Fiji. GBIF holds 20 verified occurrence records.
Species named here are drawn from GBIF occurrence records for Fiji filtered to the IUCN Red List threatened categories. Species are listed where GBIF holds occurrence records for them in this country. Record counts are not published here because the figure cannot be reproduced from a public GBIF query.
Nature reserve in Western, mapped and named in the open record for Fiji. OpenStreetMap.
Water and Ocean in Fiji.
Fiji's volcanic high islands, Viti Levu and Vanua Levu, carry rivers fed by heavy rainfall, so raw freshwater is abundant on the main islands. About 95.5% of the population has at least basic drinking water, but only 41.9% has a safely managed, contamination-free supply (World Bank/JMP, 2022). Smaller islands and outer atolls depend on rainwater catchment that runs short in the dry season.
Does Fiji have enough fresh water? Yes, with headroom
42.1% of people here have safely managed drinking water at home (2024, WHO/UNICEF JMP). Coverage is well short of universal, so a visitor should not assume the tap is safe.
Cleanest water: Highland rivers of the Viti Levu interior; the Yaqara Valley artesian aquifer supplies bottled Fiji Water.
How much fresh water does Fiji have, per person?
31,052 m³
Fiji
1,000 m³
the UN “water scarce” line
Fiji withdraws about 85 million cubic metres of fresh water a year (2022). That is 0.3% of the fresh water actually available to it, which FAO counts as no water stress. Of what is taken, farming takes 59%, homes and towns 30%, industry 11%. Source: FAO AQUASTAT.
What are the rules on Fiji beaches?
·Tap water: Varies.
✓Plastic rules: Single-use plastic bags banned since 2020, with a levy from 2017..
✓Solo travel: rated easy on the record for this destination.
✕Marine protection: 0.9% of the sea is protected. The 30x30 pledge for 2030 is not met yet.
Where does the sewage go?
48.5%
of people have safely managed sanitation
48.5% of people here use a safely managed sanitation service, meaning waste is contained, emptied and treated rather than reaching the ground or the sea untreated (2024, World Bank / WHO-UNICEF JMP, SDG 6.2.1). The rest is what the rivers and the coast receive.
How is the sea around Fiji doing?
One cross-section, every answer measured.
Surface
What the coast carries
Cyclone season Nov–Apr; the dry season May–Oct is the sweet spot.
Nearshore
Protected water
0.9% of territorial waters are protected, against the 30% pledged for 2030 under the Global Biodiversity Framework.
Cleanest
Where the water is cleanest
Highland rivers of the Viti Levu interior; the Yaqara Valley artesian aquifer supplies bottled Fiji Water..
The record
Measured
Fiji's volcanic high islands, Viti Levu and Vanua Levu, carry rivers fed by heavy rainfall, so raw freshwater is abundant on the main islands. About 95.5% of the population has at least basic drinking water, but only 41.9% has a safely managed, contamination-free supply (World Bank/JMP, 2022).
Sea protected
0.9%
Against the 30% pledged for 2030 under the Global Biodiversity Framework.
Threatened species
119
Mammals, birds, fish and higher plants on the IUCN list.
Cleanest water
here
Highland rivers of the Viti Levu interior; the Yaqara Valley artesian aquifer supplies bottled Fiji Water..
Is the tap water safe in Fiji?
42.1% of people have safely managed drinking water at home (2024, WHO/UNICEF JMP). Renewable fresh water works out at about 31,052 cubic metres per person a year (World Bank).
How hard is the water supply being pushed?
Of every 10 buckets nature refills, 0 are already taken. Withdrawals run at 0.3% of what Fiji renews internally each year (2022, World Bank / FAO AQUASTAT). That is inside the 25% mark generally treated as water stress, so the supply has headroom.
When is the best time to visit Fiji? Tap your month.
Tap your month.
JanFebMarAprMayJunJulAugSepOctNovDec
.
How much fresh water does Fiji actually have?
Nature renews about 31,052 cubic metres of fresh water per person per year here. That ranks Fiji 191 of 208 countries measured, placing it among the 20 best-watered countries measured. The UN treats anything under 1,000 cubic metres as water scarce, and this is above that line. World Bank / FAO AQUASTAT.
Food made up about 19.5% of Fiji's merchandise imports in 2022 (World Bank), a moderate level for a Pacific state that still ships in rice and flour. Against this, subsistence and smallholder farming of root crops, along with sugar cane and reef fishing, remain widespread. Domestic production covers much of the fresh diet even where staple grains are imported.
Where does the food in Fiji come from?
19.0% imported
about US$616m a year
On the plate: Dalo (taro), cassava, breadfruit, yams, kumala, plus Indo-Fijian dhal, roti and curries.
How often each food is on the plate
Share of people eating each one regularly. These overlap, so they do not add up to 100%.
Cassava51%
Breadfruit42%
Yams33%
Kumala24%
Coconut15%
2 of 10
bites are imported
The island buys in more food energy than it eats. About US$616m a year leaves the country to pay for it. The green slice is roughly what still grows here.
About 19% of everything Fiji buys in from abroad is food, roughly 2 in every 10 imported items on the dock (2024, World Bank). Farming itself is 14% of the economy and 17.1% of the land is agricultural, of which 4.2% is arable. The green slice is roughly what still grows here.
What is killing people in Fiji? The imported diet.
Cause of death, and the diet behind it.
Non-communicable diseases, all combined67.3%
Diabetes16.6%
Adults living with overweight or obesity. 65.8%.
Can Fiji feed itself?
4.2%
Arable land
17.1%
Agricultural land
139,096
Farmers
189,777
Arable acres
14.1%
Agriculture, share of GDP
Harvest: Root crops and tropical fruit year round; the sugar cane crushing season runs roughly June to December.
Feeding itself
Food made up about 19.5% of Fiji's merchandise imports in 2022 (World Bank), a moderate level for a Pacific state that still ships in rice and flour. Against this, subsistence and smallholder farming of root crops, along with sugar cane and reef fishing, remain widespread.
Certification
Certified organic land covered about 4.5% of Fiji's agricultural area, some 19,303 hectares, in 2020 (FiBL). That share is high for the region and reflects organic coconut and other export certification.
Water for crops
Fiji's volcanic high islands, Viti Levu and Vanua Levu, carry rivers fed by heavy rainfall, so raw freshwater is abundant on the main islands. About 95.5% of the population has at least basic drinking water, but only 41.9% has a safely managed, contamination-free supply (World Bank/JMP, 2022).
Why the organic number looks like that. Certified-organic farmland is not separately reported for Fiji, and that is a certification gap rather than proof nothing is grown cleanly. What the official land record does show: 17.1% of the country is agricultural land and 4.2% is arable (2023, World Bank). Certification is paid for per farm per year by a foreign body, which prices out smallholders, so the organic number reads worse than the practice.
The plant-based kitchen here is not an import. By tonnage, the largest crops grown in Fiji are sugarcane, cassava and taro (FAO, FAOSTAT crop production, 2024). That is what the land itself puts on a plate.
Buy direct where residents buy: Dreketi Market, Holy Family Flea Market, Labasa Market, Lautoka Market, Levuka Market, Nabouwalu Market. Each is a mapped, named marketplace, so the money stays with the seller rather than the importer. OpenStreetMap.
Fiji's fossil CO2 emissions are very low at about 1.6 tonnes per person in 2024, and it is a widely recognised climate leader that was the first nation to ratify the Paris Agreement and presided over the COP23 summit. Roughly half of its electricity comes from renewables, chiefly hydropower at the Monasavu scheme, with the remainder still supplied by imported diesel. Fiji targets 100 per cent renewable electricity by 2030 and has legislated a net-zero pathway. Its very low emissions and strong policy are tempered by continuing diesel reliance, which holds it at 4.
What powers Fiji?
Renewable 63.5%Fossil 36.5%
Climate pollution per person
The safe amount, what the planet can absorb
2 tonnes
One person here
1.62 tonnes
The world average, for comparison
4.7 tonnes
The worst it ever got
2.26 tonnes
The grid
Fiji's fossil CO2 emissions are very low at about 1.6 tonnes per person in 2024, and it is a widely recognised climate leader that was the first nation to ratify the Paris Agreement and presided over the COP23 summit. Roughly half of its electricity comes from renewables, chiefly hydropower at the Monasavu scheme, with the remainder still supplied by imported diesel.
Pollution
Fiji banned single-use plastic bags in 2020, having introduced a levy in 2017. Air is very clean, with mean PM2.5 of about 6.1 micrograms per cubic metre in 2020 (World Bank), far below most of the world.
Water stress
Fiji's volcanic high islands, Viti Levu and Vanua Levu, carry rivers fed by heavy rainfall, so raw freshwater is abundant on the main islands. About 95.5% of the population has at least basic drinking water, but only 41.9% has a safely managed, contamination-free supply (World Bank/JMP, 2022).
What pollutes most here
1The gridThe share of electricity still generated from fossil fuel.39.9%
2IndustryReef-damaging activities and coral, shell or turtle-product souvenirs, plus poorly run shark-feeding dives..named
3AirModelled annual mean against a WHO guideline of 5 µg/m³.6.1
4On the recordFiji banned single-use plastic bags in 2020, having introduced a levy in 2017.
What has Fiji promised on climate?
Net zero, whole economy2050
Electricity renewable today60.1% (2021)
Land protected, against a 30% target3.9% by 2025
Sea protected, against a 30% target0.9% by 2025
The net-zero target year on file with Climate Watch is 2050, status: in law; in policy document. Measured against it, 60.1% of electricity is already renewable (2021, World Bank), so 39.9% of the grid is still to be converted. The pledge on file is measured here against what has actually been delivered, not taken on its own (UNFCCC NDC Registry, CBD Kunming-Montreal Target 3).
The biggest line item
One return flight against a whole year of living.
A resident's entire year1.62 t CO2e
Safe-climate budget, per year2 t CO2e
Paris return, economy2.98 t CO2e
Frankfurt return, economy2.95 t CO2e
London return, economy2.94 t CO2e
Johannesburg return, economy2.55 t CO2e
Dubai return, economy2.54 t CO2e
How much CO2 does flying to Fiji emit?
Tap where you would fly from. One return flight, economy.
Every prompt runs on a machine in a building on somebody’s grid. What that costs the planet depends less on the prompt than on what is burning to power it. Here is what would power one in Fiji.
Data centres
0
Registered colocation and interconnection facilities, PeeringDB, 2026
Grid renewable
63.5 %
What a machine here runs on.
What powers a data centre in Fiji?
A machine here runs mostly on renewables, but not entirely.
Renewable 63.5%Fossil 36.5%
Cooling water. Every one of those halls runs on the national grid, which is 60.1% renewable today (World Bank). A data centre is only as clean as the electricity behind it, so the same figure that decides this country's climate score also decides the footprint of the AI running inside it. Cooling water use is not separately published by facility, and no operator here reports it.
The rules. Fiji has 0 colocation and interconnection facilities on the public PeeringDB register, alongside 1 internet exchange (Fiji-IXP).
Where the cables land. 3 landing points · Natadola, Savusavu, Suva
49% residents to 51% visitors across a year. 969,000 international arrivals in 2019 against 933,154 people who live here (2025, World Bank / UN Tourism).
Where a visitor dollar goes in Fiji
168k
Visitors a year
0.2
Visitors per resident
How deep in debt is Fiji?· for every $100 Fiji earns in a year, it owes…
Pay to the order of: the creditorsmemo · the 2022 peak
$ 92The worst year on the IMF record. Fiji owed $92 for every $100 it earned.
IMF World Economic Outlook, 2022signed, the creditors
Pay to the order of: the creditorsmemo · today
$ 82What is owed now, for every $100 of national income (2026).
IMF World Economic Outlook, 2026signed, the creditors
Pay to the order of: the creditorsmemo · projected 2031
$ 76The IMF's own forecast has this falling to $76 by 2031.
IMF World Economic Outlook projection, 2031signed, the forecast
For every $100 Fiji earns in a year, it owes $82 (2026, IMF World Economic Outlook). The interest on that is paid before schools, clinics or coastline get their turn.
Where does a tourist dollar actually go in Fiji?
Play one tourist dollar around the board. Every square is a measured fact from this page.
START!
1
GO: a visitor lands
$100 goes on the table. 969,000 international arrivals in 2019 against 933,154 residents, 1.0 visitors for every resident (World Bank / UN Tourism).
$100 in play
2
The bed
Who owns the largest places to stay in Fiji is not published in the records we can check, so this square is left open rather than guessed. Where a listing names its owner, it is shown in the ownership table below.
not published
3
The plate
Food is 19% of everything Fiji imports (2024, World Bank), so a large part of every restaurant bill is paid to a supplier abroad. Eating what the land here actually grows, sugarcane, cassava, taro, vegetables, coconuts, ginger, sweet potatoes, keeps that money with the grower.
sails in
4
The power
60.1% of the electricity is renewable (2021, World Bank), so the energy on the bill is mostly generated inside the country rather than shipped in.
made at home
5
What actually stays
On the parts that can be measured, the plate leaves and the power stays. It is genuinely a coin toss, decided by what you book.
split
6
Pay the bank first
Fiji owes $82 for every $100 it earns (IMF World Economic Outlook, 2026 projection). The interest is paid before anything else on this board.
$82 per $100
7
No plan B
26.5% of everything Fiji sells abroad is mineral fuels and oils (2023, UN Comtrade). One market moving takes the whole board with it.
26.5% one export
8
Community chest
Tourism earns 17.8% of everything Fiji makes from exports (2020, World Bank / UN Tourism). That is how much of the economy depends on the game continuing.
17.8% of exports
9
The flight
Getting here is usually the biggest single line on the bill. From Paris a return economy seat is 2.98 t CO2, on the UK Government's published conversion factors. It is the one part of the trip this board cannot reduce.
2.98 t CO2
10
Back to GO
The economy turns over about US$6 billion a year (IMF World Economic Outlook, 2026 projection). Every lap of this board is a choice about how much of it stays.
US$6bn
GDPUS$6.2bn
Agriculture, share of GDP14.1%
Visitors a year168,000
Visitors per resident0.2
Residents~933,154
Agriculture
Farming is 14.1% of the economy. Food made up about 19.5% of Fiji's merchandise imports in 2022 (World Bank), a moderate level for a Pacific state that still ships in rice and flour.
Natural materials
Masi, Fijian barkcloth beaten from paper-mulberry bark, is still made and remains central to ceremony and gift-giving. Women weave mats from pandanus and voivoi, including the prized kuta mats of Bua on Vanua Levu, and make rope from coconut fibre.
Energy
Fiji's fossil CO2 emissions are very low at about 1.6 tonnes per person in 2024, and it is a widely recognised climate leader that was the first nation to ratify the Paris Agreement and presided over the COP23 summit. Roughly half of its electricity comes from renewables, chiefly hydropower at the Monasavu scheme, with the remainder still supplied by imported diesel.
Who owns the biggest hotels in Fiji?
By rooms · company records and press.
Matangi Private Island · ~12 roomsIndependentnot published
Jean-Michel Cousteau · ~25 roomsIndependentnot published
Turtle Island · ~14 roomsIndependentnot published
Visitors, over time
2015869k
2016963k
20171,027k
20181,058k
2019969k
2020168k
International tourism receipts run at about US$0.24 billion in 2020 (World Bank / UN Tourism). That is 17.8% of everything the country earns from exports.
How much of your money actually stays here?
Tap the holiday you are planning.
All-inclusive resortForeign-owned hotel and tourist restaurantsLocally owned stay and local restaurantsGuesthouse, markets and public transport
Resort guest, villa renter, family, nomad or backpacker. The honest playbook for each, from the same sourced numbers.
Already booked a resort? · the rescue list
Five swaps that move your money back on-island
1. Eat where the country eats Choose kitchens cooking what the land here grows, sugarcane, cassava, taro, vegetables, coconuts, ginger and sweet potatoes, over an imported menu. The checked list →
2. Book with a local operator Never the lobby desk. The margin on a tour is the part that stays. Eco tours →
3. Stay somewhere locally owned Ownership decides where the room rate books. Eco stays →
4. Use the transport residents use Domestic flights and ferries link the islands, while buses, taxis and shared carriers serve Viti Levu's Coral Coast and towns.
5. Buy the craft, not the souvenir Natural-materials work made here pays the maker directly; imported gifts pay a shipping line.
swipe →
First time here
Fiji is a 300-island Pacific archipelago where volcanic high islands carry rivers and rainforest, most land is held communally by iTaukei clans, and inshore reefs are still managed through customary qoliqoli tenure.
Best time: Dry season, cooler and drier with lower cyclone risk.
Getting around
Domestic flights and ferries link the islands, while buses, taxis and shared carriers serve Viti Levu's Coral Coast and towns.
Transport is where the fare either stays or leaves.
Eating here
The everyday plate that actually grows here is sugarcane, cassava, taro, vegetables, coconuts, ginger and sweet potatoes. Ordering those keeps the money with the grower and cuts the imported share of the meal.
Eating what the country grows is the cheapest way to cut the import bill.
Good to know
Cards in resorts, cash in villages; FJD. Kava ceremony etiquette matters.
Rate my hotel. Tap yours for the honest verdict.
Ownership from company records and press.
Matangi Private IslandJean-Michel CousteauTurtle Island
.
Who owns the big hotels
Matangi Private IslandIndependent · 12 rooms
Jean-Michel CousteauIndependent · 25 rooms
Turtle IslandIndependent · 14 rooms
None of the 3 properties listed here publishes who ultimately owns it, so no claim is made either way. Ownership is what decides how much of a room rate stays in the country, which is why we show it when a listing states it.
Society and Governance in Fiji.
How well is Fiji actually run?
Governance, measured · World Bank WGI
Four measured answers, none of them opinion. Averaged across corruption control, delivery and accountability, Fiji scores 62 out of 100 (2024, World Bank Worldwide Governance Indicators). That is a state that generally does what it says it will do, which is what makes a climate pledge worth reading.
How well is Fiji run? · each scored out of 100, higher is better
Clean government, scored 59 of 100
Control of corruption scores 59.2 out of 100 (2024, World Bank Worldwide Governance Indicators). That is above the halfway mark of governments measured.
59
Freedom and rights, scored 63 of 100
Voice and accountability, which measures free expression, free media and the ability to choose a government, scores 62.7 out of 100 (2024, World Bank WGI). Citizens have some room to question their government.
63
Government effectiveness, scored 63 of 100
Government effectiveness, which measures the quality of public services and how well policy is actually delivered, scores 63.2 out of 100 (2024, World Bank WGI). Delivery is rated above average.
63
Income equality, scored 31 of 100
The Gini index of income inequality reads 30.7 (2019, World Bank). Zero is perfect equality and 100 is one person holding everything. Below 40 is the level usually treated as manageable, and Fiji sits inside it.
31
LGBTQ+ status: MixedSolo female travel: EasyIndustry to avoid: Reef-damaging activities and coral, shell or turtle-product souvenirs, plus poorly run shark-feeding dives.
Getting around, breathing, throwing away, learning. The honest checklist.
TransportAirWaterWastePower
✓How you get around Domestic flights and ferries link the islands, while buses, taxis and shared carriers serve Viti Levu's Coral Coast and towns.
✓Air quality, measured Modelled annual mean 6.1. The WHO guideline is 5 µg/m³.
✓Where the air is cleanest The outer islands and highland interior; national mean PM2.5 is about 6.1 micrograms per cubic metre.
✓Tap water Varies
✓What to drink Tap water is safe in Suva and Nadi; outer islands and villages rely on rain tanks, drink bottled there.
✓Plastic rules Single-use plastic bags banned since 2020, with a levy from 2017.
✓Sockets and voltage Type I, 230V
Made in Fiji.
Masi, Fijian barkcloth beaten from paper-mulberry bark, is still made and remains central to ceremony and gift-giving. Women weave mats from pandanus and voivoi, including the prized kuta mats of Bua on Vanua Levu, and make rope from coconut fibre. Every step of processing done at home is value that stops leaving the country.
What Fiji actually sells the world
The single biggest thing Fiji sells the world is mineral fuels and oils, 26.5% of all exports in 2023 (about US$0.28 billion, UN Comtrade). The next four are beverages, spirits and vinegar at 15.7%, sugar and sugar confectionery at 6.7%, fish and seafood at 5.8%, pearls, gemstones and precious metals at 4.3%.
Sells now · 26.5% of exports
Mineral fuels and oils
Mineral fuels and oils is 26.5% of everything Fiji sold abroad in 2023, worth about US$0.28 billion. UN Comtrade.
Sells now · 15.7% of exports
Beverages, spirits and vinegar
Beverages, spirits and vinegar is 15.7% of everything Fiji sold abroad in 2023, worth about US$0.17 billion. UN Comtrade.
Sells now · 6.7% of exports
Sugar and sugar confectionery
Sugar and sugar confectionery is 6.7% of everything Fiji sold abroad in 2023, worth about US$0.07 billion. UN Comtrade.
Sells now · 5.8% of exports
Fish and seafood
Fish and seafood is 5.8% of everything Fiji sold abroad in 2023, worth about US$0.06 billion. UN Comtrade.
Sells now · 4.3% of exports
Pearls, gemstones and precious metals
Pearls, gemstones and precious metals is 4.3% of everything Fiji sold abroad in 2023, worth about US$0.05 billion. UN Comtrade.
Buys in · 9.4% of imports
Machinery and mechanical appliances
Fiji imported US$0.29 billion of machinery and mechanical appliances in 2023, 9.4% of everything it bought abroad, and sells none of it back. Every point of that is a business that could be built at home rather than shipped in. UN Comtrade.
Buys in · 6.9% of imports
Electrical machinery and electronics
Fiji imported US$0.21 billion of electrical machinery and electronics in 2023, 6.9% of everything it bought abroad, and sells none of it back. Every point of that is a business that could be built at home rather than shipped in. UN Comtrade.
Buys in · 6.4% of imports
Vehicles
Fiji imported US$0.20 billion of vehicles in 2023, 6.4% of everything it bought abroad, and sells none of it back. Every point of that is a business that could be built at home rather than shipped in. UN Comtrade.
Buys in · 3.9% of imports
Optical, medical and precision instruments
Fiji imported US$0.12 billion of optical, medical and precision instruments in 2023, 3.9% of everything it bought abroad, and sells none of it back. Every point of that is a business that could be built at home rather than shipped in. UN Comtrade.
The maths for an entrepreneur. Fiji produces about US$6 billion a year, which is roughly US$6,642 per person (2025, World Bank). Farming is 14% of that, while food is 19% of everything the country imports. The country buys in more food than its own farms contribute to the economy, and every point of that gap is a business someone could build here rather than ship in.
A living tradition of Fiji, still practised rather than archived.
Chant
A living tradition of Fiji, still practised rather than archived.
Lali drum music
A living tradition of Fiji, still practised rather than archived.
Yaqona (kava) ceremony
A living tradition of Fiji, still practised rather than archived.
Vilavilairevo firewalking of BeqaA living tradition of Fiji, still practised rather than archived.
Masi barkcloth makingA living tradition of Fiji, still practised rather than archived.
Does Fiji protect its heritage by law?
Partly, and the gaps say as much as the protections.
What is kept alive. Fiji sustains vigorous living iTaukei heritage alongside Indo-Fijian traditions. The meke, a combined dance and chant accompanied by the lali drum, remains central to community life, and the yaqona or kava ceremony is a daily living ancestral practice. The vilavilairevo firewalking of Beqa Island continues as an ancestral ritual, and masi barkcloth making endures as a living craft.
Who it belongs to. About 86% of Fiji's land is held communally by iTaukei clans and cannot be sold, which keeps village life and customary authority intact. Visitors to a village present kava in the sevusevu ceremony, and the meke dance still carries oral history. Community-run and village-stay tourism means culture here is lived rather than staged.
Only here. The Great Sea Reef (Cakaulevu), the world's third-longest continuous barrier reef, protected as the Ramsar site Qoliqoli Cokovata..
Three futures for Fiji, every one run forward from measured data.
Where the making actually happens
Named cultural and craft sites on the open map: Fiji Museum (Suva), Library/Museum (Levuka). OpenStreetMap.
Every measured trend on one line
Run forward at the pace already recorded.
+19%
Forest cover
1995: 53.3 % → 2023: 63.5 %
-21%
Renewable electricity
2000: 76.1 % → 2021: 60.1 %
+16%
CO2 per person
1995: 1.39 t → 2024: 1.62 t
-65%
Tourist arrivals
1995: 476 k → 2020: 168 k
-11%
Protected land
2013: 4.4 % → 2025: 3.9 %
+4%
Farm workforce
1995: 34.4 % → 2025: 35.6 %
+0%
Protected sea
2013: 0.9 % → 2025: 0.9 %
-22%
Agricultural land
1995: 21.9 % → 2023: 17.1 %
+30%
Urban population
1995: 45.7 % → 2025: 59.5 %
+21%
Air pollution
1995: 5.32 µg/m³ → 2023: 6.45 µg/m³
-13%
Fresh water per person
1995: 35743.5 m³ → 2022: 31052.1 m³
+28%
Adult overweight
1995: 51.4 % → 2022: 65.8 %
+43%
Electricity access
1996: 66.9 % → 2024: 95.9 %
+169%
GDP per person
1995: 2467 → 2025: 6642
+17%
Population
1995: 799 k → 2025: 933 k
-51%
Renewable energy use
1995: 58.4 % → 2022: 28.4 %
+0%
Protected area, total
2013: 1 % → 2025: 1 %
+2%
Life expectancy
1995: 66 yrs → 2024: 67.5 yrs
+55%
Cereal yield
1995: 2651 ha → 2023: 4109 ha
-18%
Fertiliser use
1995: 126.1 ha → 2023: 103.1 ha
-26%
Rural population
1995: 54.3 % → 2025: 40.5 %
+18%
Water productivity
1995: 48.5 $/m3 → 2022: 57.3 $/m3
+6%
Health spending
2000: 3.42 % → 2023: 3.62 %
+19%
Forest area
1995: 9731 km2 → 2023: 11601 km2
-40%
Emissions: Agriculture
1990: 0.95 e → 2023: 0.57 e
+43%
Emissions: Building
1990: 0.07 e → 2023: 0.1 e
+383%
Emissions: Electricity/Heat
1990: 0.06 e → 2023: 0.29 e
+146%
Emissions: Energy
1990: 0.68 e → 2023: 1.67 e
+375%
Emissions: Industrial Processes
1990: 0.04 e → 2023: 0.19 e
+200%
Emissions: Manufacturing/Construction
1990: 0.09 e → 2023: 0.27 e
+144%
Emissions: Transportation
1990: 0.41 e → 2023: 1 e
World Bank open data, recorded series
How much forest is left?
Forest cover moved from 53.3% to 63.5% across 28 recorded years.
World Bank AG.LND.FRST.ZS
How clean is the grid?
Renewable electricity moved from 76.1% to 60.1% across 21 recorded years.
World Bank EG.ELC.RNEW.ZS
How much climate pollution per person?
CO2 per person moved from 1.4 t to 1.6 t across 29 recorded years.
World Bank EN.GHG.CO2.PC.CE.AR5
How many people visit?
Tourist arrivals moved from 476k to 168k across 25 recorded years.
World Bank ST.INT.ARVL
How much land is protected?
Protected land moved from 4.4% to 3.9% across 12 recorded years.
World Bank ER.LND.PTLD.ZS
How many people still farm?
Farm workforce moved from 34.4% to 35.6% across 30 recorded years.
World Bank SL.AGR.EMPL.ZS
How much sea is protected?
Protected sea moved from 0.9% to 0.9% across 12 recorded years.
World Bank ER.MRN.PTMR.ZS
How much land is farmed?
Agricultural land moved from 21.9% to 17.1% across 28 recorded years.
World Bank AG.LND.AGRI.ZS
How fast is it urbanising?
Urban population moved from 45.7% to 59.5% across 30 recorded years.
World Bank SP.URB.TOTL.IN.ZS
Is the air getting cleaner?
Air pollution moved from 5.3 µg/m³ to 6.4 µg/m³ across 28 recorded years.
World Bank EN.ATM.PM25.MC.M3
Is water getting scarcer?
Fresh water per person moved from 35743.5 m³ to 31052.1 m³ across 27 recorded years.
World Bank ER.H2O.INTR.PC
Is diet-related disease rising?
Adult overweight moved from 51.4% to 65.8% across 27 recorded years.
World Bank SH.STA.OWAD.ZS
Who has power?
Electricity access moved from 66.9% to 95.9% across 28 recorded years.
World Bank EG.ELC.ACCS.ZS
Is income rising?
GDP per person moved from 2467 to 6642 across 30 recorded years.
World Bank NY.GDP.PCAP.CD
How fast is it growing?
Population moved from 799k to 933k across 30 recorded years.
World Bank SP.POP.TOTL
What share of all energy is renewable?
Renewable energy use moved from 58.4% to 28.4% across 27 recorded years.
World Bank EG.FEC.RNEW.ZS
How much land and sea is protected together?
Protected area, total moved from 1% to 1% across 12 recorded years.
World Bank ER.PTD.TOTL.ZS
How long do people live?
Life expectancy moved from 66.01 yrs to 67.46 yrs across 29 recorded years.
World Bank SP.DYN.LE00.IN
How much does a hectare of cereal produce?
Cereal yield moved from 2651 kg/ha to 4109 kg/ha across 28 recorded years.
World Bank AG.YLD.CREL.KG
How much fertiliser goes on the land?
Fertiliser use moved from 126.05 kg/ha to 103.14 kg/ha across 28 recorded years.
World Bank AG.CON.FERT.ZS
How many people still live rurally?
Rural population moved from 54.34% to 40.46% across 30 recorded years.
World Bank SP.RUR.TOTL.ZS
How much value per cubic metre of water?
Water productivity moved from 48.52 $/m3 to 57.3 $/m3 across 27 recorded years.
World Bank ER.GDP.FWTL.M3.KD
How much goes on health?
Health spending moved from 3.42% to 3.62% across 23 recorded years.
World Bank SH.XPD.CHEX.GD.ZS
How much forest is there in total?
Forest area moved from 9731 km2 to 11601 km2 across 28 recorded years.
World Bank AG.LND.FRST.K2
How have agriculture emissions moved?
Agriculture emissions moved from 0.95 to 0.57 MtCO2e across 33 recorded years.
Climate Watch (WRI), historical emissions
How have building emissions moved?
Building emissions moved from 0.07 to 0.1 MtCO2e across 33 recorded years.
Climate Watch (WRI), historical emissions
How have electricity/heat emissions moved?
Electricity/Heat emissions moved from 0.06 to 0.29 MtCO2e across 33 recorded years.
Climate Watch (WRI), historical emissions
How have energy emissions moved?
Energy emissions moved from 0.68 to 1.67 MtCO2e across 33 recorded years.
Climate Watch (WRI), historical emissions
How have industrial processes emissions moved?
Industrial Processes emissions moved from 0.04 to 0.19 MtCO2e across 33 recorded years.
Climate Watch (WRI), historical emissions
How have manufacturing/construction emissions moved?
Manufacturing/Construction emissions moved from 0.09 to 0.27 MtCO2e across 33 recorded years.
Climate Watch (WRI), historical emissions
How have transportation emissions moved?
Transportation emissions moved from 0.41 to 1.0 MtCO2e across 33 recorded years.
Climate Watch (WRI), historical emissions
Worst caseCurrent pathBest case
Worst case
Every measured decline continues at the pace already recorded. The weakest pillar, conservation at 2/5, is the one that gives way first.
Computed from: recorded series extended with no policy change
Current path
Every line above is a recorded World Bank series for this country. The current path is simply those series continuing at the pace already measured.
Computed from: recorded series, no policy change assumed
Best case
The pledges are met on their own stated timetables and the weakest pillars are lifted to match the strongest. Fiji already shows it can do this: heritage scores 5/5.
Computed from: each published target delivered on its own date
What the best case actually asks for
Lift conservation
It scores 2 out of 5 today, among the weakest parts of Fiji's record. Formal protection is low, with terrestrial protected areas covering about 3.9% of land and marine protected areas about 0.9% of territorial waters (World Bank). The stronger conservation story is customary, as most inshore fishing grounds are managed as qoliqoli by the clans that hold them. The Great Sea Reef was designated the Ramsar wetland Qoliqoli Cokovata on 16 January 2018, with the first community marine protected area declared in 2002 and nine more added in 2004. Lifting it toward the 5/5 the strongest pillars already reach is what the best case turns on.
measured each year
Costs: spending and enforcement, not new technology
Lift recycling
It scores 2 out of 5 today, among the weakest parts of Fiji's record. Fiji has no published national municipal recycling rate. Recycling is limited and largely informal, with PET, aluminium and scrap metal collected for export while most household waste goes to landfill or open dumps around the urban centres. The 2020 plastic-bag ban tackles litter at source rather than through kerbside recycling. Lifting it toward the 5/5 the strongest pillars already reach is what the best case turns on.
measured each year
Costs: spending and enforcement, not new technology
Lift natural fibres
It scores 3 out of 5 today, among the weakest parts of Fiji's record. Masi, Fijian barkcloth beaten from paper-mulberry bark, is still made and remains central to ceremony and gift-giving. Women weave mats from pandanus and voivoi, including the prized kuta mats of Bua on Vanua Levu, and make rope from coconut fibre. This is a living materials tradition rather than a museum craft. Lifting it toward the 5/5 the strongest pillars already reach is what the best case turns on.
measured each year
Costs: spending and enforcement, not new technology
Government and Goals in Fiji.
Who is in charge of Fiji now · Office-holders from the UN Protocol and Liaison Service public list of Heads of State and Heads of Government, 8 September 2026. Legislature and election dates from IFES ElectionGuide. Constitution dates from the Constitute Project. Governance scores from the World Bank Worldwide Governance Indicators 2024.
Sitiveni Rabuka
Prime Minister
Sitiveni Rabuka is the head of government of Fiji, in office since 24 December 2022. Every climate, protection and energy pledge on this page is delivered, or not, under this administration.
Public opinion, measured
Voice and accountability, the freedom to question government: 62.7 / 100. Above the halfway mark of governments measured. World Bank WGI 2024
Control of corruption: 59.2 / 100. Above the halfway mark of governments measured. World Bank WGI 2024
Political stability and absence of violence: 77.8 / 100. Among the strongest measured. World Bank WGI 2024
Rule of law: 62.2 / 100. Above the halfway mark of governments measured. World Bank WGI 2024
Regulatory quality: 55.9 / 100. Above the halfway mark of governments measured. World Bank WGI 2024
Sitiveni RabukaPrime Minister
ParliamentLegislature, unicameral
Last election14 December 2022
Constitution2013
Government typeparliamentary republic
Fiji national goals: climate commitments on record · as recorded by Climate Watch, World Resources Institute
2050
Net zero
In Law<br>In Policy Document
Net-zero target as recorded by Climate Watch. Status: In Law (9/23/2021) In Policy Document (12/30/2020, 2/25/2019) ↗
The questions people actually type, answered in full sentences from the sourced data above.
swipe →
Is Fiji sustainable?
Fiji scores 72 out of 100 on the Throne Eco Index, across twelve equally weighted pillars. Fiji is a 300-island Pacific archipelago where volcanic high islands carry rivers and rainforest, most land is held communally by iTaukei clans, and inshore reefs are still managed through customary qoliqoli tenure.
Is the water in Fiji safe and plentiful?
Fiji's volcanic high islands, Viti Levu and Vanua Levu, carry rivers fed by heavy rainfall, so raw freshwater is abundant on the main islands. About 95.5% of the population has at least basic drinking water, but only 41.9% has a safely managed, contamination-free supply (World Bank/JMP, 2022). Smaller islands and outer atolls depend on rainwater catchment that runs short in the dry season.
Can Fiji feed itself?
Food made up about 19.5% of Fiji's merchandise imports in 2022 (World Bank), a moderate level for a Pacific state that still ships in rice and flour. Against this, subsistence and smallholder farming of root crops, along with sugar cane and reef fishing, remain widespread. Domestic production covers much of the fresh diet even where staple grains are imported.
Is it easy to eat plant-based in Fiji?
Traditional Fijian meals are built on root crops such as dalo (taro), cassava, breadfruit, yams and kumala, alongside coconut and tropical fruit. The large Indo-Fijian community adds an everyday vegetarian layer of dhal, roti and vegetable curries. Plant-based eating is easy, though iTaukei cooking also leans heavily on fish and meat.
How much of Fiji is actually protected?
Formal protection is low, with terrestrial protected areas covering about 3.9% of land and marine protected areas about 0.9% of territorial waters (World Bank). The stronger conservation story is customary, as most inshore fishing grounds are managed as qoliqoli by the clans that hold them. The Great Sea Reef was designated the Ramsar wetland Qoliqoli Cokovata on 16 January 2018, with the first community marine protected area declared in 2002 and nine more added in 2004.
What wildlife is left in Fiji?
Fiji is home to species found nowhere else, including the Fiji crested iguana and endemic birds such as the orange dove, the golden dove and the collared lory. Reefs are exceptionally rich; the Great Sea Reef alone shelters endangered fish, green turtles and spinner dolphins. The World Bank, using IUCN data, records 119 threatened species, made up of 7 mammals, 14 birds, 20 fish and 78 higher plants (2018).
Is Fiji on clean energy?
Fiji's fossil CO2 emissions are very low at about 1.6 tonnes per person in 2024, and it is a widely recognised climate leader that was the first nation to ratify the Paris Agreement and presided over the COP23 summit. Roughly half of its electricity comes from renewables, chiefly hydropower at the Monasavu scheme, with the remainder still supplied by imported diesel. Fiji targets 100 per cent renewable electricity by 2030 and has legislated a net-zero pathway.
How polluted is Fiji?
Fiji banned single-use plastic bags in 2020, having introduced a levy in 2017. Air is very clean, with mean PM2.5 of about 6.1 micrograms per cubic metre in 2020 (World Bank), far below most of the world. Solid-waste handling and marine litter remain weak spots, especially around the main towns.
Does recycling work in Fiji?
Fiji has no published national municipal recycling rate. Recycling is limited and largely informal, with PET, aluminium and scrap metal collected for export while most household waste goes to landfill or open dumps around the urban centres. The 2020 plastic-bag ban tackles litter at source rather than through kerbside recycling.
Is the farming in Fiji organic?
Certified organic land covered about 4.5% of Fiji's agricultural area, some 19,303 hectares, in 2020 (FiBL). That share is high for the region and reflects organic coconut and other export certification. It sits in the strong band for a small island economy.
Are there natural materials and craft in Fiji?
Masi, Fijian barkcloth beaten from paper-mulberry bark, is still made and remains central to ceremony and gift-giving. Women weave mats from pandanus and voivoi, including the prized kuta mats of Bua on Vanua Levu, and make rope from coconut fibre. This is a living materials tradition rather than a museum craft.
Is there living culture in Fiji?
About 86% of Fiji's land is held communally by iTaukei clans and cannot be sold, which keeps village life and customary authority intact. Visitors to a village present kava in the sevusevu ceremony, and the meke dance still carries oral history. Community-run and village-stay tourism means culture here is lived rather than staged.
What heritage does Fiji keep alive?
Fiji sustains vigorous living iTaukei heritage alongside Indo-Fijian traditions. The meke, a combined dance and chant accompanied by the lali drum, remains central to community life, and the yaqona or kava ceremony is a daily living ancestral practice. The vilavilairevo firewalking of Beqa Island continues as an ancestral ritual, and masi barkcloth making endures as a living craft.
So is Fiji actually green? The measured answer
What is working: renewable electricity at 60.1%.
What is not: land protected at 3.9% against a 30% mark, sea protected at 0.9% against a 30% mark.
Fiji sits 27 of 77 at 70/100. Every name links to its own destination page, built exactly like this one. The full ranking →
What is Fiji particularly good at?
✓Culture, scored 5/5. About 86% of Fiji's land is held communally by iTaukei clans and cannot be sold, which keeps village life and customary authority intact. Visitors to a village present kava in the sevusevu ceremony, and the meke dance still carries oral history. Community-run and village-stay tourism means culture here is lived rather than staged.
✓Heritage, scored 5/5. Fiji sustains vigorous living iTaukei heritage alongside Indo-Fijian traditions. The meke, a combined dance and chant accompanied by the lali drum, remains central to community life, and the yaqona or kava ceremony is a daily living ancestral practice. The vilavilairevo firewalking of Beqa Island continues as an ancestral ritual, and masi barkcloth making endures as a living craft. The vanua system of ancestral kinship and land still shapes everyday custom.
✓Energy, scored 4/5. Fiji's fossil CO2 emissions are very low at about 1.6 tonnes per person in 2024, and it is a widely recognised climate leader that was the first nation to ratify the Paris Agreement and presided over the COP23 summit. Roughly half of its electricity comes from renewables, chiefly hydropower at the Monasavu scheme, with the remainder still supplied by imported diesel. Fiji targets 100 per cent renewable electricity by 2030 and has legislated a net-zero pathway. Its very low emissions and strong policy are tempered by continuing diesel reliance, which holds it at 4.
Where does Fiji score worst?
✕Wildlife, scored 3/5. Fiji is home to species found nowhere else, including the Fiji crested iguana and endemic birds such as the orange dove, the golden dove and the collared lory. Reefs are exceptionally rich; the Great Sea Reef alone shelters endangered fish, green turtles and spinner dolphins. The World Bank, using IUCN data, records 119 threatened species, made up of 7 mammals, 14 birds, 20 fish and 78 higher plants (2018).
✕Conservation, scored 2/5. Formal protection is low, with terrestrial protected areas covering about 3.9% of land and marine protected areas about 0.9% of territorial waters (World Bank). The stronger conservation story is customary, as most inshore fishing grounds are managed as qoliqoli by the clans that hold them. The Great Sea Reef was designated the Ramsar wetland Qoliqoli Cokovata on 16 January 2018, with the first community marine protected area declared in 2002 and nine more added in 2004.
✕Recycling, scored 2/5. Fiji has no published national municipal recycling rate. Recycling is limited and largely informal, with PET, aluminium and scrap metal collected for export while most household waste goes to landfill or open dumps around the urban centres. The 2020 plastic-bag ban tackles litter at source rather than through kerbside recycling.
Similar countries doing it better and worse
New ZealandScored on the same twelve pillars as Fiji.80
AustraliaScored on the same twelve pillars as Fiji.70
Papua New GuineaScored on the same twelve pillars as Fiji.68
French PolynesiaScored on the same twelve pillars as Fiji.63
A note from the lens of mother natureswipe →
Energy, 4/5
Fiji's fossil CO2 emissions are very low at about 1.6 tonnes per person in 2024, and it is a widely recognised climate leader that was the first nation to ratify the Paris Agreement and presided over the COP23 summit. Roughly half of its electricity comes from renewables, chiefly hydropower at the Monasavu scheme, with the remainder still supplied by imported diesel.
Food and farming, 4/5
Food made up about 19.5% of Fiji's merchandise imports in 2022 (World Bank), a moderate level for a Pacific state that still ships in rice and flour. Against this, subsistence and smallholder farming of root crops, along with sugar cane and reef fishing, remain widespread.
Heritage, 5/5
Fiji sustains vigorous living iTaukei heritage alongside Indo-Fijian traditions. The meke, a combined dance and chant accompanied by the lali drum, remains central to community life, and the yaqona or kava ceremony is a daily living ancestral practice.
The Fiji Directory.
Everything on Hold The Throne that sits in Fiji, checked and listed.
World Bank Worldwide Governance Indicators, 2024. Percentile among all governments measured.
Government effectiveness
63.2 / 100
World Bank Worldwide Governance Indicators, 2024. Percentile among all governments measured.
Rule of law
62.2 / 100
World Bank Worldwide Governance Indicators, 2024. Percentile among all governments measured.
Political stability
77.8 / 100
World Bank Worldwide Governance Indicators, 2024. Percentile among all governments measured.
Voice and accountability
62.7 / 100
World Bank Worldwide Governance Indicators, 2024. Percentile among all governments measured.
Environmental Performance Index
46.0 / 100 · 88 of 180
Yale Environmental Performance Index 2024, ranked 88 of 180 countries assessed.
Ecosystem vitality
37.2 / 100 · 152 of 180
Yale Environmental Performance Index 2024, ranked 152 of 180 countries assessed.
Biodiversity and habitat
17.0 / 100 · 170 of 180
Yale Environmental Performance Index 2024, ranked 170 of 180 countries assessed.
Air pollution
70.7 / 100 · 97 of 180
Yale Environmental Performance Index 2024, ranked 97 of 180 countries assessed.
Terrestrial biomes protected
8.1 / 100 · 164 of 180
Yale Environmental Performance Index 2024, ranked 164 of 180 countries assessed.
Marine protected areas
99.5 / 100 · 39 of 131
Yale Environmental Performance Index 2024, ranked 39 of 131 countries assessed.
How Fiji Is Scored. The Throne Standard.
Every destination on the index is scored the same way, so a 4 in Barbados means exactly what a 4 means in Iceland. No self-declared data and no brochure claims are accepted. Every figure on this page carries its named source and year, and the history on each page names what empire took as plainly as it scores the present.
The 12 pillars every destination is scored on, equally weighted
01
Conservation
Land and sea actually protected, not pledged
02
Wildlife
What survives, what is endemic, what is lost
03
Water
Fresh water per person, and the ocean’s health
04
Food & farming
Whether the place can feed itself
05
Organic & clean
Certified land and pesticide reality
06
Climate & energy
Emissions per person, how the grid is powered
07
Waste
Where the rubbish goes, what comes back
08
Health
What people eat and die of
09
Heritage
Living culture, and what the law keeps standing
10
Ownership
Who owns the economy, how much of a dollar stays
11
Governance
Freedom, honesty, promises kept
12
Future
Measured trends run forward, pledges against pace
What each 0 to 5 pillar score means, in plain words
The institutions above are the ones cited on this page, ranked by how many of its figures they carry. This same sectioned page renders for all 77 scored destinations, each with its own researched history, comparison charts and three-way future. Read the full methodology
Every figure on this page, and where it came from: 74 sources across 25 institutions
World Bank18 FIGURES
Forest area (% of land area) AG.LND.FRST.ZS, Fiji, 2022 (63.1%) check
Terrestrial protected areas (% of total land area) ER.LND.PTLD.ZS, Fiji, 2024 (3.9%) check
Marine protected areas (% of territorial waters) ER.MRN.PTMR.ZS, Fiji, 2023 (0.9%) check
Sixth National Report to the Convention on Biological Diversity (Ministry of Waterways and Environment), Fiji is home to species found nowhere else, including the Fiji crested iguana and endemic birds such as the or check
Sixth National Report to the Convention on Biological Diversity (Ministry of Waterways and Environment) corroboration check
Sixth National Report to the Convention on Biological Diversity (Ministry of Waterways and Environment) corroboration check
Sixth National Report to the Convention on Biological Diversity (Ministry of Waterways and Environment) corroboration check
Sixth National Report to the Convention on Biological Diversity (Ministry of Waterways and Environment) corroboration check
Sixth National Report to the Convention on Biological Diversity (Ministry of Waterways and Environment) corroboration check
UNESCO Institute for Statistics4 FIGURES
public data API, indicator XGDP.FSGOV (Government expenditure on education as a percentage of GDP), Public spending on education runs at 4.2% of GDP and 13.8% of all government spending, and secondary enrolment check
public data API, indicator XGDP.FSGOV (Government expenditure on education as a percentage of GDP) corroboration check
public data API, indicator XGDP.FSGOV (Government expenditure on education as a percentage of GDP) corroboration check
public data API, indicator XGDP.FSGOV (Government expenditure on education as a percentage of GDP) corroboration check
BirdLife International, IUCN and UNEP-WCMC3 FIGURES
UN SDG Global Database, terrestrial Key Biodiversity Areas covered by protected areas (%) ER_PTD_TERR, Fiji, 2025 (11.2%), country-reported check
UN SDG Global Database, marine Key Biodiversity Areas covered by protected areas (%) ER_MRN_MPA, Fiji, 2025 (16.5%), country-reported check
UN SDG Global Database, freshwater Key Biodiversity Areas covered by protected areas (%) ER_PTD_FRHWTR, Fiji, 2025 (0.13%), country-reported check
Government of Fiji3 FIGURES
Fiji Climate Change Portal, Plastic Bag Ban Frequently Asked Questions, Fiji banned single-use plastic bags in 2020, having introduced a levy in 2017. check
Fiji Climate Change Portal, Plastic Bag Ban Frequently Asked Questions corroboration check
Fiji Climate Change Portal, Plastic Bag Ban Frequently Asked Questions corroboration check
Convention on Biological Diversity2 FIGURES
decision 15/4, Kunming-Montreal Global Biodiversity Framework, Target 3, The 30x30 target is 30% by 2030, so 29.1 percentage points are still to be designated. check
decision 15/4, Kunming-Montreal Global Biodiversity Framework, Target 3 corroboration check
FAO2 FIGURES
FAOSTAT Crops and Livestock Products (QCL), Oceania bulk dataset, By tonnage, the largest crops grown in Fiji are sugarcane, cassava and taro (FAO, FAOSTAT crop production, 202 check
UN SDG Global Database, forest area (% of land area) AG_LND_FRST, Fiji, 2025 (62.2%), country-reported check
UN SDG Global Database, forest area inside legally established protected areas (%) AG_LND_FRSTPRCT, Fiji, 2025 (2.6%), country-reported check
IUCN2 FIGURES
Red List Categories and Criteria, Version 3.1, second edition, Critically Endangered, the last IUCN category before Extinct in the Wild, and still recorded in Fiji. check
Red List Categories and Criteria, Version 3.1, second edition corroboration check
WHO/UNICEF Joint Monitoring Programme2 FIGURES
UN SDG Global Database, population using safely managed drinking water (%) SH_H2O_SAFE, Fiji, 2024 (42.1%), modelled estimate check
UN SDG Global Database, population using safely managed sanitation (%) SH_SAN_SAFE, Fiji, 2024 (48.5%), modelled estimate check
World Bank / WHO-UNICEF JMP2 FIGURES
Safely managed drinking water (% of population) SH.H2O.SMDW.ZS, Fiji, 2022 (41.9%) check
At least basic drinking water (% of population) SH.H2O.BASW.ZS, Fiji, 2022 (95.5%) check
WWF-Pacific2 FIGURES
The Great Sea Reef: Weaving Together Communities for Conservation (case study, 2012), Reefs are exceptionally rich; the Great Sea Reef alone shelters endangered fish, green turtles and spinner dol check
The Great Sea Reef: Weaving Together Communities for Conservation (case study, 2012) corroboration check
Climate Change Tracker1 FIGURE
Fiji greenhouse gas progress and recent impact. check

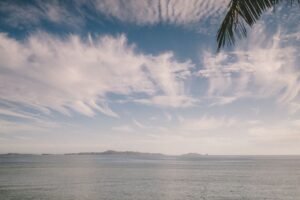
 New ZealandScored on the same twelve pillars as Fiji.80
 AustraliaScored on the same twelve pillars as Fiji.70
 Papua New GuineaScored on the same twelve pillars as Fiji.68
 French PolynesiaScored on the same twelve pillars as Fiji.63