Destinations › Europe · The Destination Index · universal template · every figure sourced
Iceland.
Northern Europe, island between the Greenland Sea and the North Atlantic Ocean, northwest of the United Kingdom. 103,000 sq km and 392,404 people, 4,970 km of coastline, temperate; moderated by North Atlantic Current; mild, windy winters; damp, cool summers.
Region · EuropePopulation · ~392,404Languages · Icelandic, English, PolishEco Index · 65/100 · Passable
The Eco Index across 12 pillars · scored 0 to 5 · World Bank, OWID, WHO/UNICEF JMP, FiBL, Protected Planet, IUCN, UNESCO (2023-24)
Conservation
Wildlife
Water
Food & farming
Organic & clean
Climate & energy
Waste
Health
Heritage
Ownership
Governance
Future
The History of Iceland.
Iceland's living heritage centres on the sagas and a strong oral and literary storytelling culture, alongside rimur, the chanted epic-verse tradition, and kvaedaskapur. Older ring dances such as the vikivaki survive in revived form, and the pre-Christian Norse spiritual path has been revived as Asatru, a recognised living religion.
Where the name comes from
Ísland, 'land of ice', a name attributed to the Norse settler Hrafna-Flóki. Norse accounts also record earlier, warmer names for it. Source: national and regional toponymic records.
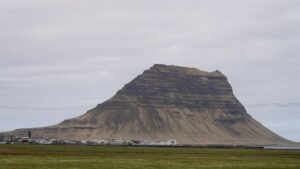
The land itself: a plateau set with mountain peaks and icefields, its coast deeply cut by bays and fjords. Its high point is Hvannadalshnúkur, 2,110 m. Source: national mapping and survey records.
Where it starts
A dated ash line
Iceland has no deep human past because there were no people here to have one. What it has instead is unusually precise dating: an ash fall from an eruption between 869 and 873 left a line that every site can be placed above or below. A longhouse at Stodvarfjordur in the east sits below that line, dated by barley grains to around AD 800, roughly seventy years before the traditional settlement date of 874, and is read as a seasonal camp rather than a farm.
How it got here
Assembly, sagas, geothermal
An assembly was founded at Thingvellir in 930, among the oldest parliamentary institutions in the world. The sagas were written down between the twelfth and fourteenth centuries and form one of medieval Europe's great literary bodies. Iceland came under Norwegian and then Danish rule from 1262. The Laki eruption of 1783 killed a fifth of the population and its haze affected harvests across Europe. Iceland became an independent republic in 1944, and from 1975 geothermal district heating was extended nationally.
The timeline
c. AD 800
Stod.
A longhouse at Stodvarfjordur, dated by barley grains, predates the accepted settlement date by around seventy years and sits below the volcanic ash layer of 869 to 873. ↗
c. 869 to 873
The settlement layer.
A tephra fall from an eruption leaves a dated ash line used to place every Icelandic site before or after it. ↗
874
Landnam.
The traditional date of permanent settlement, recorded in the Book of Settlements. ↗
930
The Althing.
An assembly is founded at Thingvellir, among the oldest parliamentary institutions in the world. ↗
c. 1100s to 1300s
The sagas.
Icelandic prose narratives are written down, one of medieval Europe's great literary bodies. ↗
1262 to 1944
Norway and Denmark.
Iceland comes under Norwegian rule in 1262 and passes to Denmark with the union of the crowns, ending the commonwealth that had governed by assembly. ↗
1783 to 1784
Laki.
A volcanic fissure eruption kills a fifth of the population and its haze affects harvests across Europe. ↗
1944
The republic.
Iceland declares a republic in 1944. The declaration was signed at Logberg on the Thingvellir plain, the rock where the old assembly had met and proclamations were read. ↗
1975
Renewable heat.
District heating from geothermal water is extended nationally, and Iceland now heats almost every building without fossil fuel. ↗
Protected areas cover 20.9% of the land (World Bank, 2024), including the huge Vatnajokull National Park, with strong enforcement, but only 0.4% of territorial waters are protected (World Bank, 2021) despite vast fishing grounds. Land protection is strong and marine protection weak.
Is wild Iceland protected? 20.9% of the land is, against a 30% target for 2030
How protected is nature in Iceland?
Forest cover0.5%
Terrestrial protected area20.9%
Marine protected area0.5%
33 (mammals, birds, fish & plants) listed as threatened.
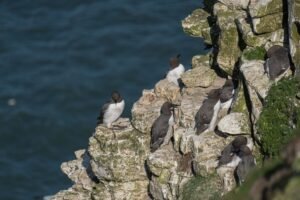
Found only here. The Arctic fox is the only native land mammal, with huge seabird colonies of puffins and whales offshore; diversity and endemism are naturally low
The watchlist
ThreatenedNordcaper (Eubalaena glacialis)North Atlantic right whale (Eubalaena glacialis): once common in Icelandic waters, but hunted out from the sixteenth century onwards. It survives today mainly off the eastern seaboard of North America, and reaches Iceland only as a very rare and irregular visitor.
ThreatenedEmberiza aureolaCritically Endangered on the IUCN Red List, and recorded in Iceland in GBIF occurrence data (bird).
ThreatenedBluet (Dipturus batis)Critically Endangered on the IUCN Red List, and recorded in Iceland in GBIF occurrence data (shark or ray).
ThreatenedAnguilla anguillaCritically Endangered on the IUCN Red List, and recorded in Iceland in GBIF occurrence data (species).
ThreatenedBalearic Shearwater (Puffinus mauretanicus)Critically Endangered on the IUCN Red List, and recorded in Iceland in GBIF occurrence data (bird).
Critically Endangered, the last IUCN category before Extinct in the Wild, and still recorded in Iceland. GBIF holds 9 verified occurrence records.
Emberiza aureola
Critically Endangered, the last IUCN category before Extinct in the Wild, and still recorded in Iceland. GBIF holds 55 verified occurrence records.
Bluet (Dipturus batis)
Critically Endangered, the last IUCN category before Extinct in the Wild, and still recorded in Iceland. GBIF holds 30 verified occurrence records.
Species named here are drawn from GBIF occurrence records for Iceland filtered to the IUCN Red List threatened categories. Species are listed where GBIF holds occurrence records for them in this country. Record counts are not published here because the figure cannot be reproduced from a public GBIF query.
Nature reserve in Mýrdalshreppur, mapped and named in the open record for Iceland. OpenStreetMap.
Water and Ocean in Iceland.
Iceland has enormous freshwater abundance from glaciers, springs and groundwater, and 100% of people have safely managed drinking water (World Bank, 2020). The tap water is among the purest in the world and safe to drink everywhere.
Does Iceland have enough fresh water? Yes, with headroom
100% of people here have safely managed drinking water at home (2024, WHO/UNICEF JMP). Tap water is safe for a visitor nearly everywhere.
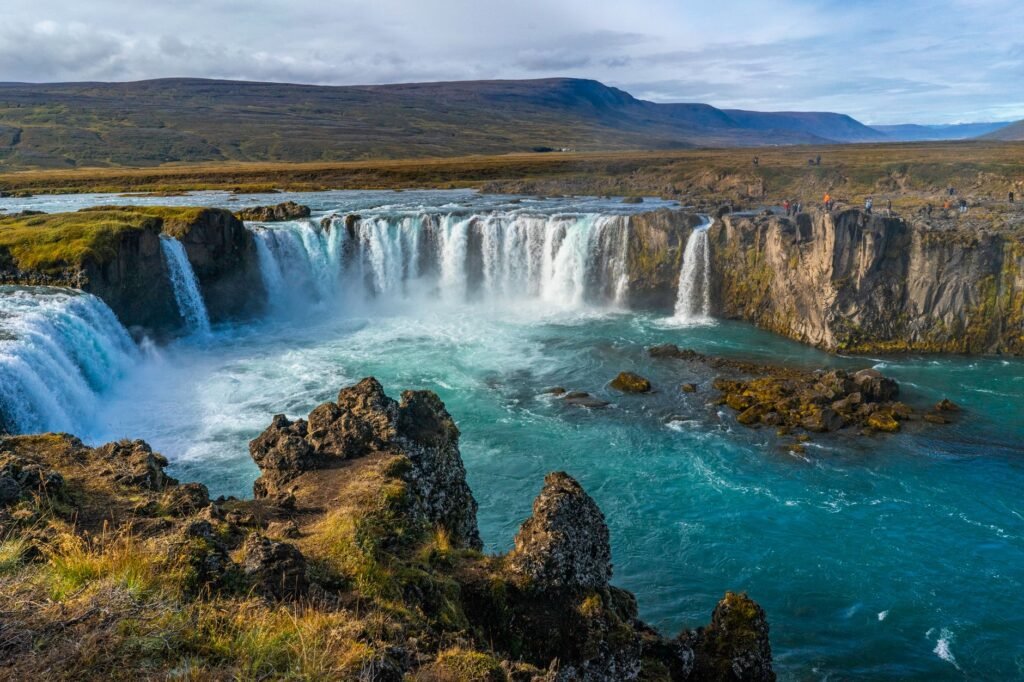
Cleanest water: The Silfra fissure at Thingvellir, filled with filtered glacial meltwater
How much fresh water does Iceland have, per person?
445,023 m³
Iceland
1,000 m³
the UN “water scarce” line
Iceland withdraws about 290 million cubic metres of fresh water a year (2022). That is 0.4% of the fresh water actually available to it, which FAO counts as no water stress. Of what is taken, farming takes 0%, homes and towns 29%, industry 71%. Source: FAO AQUASTAT.
What are the rules on Iceland beaches?
✓Tap water: Drinkable.
✓Plastic rules: Yes; single use plastics were banned in 2021 in line with the EU directive.
✓Solo travel: rated easy on the record for this destination.
✕Marine protection: 0.43% of the sea is protected. The 30x30 pledge for 2030 is not met yet.
How is the sea around Iceland doing?
One cross-section, every answer measured.
Surface
What the coast carries
Volcanic geology, aurora borealis (Sep–Mar) and near-24-hour daylight in summer; the weather is a mood.
Nearshore
Protected water
0.5% of territorial waters are protected, against the 30% pledged for 2030 under the Global Biodiversity Framework.
Cleanest
Where the water is cleanest
The Silfra fissure at Thingvellir, filled with filtered glacial meltwater.
The record
Measured
Iceland has enormous freshwater abundance from glaciers, springs and groundwater, and 100% of people have safely managed drinking water (World Bank, 2020). The tap water is among the purest in the world and safe to drink everywhere.
Sea protected
0.43%
Against the 30% pledged for 2030 under the Global Biodiversity Framework.
Threatened species
33 (mammals, birds, fish & plants)
Mammals, birds, fish and higher plants on the IUCN list.
Cleanest water
here
The Silfra fissure at Thingvellir, filled with filtered glacial meltwater.
Is the tap water safe in Iceland?
100% of people have safely managed drinking water at home (2024, WHO/UNICEF JMP). Renewable fresh water works out at about 445,023 cubic metres per person a year (World Bank).
How hard is the water supply being pushed?
Of every 10 buckets nature refills, 0 are already taken. Withdrawals run at 0.4% of what Iceland renews internally each year (2022, World Bank / FAO AQUASTAT). That is inside the 25% mark generally treated as water stress, so the supply has headroom.
When is the best time to visit Iceland? Tap your month.
Tap your month.
JanFebMarAprMayJunJulAugSepOctNovDec
.
How much fresh water does Iceland actually have?
Nature renews about 445,023 cubic metres of fresh water per person per year here. That ranks Iceland 208 of 208 countries measured, making it the best-watered country measured, per person. The UN treats anything under 1,000 cubic metres as water scarce, and this is above that line. World Bank / FAO AQUASTAT.
With little arable land, Iceland imports a large share of its food, especially grains, fruit and vegetables, though geothermal greenhouses grow tomatoes, cucumbers and herbs year round and the country is self sufficient in fish and lamb. Import dependence keeps the score low.
Where does the food in Iceland come from?
11.1% imported
about US$1,211m a year
On the plate: Cucumbers and herbs year round
How often each food is on the plate
Share of people eating each one regularly. These overlap, so they do not add up to 100%.
Cucumbers33%
Herbs24%
1 of 10
bites are imported
The island buys in more food energy than it eats. About US$1,211m a year leaves the country to pay for it. The green slice is roughly what still grows here.
About 11.1% of everything Iceland buys in from abroad is food, roughly 1 in every 10 imported items on the dock (2025, World Bank). Farming itself is 3.7% of the economy and 16.2% of the land is agricultural, of which 1.2% is arable. The green slice is roughly what still grows here.
What is killing people in Iceland? The imported diet.
Cause of death, and the diet behind it.
Non-communicable diseases, all combined90%
Diabetes6.9%
Adults living with overweight or obesity. 57.4%.
Can Iceland feed itself?
1.2%
Arable land
16.3%
Agricultural land
8,746
Farmers
298,997
Arable acres
3.7%
Agriculture, share of GDP
Harvest: A short summer growing season outdoors, with geothermal greenhouses producing year round
Feeding itself
With little arable land, Iceland imports a large share of its food, especially grains, fruit and vegetables, though geothermal greenhouses grow tomatoes, cucumbers and herbs year round and the country is self sufficient in fish and lamb. Import dependence keeps the score low.
Certification
Only about 0.3% of agricultural land is certified organic (FiBL, 2020) and conversion is rare, placing Iceland in a low band, though a national plan targets 10% by 2040.
Water for crops
Iceland has enormous freshwater abundance from glaciers, springs and groundwater, and 100% of people have safely managed drinking water (World Bank, 2020). The tap water is among the purest in the world and safe to drink everywhere.
Why the organic number looks like that. Certified-organic farmland is not separately reported for Iceland, and that is a certification gap rather than proof nothing is grown cleanly. What the official land record does show: 16.2% of the country is agricultural land and 1.2% is arable (2023, World Bank). Certification is paid for per farm per year by a foreign body, which prices out smallholders, so the organic number reads worse than the practice.
What actually grows here
BarleyPotatoesCucumbers/gherkins
The food that already fits
The plant-based kitchen here is not an import. By tonnage, the largest crops grown in Iceland are potatoes, barley, cucumbers and gherkins, tomatoes and carrots and turnips (FAO, FAOSTAT crop production, 2024). That is what the land itself puts on a plate.
Iceland's grid is essentially 100% renewable, with roughly 70% from hydropower and 30% from geothermal energy, and geothermal also heats most homes. Its territorial CO2 emissions are nonetheless high at about 9.7 tonnes per person in 2024 (Our World in Data, Global Carbon Project), driven by energy-intensive aluminium smelting and the fishing fleet rather than the power grid. The country targets carbon neutrality by 2040 and hosts pioneering carbon-mineralisation projects such as Carbfix. On the clean-power measure that anchors this pillar it is a clear leader.
What powers Iceland?
Renewable 100%Fossil 0%
Climate pollution per person
The safe amount, what the planet can absorb
2 tonnes
One person here
8.52 tonnes
The world average, for comparison
4.7 tonnes
The worst it ever got
12.16 tonnes
The grid
Iceland's grid is essentially 100% renewable, with roughly 70% from hydropower and 30% from geothermal energy, and geothermal also heats most homes. Its territorial CO2 emissions are nonetheless high at about 9.7 tonnes per person in 2024 (Our World in Data, Global Carbon Project), driven by energy-intensive aluminium smelting and the fishing fleet rather than the power grid.
Pollution
Air is among the cleanest in Europe, with a PM2.5 annual mean around 6 micrograms per cubic metre (World Bank, 2017), close to WHO guidance apart from occasional volcanic and dust events, and litter is low. Certain single use plastics were banned in 2021 in line with the EU directive.
Water stress
Iceland has enormous freshwater abundance from glaciers, springs and groundwater, and 100% of people have safely managed drinking water (World Bank, 2020). The tap water is among the purest in the world and safe to drink everywhere.
What pollutes most here
1IndustryAluminium smelting draws much of the cheap power, and cruise ship tourism strains small ports.named
2AirModelled annual mean against a WHO guideline of 5 µg/m³.6.48
3On the recordAir is among the cleanest in Europe, with a PM2.5 annual mean around 6 micrograms per cubic metre (World Bank, 2017), close to WHO guidance apart from occasional volcanic and dust events, and litter is low.
What has Iceland promised on climate?
Net zero, whole economy2040
Electricity renewable today100% (2016)
Land protected, against a 30% target20.9% by 2025
Sea protected, against a 30% target0.5% by 2025
The net-zero target year on file with Climate Watch is 2040, status: in law; in policy document. Measured against it, 100% of electricity is already renewable (2016, World Bank), so 0% of the grid is still to be converted. The pledge on file is measured here against what has actually been delivered, not taken on its own (UNFCCC NDC Registry, CBD Kunming-Montreal Target 3).
The biggest line item
One return flight against a whole year of living.
A resident's entire year8.52 t CO2e
Safe-climate budget, per year2 t CO2e
Sydney return, economy3 t CO2e
Singapore return, economy2.08 t CO2e
Johannesburg return, economy1.97 t CO2e
Los Angeles return, economy1.25 t CO2e
Dubai return, economy1.24 t CO2e
How much CO2 does flying to Iceland emit?
Tap where you would fly from. One return flight, economy.
Every prompt runs on a machine in a building on somebody’s grid. What that costs the planet depends less on the prompt than on what is burning to power it. Here is what would power one in Iceland.
Data centres
20
Registered colocation and interconnection facilities, PeeringDB, 2026
Grid renewable
100.0 %
What a machine here runs on.
What powers a data centre in Iceland?
Running AI here is about as clean as it currently gets.
Renewable 100%Fossil 0%
Cooling water. Every one of those halls runs on the national grid, which is 100% renewable today (World Bank). A data centre is only as clean as the electricity behind it, so the same figure that decides this country's climate score also decides the footprint of the AI running inside it. Cooling water use is not separately published by facility, and no operator here reports it.
The rules. Iceland has 20 colocation and interconnection facilities on the public PeeringDB register, concentrated in Reykjavik (7), Reykjanesbær (2), Akureyri (2), alongside 3 internet exchanges (RIX, Múli IXP, REMIX). Named sites include DataCell Reykjavik 1, DataCell Keflavik 1, Verne Iceland, RIX-K2.
Where the cables land. 3 landing points · Landeyjar, Seydisfjordur, Thorlakshofn
15% residents to 85% visitors across a year. 2,202,000 international arrivals in 2019 against 392,404 people who live here (2025, World Bank / UN Tourism).
Where a visitor dollar goes in Iceland
488k
Visitors a year
1.2
Visitors per resident
How deep in debt is Iceland?· for every $100 Iceland earns in a year, it owes…
Pay to the order of: the creditorsmemo · the 2011 peak
$ 137The worst year on the IMF record. Iceland owed $137 for every $100 it earned.
IMF World Economic Outlook, 2011signed, the creditors
Pay to the order of: the creditorsmemo · today
$ 54What is owed now, for every $100 of national income (2026).
IMF World Economic Outlook, 2026signed, the creditors
Pay to the order of: the creditorsmemo · projected 2031
$ 43The IMF's own forecast has this falling to $43 by 2031.
IMF World Economic Outlook projection, 2031signed, the forecast
For every $100 Iceland earns in a year, it owes $54 (2026, IMF World Economic Outlook). The interest on that is paid before schools, clinics or coastline get their turn.
Where does a tourist dollar actually go in Iceland?
Play one tourist dollar around the board. Every square is a measured fact from this page.
START!
1
GO: a visitor lands
$100 goes on the table. 2,202,000 international arrivals in 2019 against 392,404 residents, 5.6 visitors for every resident (World Bank / UN Tourism).
$100 in play
2
The bed
Who owns the largest places to stay in Iceland is not published in the records we can check, so this square is left open rather than guessed. Where a listing names its owner, it is shown in the ownership table below.
not published
3
The plate
Food is only 11.1% of everything Iceland imports (2025, World Bank), so most of a meal is bought from producers inside the country. Eating what the land here actually grows, barley, potatoes, cucumbers/gherkins, keeps that money with the grower.
mostly home-grown
4
The power
100% of the electricity is renewable (2016, World Bank), so the energy on the bill is mostly generated inside the country rather than shipped in.
made at home
5
What actually stays
Of the two parts of a visitor's bill that can be measured here, the plate and the power stay inside Iceland. This is not an economy where a visitor's money drains away, and the board is shorter for it.
most of it
6
Pay the bank first
Iceland owes $54 for every $100 it earns (IMF World Economic Outlook, 2026 projection). The interest is paid before anything else on this board.
$54 per $100
7
No plan B
35.7% of everything Iceland sells abroad is aluminium (2023, UN Comtrade). One market moving takes the whole board with it.
35.7% one export
8
Community chest
Tourism earns 11.9% of everything Iceland makes from exports (2008, World Bank / UN Tourism). That is how much of the economy depends on the game continuing.
11.9% of exports
9
The flight
Getting here is usually the biggest single line on the bill. From Sydney a return economy seat is 3.00 t CO2, on the UK Government's published conversion factors. It is the one part of the trip this board cannot reduce.
3.00 t CO2
10
Back to GO
The economy turns over about US$44 billion a year (IMF World Economic Outlook, 2026 projection). Every lap of this board is a choice about how much of it stays.
US$44bn
GDPUS$38.6bn
Agriculture, share of GDP3.7%
Visitors a year488,000
Visitors per resident1.2
Residents~392,404
Agriculture
Farming is 3.7% of the economy. With little arable land, Iceland imports a large share of its food, especially grains, fruit and vegetables, though geothermal greenhouses grow tomatoes, cucumbers and herbs year round and the country is self sufficient in fish and lamb.
Natural materials
Iceland keeps a genuinely living wool tradition, with Icelandic sheep wool spun into lopi and hand knitted into lopapeysa sweaters that are still made and worn. It is a single strong fibre culture rather than a diverse one.
Energy
Iceland's grid is essentially 100% renewable, with roughly 70% from hydropower and 30% from geothermal energy, and geothermal also heats most homes. Its territorial CO2 emissions are nonetheless high at about 9.7 tonnes per person in 2024 (Our World in Data, Global Carbon Project), driven by energy-intensive aluminium smelting and the fishing fleet rather than the power grid.
Who owns the biggest hotels in Iceland?
By rooms · company records and press.
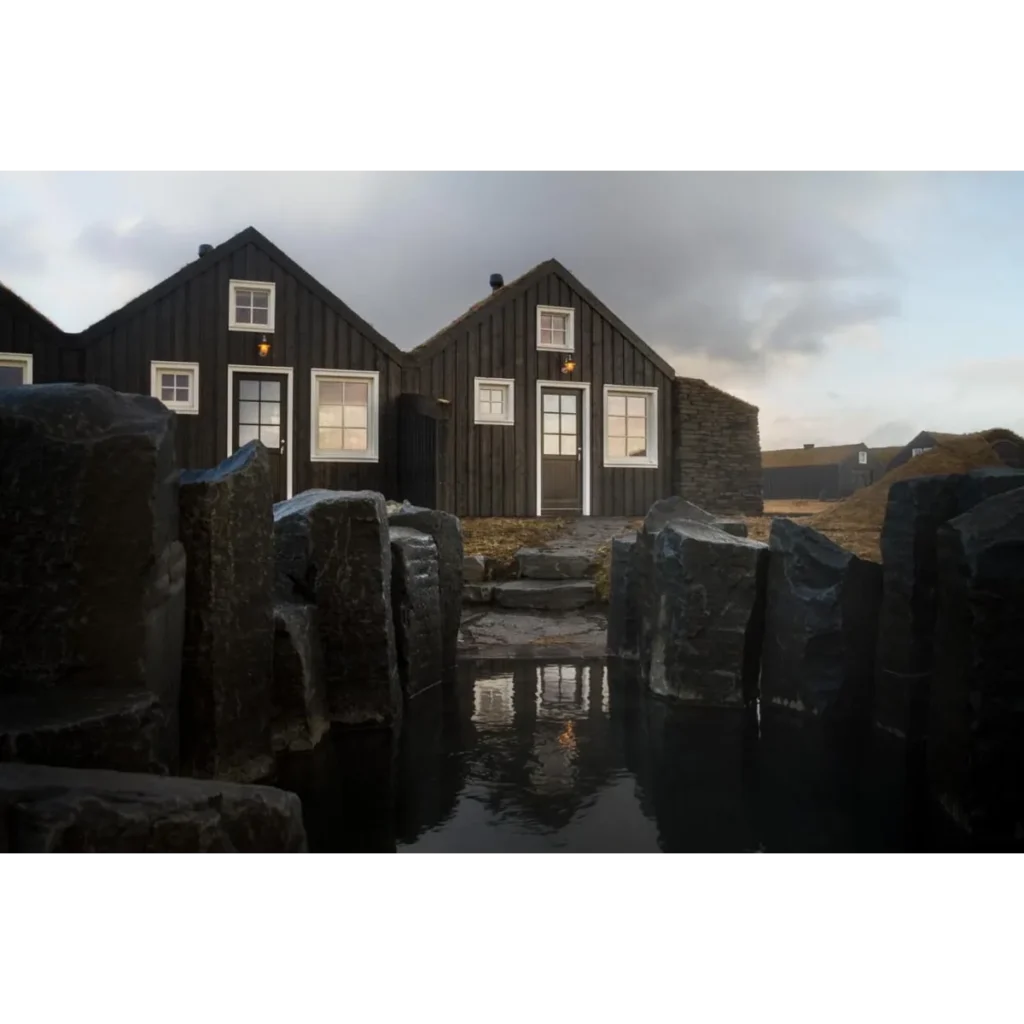
Torfhús Retreat · ~25 roomsIndependentnot published
Visitors, over time
20151,389k
20161,891k
20172,353k
20182,488k
20192,202k
2020488k
How much of your money actually stays here?
Tap the holiday you are planning.
All-inclusive resortForeign-owned hotel and tourist restaurantsLocally owned stay and local restaurantsGuesthouse, markets and public transport
Resort guest, villa renter, family, nomad or backpacker. The honest playbook for each, from the same sourced numbers.
Already booked a resort? · the rescue list
Five swaps that move your money back on-island
1. Eat where the country eats Choose kitchens cooking what the land here grows, barley, potatoes and cucumbers/gherkins, over an imported menu. The checked list →
2. Book with a local operator Never the lobby desk. The margin on a tour is the part that stays. Eco tours →
3. Stay somewhere locally owned Ownership decides where the room rate books. Eco stays →
4. Use the transport residents use Self drive the Ring Road; there are no passenger railways
5. Buy the craft, not the souvenir Natural-materials work made here pays the maker directly; imported gifts pay a shipping line.
swipe →
First time here
Iceland runs on almost entirely renewable electricity and pours the purest tap water in the world, yet imports much of its food and still permits commercial whaling.
Best time: June to August for access, September to March for the Northern Lights
Getting around
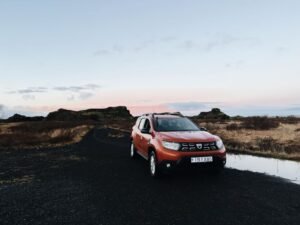
Self drive the Ring Road; there are no passenger railways
Transport is where the fare either stays or leaves.
Eating here
The everyday plate that actually grows here is barley, potatoes and cucumbers/gherkins. Ordering those keeps the money with the grower and cuts the imported share of the meal.
Eating what the country grows is the cheapest way to cut the import bill.
Good to know
Cards everywhere, cash almost unused; ISK. Drive the Ring Road slowly and book everything well ahead in summer.
Rate my hotel. Tap yours for the honest verdict.
Ownership from company records and press.
Torfhús Retreat
.
Who owns the place to stay
Torfhús RetreatIndependent · 25 rooms
The one property listed here does not publish who ultimately owns it, so no claim is made either way. Ownership is what decides how much of a room rate stays in the country, which is why we show it when a listing states it.
Society and Governance in Iceland.
How well is Iceland actually run?
Governance, measured · World Bank WGI
Four measured answers, none of them opinion. Averaged across corruption control, delivery and accountability, Iceland scores 83 out of 100 (2024, World Bank Worldwide Governance Indicators). That is a state that generally does what it says it will do, which is what makes a climate pledge worth reading.
How well is Iceland run? · each scored out of 100, higher is better
Clean government, scored 85 of 100
Control of corruption scores 84.9 out of 100 (2024, World Bank Worldwide Governance Indicators). That puts it in the cleanest quarter of governments measured.
85
Freedom and rights, scored 82 of 100
Voice and accountability, which measures free expression, free media and the ability to choose a government, scores 81.8 out of 100 (2024, World Bank WGI). Citizens here can question their government openly.
82
Government effectiveness, scored 83 of 100
Government effectiveness, which measures the quality of public services and how well policy is actually delivered, scores 83.3 out of 100 (2024, World Bank WGI). Delivery is rated among the strongest measured.
83
Income equality, scored 27 of 100
The Gini index of income inequality reads 26.8 (2019, World Bank). Zero is perfect equality and 100 is one person holding everything. Below 40 is the level usually treated as manageable, and Iceland sits inside it.
27
LGBTQ+ status: HighSolo female travel: EasyIndustry to avoid: Aluminium smelting draws much of the cheap power, and cruise ship tourism strains small ports
What is daily life in Iceland really like? Measured
Getting around, breathing, throwing away, learning. The honest checklist.
TransportAirWaterWastePower
✓How you get around Self drive the Ring Road; there are no passenger railways
✓Air quality, measured Modelled annual mean 6.48. The WHO guideline is 5 µg/m³.
✓Where the air is cleanest The highland interior and the remote fjords
✓Tap water Drinkable
✓What to drink Glacial groundwater, among the cleanest tap water on Earth.
✓Plastic rules Yes; single use plastics were banned in 2021 in line with the EU directive
✓Sockets and voltage Type C/F, 230V
Made in Iceland.
Iceland keeps a genuinely living wool tradition, with Icelandic sheep wool spun into lopi and hand knitted into lopapeysa sweaters that are still made and worn. It is a single strong fibre culture rather than a diverse one. Every step of processing done at home is value that stops leaving the country.
What Iceland actually sells the world
The single biggest thing Iceland sells the world is aluminium, 35.7% of all exports in 2023 (about US$2.43 billion, UN Comtrade). The next four are fish and seafood at 33.8%, optical, medical and precision instruments at 5.1%, animal feed residues at 4.3%, iron and steel at 3.5%.
Sells now · 35.7% of exports
Aluminium
Aluminium is 35.7% of everything Iceland sold abroad in 2023, worth about US$2.43 billion. UN Comtrade.
Sells now · 33.8% of exports
Fish and seafood
Fish and seafood is 33.8% of everything Iceland sold abroad in 2023, worth about US$2.30 billion. UN Comtrade.
Sells now · 5.1% of exports
Optical, medical and precision instruments
Optical, medical and precision instruments is 5.1% of everything Iceland sold abroad in 2023, worth about US$0.35 billion. UN Comtrade.
Sells now · 4.3% of exports
Animal feed residues
Animal feed residues is 4.3% of everything Iceland sold abroad in 2023, worth about US$0.30 billion. UN Comtrade.
Sells now · 3.5% of exports
Iron and steel
Iron and steel is 3.5% of everything Iceland sold abroad in 2023, worth about US$0.24 billion. UN Comtrade.
Buys in · 13.2% of imports
Mineral fuels and oils
Iceland imported US$1.25 billion of mineral fuels and oils in 2023, 13.2% of everything it bought abroad, and sells none of it back. Every point of that is a business that could be built at home rather than shipped in. UN Comtrade.
Buys in · 11.9% of imports
Vehicles
Iceland imported US$1.12 billion of vehicles in 2023, 11.9% of everything it bought abroad, and sells none of it back. Every point of that is a business that could be built at home rather than shipped in. UN Comtrade.
Buys in · 11.8% of imports
Electrical machinery and electronics
Iceland imported US$1.11 billion of electrical machinery and electronics in 2023, 11.8% of everything it bought abroad, and sells none of it back. Every point of that is a business that could be built at home rather than shipped in. UN Comtrade.
Buys in · 10.7% of imports
Machinery and mechanical appliances
Iceland imported US$1.02 billion of machinery and mechanical appliances in 2023, 10.7% of everything it bought abroad, and sells none of it back. Every point of that is a business that could be built at home rather than shipped in. UN Comtrade.
The maths for an entrepreneur. Iceland produces about US$39 billion a year, which is roughly US$98,323 per person (2025, World Bank). Farming is 3.7% of that, while food is 11.1% of everything the country imports. The country buys in more food than its own farms contribute to the economy, and every point of that gap is a business someone could build here rather than ship in.
A living tradition of Iceland, still practised rather than archived.
Oral storytelling
A living tradition of Iceland, still practised rather than archived.
Rimur chanted epic verse
A living tradition of Iceland, still practised rather than archived.
Kvaedaskapur
A living tradition of Iceland, still practised rather than archived.
Vikivaki ring danceA living tradition of Iceland, still practised rather than archived.
Asatru revived Norse ancestral spiritualityA living tradition of Iceland, still practised rather than archived.
Does Iceland protect its heritage by law?
Partly, and the gaps say as much as the protections.
What is kept alive. Iceland's living heritage centres on the sagas and a strong oral and literary storytelling culture, alongside rimur, the chanted epic-verse tradition, and kvaedaskapur. Older ring dances such as the vikivaki survive in revived form, and the pre-Christian Norse spiritual path has been revived as Asatru, a recognised living religion. Ancestral belief in the huldufolk, the hidden people or elves, remains part of everyday cultural life.
Who it belongs to. Iceland has a strong national identity rooted in the sagas and its language, and tourism is well regulated, but there is no indigenous minority and headline sites such as the Blue Lagoon are highly commercial. Community benefit is decent but tourism is a dominant industry.
Only here. Silfra at Thingvellir, where you can snorkel between the North American and Eurasian tectonic plates in glacial water.
Three futures for Iceland, every one run forward from measured data.
Where the making actually happens
Named cultural and craft sites on the open map: National Museum of Iceland (Reykjavik), The Icelandic Phallological Museum (Reykjavik), Viking World Museum (Njarðvík), Reykjavik Art Museum (Reykjavik), Arbaer Outdoor Museum (Reykjavik). OpenStreetMap. Named craft workshops on the open map: Gallerí Spuni, Knifemaker, Vöruhúsið.
Every measured trend on one line
Run forward at the pace already recorded.
+126%
Forest cover
1995: 0.234 % → 2023: 0.529 %
+0%
Renewable electricity
1995: 99.8 % → 2016: 100 %
-7%
CO2 per person
1995: 9.12 t → 2024: 8.52 t
+131%
Tourist arrivals
1995: 211 k → 2020: 488 k
+3%
Protected land
2013: 20.2 % → 2025: 20.9 %
-62%
Farm workforce
1995: 9.57 % → 2025: 3.61 %
+25%
Protected sea
2013: 0.4 % → 2025: 0.5 %
-14%
Agricultural land
1995: 18.9 % → 2023: 16.2 %
+3%
Urban population
1995: 91.6 % → 2025: 94.2 %
-20%
Air pollution
1995: 6.16 µg/m³ → 2023: 4.93 µg/m³
-30%
Fresh water per person
1995: 635590.1 m³ → 2022: 445022.7 m³
+25%
Adult overweight
1995: 46 % → 2022: 57.4 %
+0%
Electricity access
1995: 100 % → 2024: 100 %
+257%
GDP per person
1995: 27565 → 2025: 98323
+47%
Population
1995: 267 k → 2025: 392 k
+48%
Renewable energy use
1995: 55.7 % → 2021: 82.4 %
+90%
Energy per person
1995: 8405 kg → 2024: 15997 kg
+7%
Protected area, total
2013: 2.7 % → 2025: 2.9 %
+6%
Life expectancy
1995: 78 yrs → 2024: 82.8 yrs
-24%
Cereal yield
2015: 3187 ha → 2023: 2430 ha
-33%
Fertiliser use
1995: 144.9 ha → 2023: 97.3 ha
-31%
Rural population
1995: 8.36 % → 2025: 5.78 %
+30%
Water productivity
1995: 58.2 $/m3 → 2022: 75.9 $/m3
+1%
Health spending
2000: 8.9 % → 2024: 8.98 %
+127%
Forest area
1995: 234.5 km2 → 2023: 533.1 km2
+182%
Electric power use
1995: 17396 kWh → 2024: 48998 kWh
-16%
Emissions: Agriculture
1990: 0.7 e → 2023: 0.59 e
-80%
Emissions: Building
1990: 0.05 e → 2023: 0.01 e
-18%
Emissions: Energy
1990: 1.93 e → 2023: 1.58 e
-41%
Emissions: Industrial Processes
1990: 0.56 e → 2023: 0.33 e
-87%
Emissions: Manufacturing/Construction
1990: 0.55 e → 2023: 0.07 e
+50%
Emissions: Transportation
1990: 0.64 e → 2023: 0.96 e
World Bank open data, recorded series
How much forest is left?
Forest cover moved from 0.2% to 0.5% across 28 recorded years.
World Bank AG.LND.FRST.ZS
How clean is the grid?
Renewable electricity moved from 99.8% to 100.0% across 21 recorded years.
World Bank EG.ELC.RNEW.ZS
How much climate pollution per person?
CO2 per person moved from 9.1 t to 8.5 t across 29 recorded years.
World Bank EN.GHG.CO2.PC.CE.AR5
How many people visit?
Tourist arrivals moved from 211k to 488k across 25 recorded years.
World Bank ST.INT.ARVL
How much land is protected?
Protected land moved from 20.2% to 20.9% across 12 recorded years.
World Bank ER.LND.PTLD.ZS
How many people still farm?
Farm workforce moved from 9.6% to 3.6% across 30 recorded years.
World Bank SL.AGR.EMPL.ZS
How much sea is protected?
Protected sea moved from 0.4% to 0.5% across 12 recorded years.
World Bank ER.MRN.PTMR.ZS
How much land is farmed?
Agricultural land moved from 18.9% to 16.2% across 28 recorded years.
World Bank AG.LND.AGRI.ZS
How fast is it urbanising?
Urban population moved from 91.6% to 94.2% across 30 recorded years.
World Bank SP.URB.TOTL.IN.ZS
Is the air getting cleaner?
Air pollution moved from 6.2 µg/m³ to 4.9 µg/m³ across 28 recorded years.
World Bank EN.ATM.PM25.MC.M3
Is water getting scarcer?
Fresh water per person moved from 635590.1 m³ to 445022.7 m³ across 27 recorded years.
World Bank ER.H2O.INTR.PC
Is diet-related disease rising?
Adult overweight moved from 46.0% to 57.4% across 27 recorded years.
World Bank SH.STA.OWAD.ZS
Who has power?
Electricity access moved from 100.0% to 100.0% across 29 recorded years.
World Bank EG.ELC.ACCS.ZS
Is income rising?
GDP per person moved from 27565 to 98323 across 30 recorded years.
World Bank NY.GDP.PCAP.CD
How fast is it growing?
Population moved from 267k to 392k across 30 recorded years.
World Bank SP.POP.TOTL
What share of all energy is renewable?
Renewable energy use moved from 55.7% to 82.4% across 26 recorded years.
World Bank EG.FEC.RNEW.ZS
How much energy does one person use?
Energy per person moved from 8405 kg to 15997 kg across 29 recorded years.
World Bank EG.USE.PCAP.KG.OE
How much land and sea is protected together?
Protected area, total moved from 2.7% to 2.9% across 12 recorded years.
World Bank ER.PTD.TOTL.ZS
How long do people live?
Life expectancy moved from 77.98 yrs to 82.81 yrs across 29 recorded years.
World Bank SP.DYN.LE00.IN
How much does a hectare of cereal produce?
Cereal yield moved from 3187 kg/ha to 2430 kg/ha across 8 recorded years.
World Bank AG.YLD.CREL.KG
How much fertiliser goes on the land?
Fertiliser use moved from 144.9 kg/ha to 97.29 kg/ha across 28 recorded years.
World Bank AG.CON.FERT.ZS
How many people still live rurally?
Rural population moved from 8.36% to 5.78% across 30 recorded years.
World Bank SP.RUR.TOTL.ZS
How much value per cubic metre of water?
Water productivity moved from 58.19 $/m3 to 75.91 $/m3 across 27 recorded years.
World Bank ER.GDP.FWTL.M3.KD
How much goes on health?
Health spending moved from 8.9% to 8.98% across 24 recorded years.
World Bank SH.XPD.CHEX.GD.ZS
How much forest is there in total?
Forest area moved from 234.5 km2 to 533.13 km2 across 28 recorded years.
World Bank AG.LND.FRST.K2
How much electricity per person?
Electric power use moved from 17396 kWh to 48998 kWh across 29 recorded years.
World Bank EG.USE.ELEC.KH.PC
How have agriculture emissions moved?
Agriculture emissions moved from 0.7 to 0.59 MtCO2e across 33 recorded years.
Climate Watch (WRI), historical emissions
How have building emissions moved?
Building emissions moved from 0.05 to 0.01 MtCO2e across 33 recorded years.
Climate Watch (WRI), historical emissions
How have energy emissions moved?
Energy emissions moved from 1.93 to 1.58 MtCO2e across 33 recorded years.
Climate Watch (WRI), historical emissions
How have industrial processes emissions moved?
Industrial Processes emissions moved from 0.56 to 0.33 MtCO2e across 33 recorded years.
Climate Watch (WRI), historical emissions
How have manufacturing/construction emissions moved?
Manufacturing/Construction emissions moved from 0.55 to 0.07 MtCO2e across 33 recorded years.
Climate Watch (WRI), historical emissions
How have transportation emissions moved?
Transportation emissions moved from 0.64 to 0.96 MtCO2e across 33 recorded years.
Climate Watch (WRI), historical emissions
Worst caseCurrent pathBest case
Worst case
Every measured decline continues at the pace already recorded. The weakest pillar, food and farming at 2/5, is the one that gives way first.
Computed from: recorded series extended with no policy change
Current path
Every line above is a recorded World Bank series for this country. The current path is simply those series continuing at the pace already measured.
Computed from: recorded series, no policy change assumed
Best case
The pledges are met on their own stated timetables and the weakest pillars are lifted to match the strongest. Iceland already shows it can do this: water scores 5/5.
Computed from: each published target delivered on its own date
What the best case actually asks for
Lift food and farming
It scores 2 out of 5 today, among the weakest parts of Iceland's record. With little arable land, Iceland imports a large share of its food, especially grains, fruit and vegetables, though geothermal greenhouses grow tomatoes, cucumbers and herbs year round and the country is self sufficient in fish and lamb. Import dependence keeps the score low. Lifting it toward the 5/5 the strongest pillars already reach is what the best case turns on.
measured each year
Costs: spending and enforcement, not new technology
Lift organic farming
It scores 2 out of 5 today, among the weakest parts of Iceland's record. Only about 0.3% of agricultural land is certified organic (FiBL, 2020) and conversion is rare, placing Iceland in a low band, though a national plan targets 10% by 2040. Lifting it toward the 5/5 the strongest pillars already reach is what the best case turns on.
measured each year
Costs: spending and enforcement, not new technology
Lift wildlife
It scores 2 out of 5 today, among the weakest parts of Iceland's record. Iceland's terrestrial life is sparse, with the Arctic fox as the only native land mammal, no reptiles or amphibians and few endemics, but seabird colonies including puffins are spectacular and whales are common offshore. Diversity is naturally low. Lifting it toward the 5/5 the strongest pillars already reach is what the best case turns on.
measured each year
Costs: spending and enforcement, not new technology
Government and Goals in Iceland.
Who is in charge of Iceland now · Office-holders from the UN Protocol and Liaison Service public list of Heads of State and Heads of Government, 8 September 2026. Legislature and election dates from IFES ElectionGuide. Constitution dates from the Constitute Project. Governance scores from the World Bank Worldwide Governance Indicators 2024.
Kristrún Frostadóttir
Prime Minister
Kristrún Frostadóttir is the head of government of Iceland, in office since 21 December 2024. Every climate, protection and energy pledge on this page is delivered, or not, under this administration.
Public opinion, measured
Voice and accountability, the freedom to question government: 81.8 / 100. Among the strongest measured. World Bank WGI 2024
Control of corruption: 84.9 / 100. Among the strongest measured. World Bank WGI 2024
Political stability and absence of violence: 86.5 / 100. Among the strongest measured. World Bank WGI 2024
Rule of law: 85 / 100. Among the strongest measured. World Bank WGI 2024
Regulatory quality: 75.8 / 100. Among the strongest measured. World Bank WGI 2024
Kristrún FrostadóttirPrime Minister
Parliament (Althingi)Legislature, unicameral
Last election30 November 2024
Constitution1944, as revised to 2013
Government typeunitary parliamentary republic
Iceland national goals: climate commitments on record · as recorded by Climate Watch, World Resources Institute
2040
Net zero
In Law<br>In Policy Document
Net-zero target as recorded by Climate Watch. Status: In Law (6/25/2021) In Policy Document (10/28/2021, 2/18/2021) ↗
The questions people actually type, answered in full sentences from the sourced data above.
swipe →
Is Iceland sustainable?
Iceland scores 65 out of 100 on the Throne Eco Index, across twelve equally weighted pillars. Iceland runs on almost entirely renewable electricity and pours the purest tap water in the world, yet imports much of its food and still permits commercial whaling.
Is the water in Iceland safe and plentiful?
Iceland has enormous freshwater abundance from glaciers, springs and groundwater, and 100% of people have safely managed drinking water (World Bank, 2020). The tap water is among the purest in the world and safe to drink everywhere.
Can Iceland feed itself?
With little arable land, Iceland imports a large share of its food, especially grains, fruit and vegetables, though geothermal greenhouses grow tomatoes, cucumbers and herbs year round and the country is self sufficient in fish and lamb. Import dependence keeps the score low.
Is it easy to eat plant-based in Iceland?
Traditional Icelandic food is dominated by fish, lamb and dairy such as skyr, and local plant production is limited, but geothermal greenhouse produce and a strong Reykjavik vegan scene make plant based eating workable.
How much of Iceland is actually protected?
Protected areas cover 20.9% of the land (World Bank, 2024), including the huge Vatnajokull National Park, with strong enforcement, but only 0.4% of territorial waters are protected (World Bank, 2021) despite vast fishing grounds. Land protection is strong and marine protection weak.
What wildlife is left in Iceland?
Iceland's terrestrial life is sparse, with the Arctic fox as the only native land mammal, no reptiles or amphibians and few endemics, but seabird colonies including puffins are spectacular and whales are common offshore. Diversity is naturally low.
Is Iceland on clean energy?
Iceland's grid is essentially 100% renewable, with roughly 70% from hydropower and 30% from geothermal energy, and geothermal also heats most homes. Its territorial CO2 emissions are nonetheless high at about 9.7 tonnes per person in 2024 (Our World in Data, Global Carbon Project), driven by energy-intensive aluminium smelting and the fishing fleet rather than the power grid. The country targets carbon neutrality by 2040 and hosts pioneering carbon-mineralisation projects such as Carbfix.
How polluted is Iceland?
Air is among the cleanest in Europe, with a PM2.5 annual mean around 6 micrograms per cubic metre (World Bank, 2017), close to WHO guidance apart from occasional volcanic and dust events, and litter is low. Certain single use plastics were banned in 2021 in line with the EU directive.
Does recycling work in Iceland?
A deposit return scheme recovers the great majority of drinks containers, but overall municipal recycling is moderate and a significant share of waste is landfilled or exported. Recovery sits in the middle band.
Is the farming in Iceland organic?
Only about 0.3% of agricultural land is certified organic (FiBL, 2020) and conversion is rare, placing Iceland in a low band, though a national plan targets 10% by 2040.
Are there natural materials and craft in Iceland?
Iceland keeps a genuinely living wool tradition, with Icelandic sheep wool spun into lopi and hand knitted into lopapeysa sweaters that are still made and worn. It is a single strong fibre culture rather than a diverse one.
Is there living culture in Iceland?
Iceland has a strong national identity rooted in the sagas and its language, and tourism is well regulated, but there is no indigenous minority and headline sites such as the Blue Lagoon are highly commercial. Community benefit is decent but tourism is a dominant industry.
What heritage does Iceland keep alive?
Iceland's living heritage centres on the sagas and a strong oral and literary storytelling culture, alongside rimur, the chanted epic-verse tradition, and kvaedaskapur. Older ring dances such as the vikivaki survive in revived form, and the pre-Christian Norse spiritual path has been revived as Asatru, a recognised living religion. Ancestral belief in the huldufolk, the hidden people or elves, remains part of everyday cultural life.
So is Iceland actually green? The measured answer
What is working: renewable electricity at 100%.
What is not: sea protected at 0.5% against a 30% mark.
Iceland sits 48 of 77 at 65/100. Every name links to its own destination page, built exactly like this one. The full ranking →
What is Iceland particularly good at?
✓Energy, scored 5/5. Iceland's grid is essentially 100% renewable, with roughly 70% from hydropower and 30% from geothermal energy, and geothermal also heats most homes. Its territorial CO2 emissions are nonetheless high at about 9.7 tonnes per person in 2024 (Our World in Data, Global Carbon Project), driven by energy-intensive aluminium smelting and the fishing fleet rather than the power grid. The country targets carbon neutrality by 2040 and hosts pioneering carbon-mineralisation projects such as Carbfix. On the clean-power measure that anchors this pillar it is a clear leader.
✓Water, scored 5/5. Iceland has enormous freshwater abundance from glaciers, springs and groundwater, and 100% of people have safely managed drinking water (World Bank, 2020). The tap water is among the purest in the world and safe to drink everywhere.
✓Conservation, scored 4/5. Protected areas cover 20.9% of the land (World Bank, 2024), including the huge Vatnajokull National Park, with strong enforcement, but only 0.4% of territorial waters are protected (World Bank, 2021) despite vast fishing grounds. Land protection is strong and marine protection weak.
Where does Iceland score worst?
✕Food and farming, scored 2/5. With little arable land, Iceland imports a large share of its food, especially grains, fruit and vegetables, though geothermal greenhouses grow tomatoes, cucumbers and herbs year round and the country is self sufficient in fish and lamb. Import dependence keeps the score low.
✕Organic farming, scored 2/5. Only about 0.3% of agricultural land is certified organic (FiBL, 2020) and conversion is rare, placing Iceland in a low band, though a national plan targets 10% by 2040.
✕Wildlife, scored 2/5. Iceland's terrestrial life is sparse, with the Arctic fox as the only native land mammal, no reptiles or amphibians and few endemics, but seabird colonies including puffins are spectacular and whales are common offshore. Diversity is naturally low.
Similar countries doing it better and worse
FranceScored on the same twelve pillars as Iceland.78
SwitzerlandScored on the same twelve pillars as Iceland.75
GermanyScored on the same twelve pillars as Iceland.75
United KingdomScored on the same twelve pillars as Iceland.65
MontenegroScored on the same twelve pillars as Iceland.62
SerbiaScored on the same twelve pillars as Iceland.58
A note from the lens of mother natureswipe →
Energy, 5/5
Iceland's grid is essentially 100% renewable, with roughly 70% from hydropower and 30% from geothermal energy, and geothermal also heats most homes. Its territorial CO2 emissions are nonetheless high at about 9.7 tonnes per person in 2024 (Our World in Data, Global Carbon Project), driven by energy-intensive aluminium smelting and the fishing fleet rather than the power grid.
Food and farming, 2/5
With little arable land, Iceland imports a large share of its food, especially grains, fruit and vegetables, though geothermal greenhouses grow tomatoes, cucumbers and herbs year round and the country is self sufficient in fish and lamb. Import dependence keeps the score low.
Consequence: It is the lowest-scoring part of Iceland's record, so it is where the score moves first.
Heritage, 3/5
Iceland's living heritage centres on the sagas and a strong oral and literary storytelling culture, alongside rimur, the chanted epic-verse tradition, and kvaedaskapur. Older ring dances such as the vikivaki survive in revived form, and the pre-Christian Norse spiritual path has been revived as Asatru, a recognised living religion.
The Iceland Directory.
Everything on Hold The Throne that sits in Iceland, checked and listed.
World Bank Worldwide Governance Indicators, 2024. Percentile among all governments measured.
Government effectiveness
83.3 / 100
World Bank Worldwide Governance Indicators, 2024. Percentile among all governments measured.
Rule of law
85 / 100
World Bank Worldwide Governance Indicators, 2024. Percentile among all governments measured.
Political stability
86.5 / 100
World Bank Worldwide Governance Indicators, 2024. Percentile among all governments measured.
Voice and accountability
81.8 / 100
World Bank Worldwide Governance Indicators, 2024. Percentile among all governments measured.
Environmental Performance Index
64.3 / 100 · 19 of 180
Yale Environmental Performance Index 2024, ranked 19 of 180 countries assessed.
Ecosystem vitality
60.4 / 100 · 46 of 180
Yale Environmental Performance Index 2024, ranked 46 of 180 countries assessed.
Biodiversity and habitat
54.8 / 100 · 65 of 180
Yale Environmental Performance Index 2024, ranked 65 of 180 countries assessed.
Air pollution
89.8 / 100 · 27 of 180
Yale Environmental Performance Index 2024, ranked 27 of 180 countries assessed.
Terrestrial biomes protected
47.6 / 100 · 98 of 180
Yale Environmental Performance Index 2024, ranked 98 of 180 countries assessed.
Marine protected areas
40.9 / 100 · 112 of 131
Yale Environmental Performance Index 2024, ranked 112 of 131 countries assessed.
How Iceland Is Scored. The Throne Standard.
Every destination on the index is scored the same way, so a 4 in Barbados means exactly what a 4 means in Iceland. No self-declared data and no brochure claims are accepted. Every figure on this page carries its named source and year, and the history on each page names what empire took as plainly as it scores the present.
The 12 pillars every destination is scored on, equally weighted
01
Conservation
Land and sea actually protected, not pledged
02
Wildlife
What survives, what is endemic, what is lost
03
Water
Fresh water per person, and the ocean’s health
04
Food & farming
Whether the place can feed itself
05
Organic & clean
Certified land and pesticide reality
06
Climate & energy
Emissions per person, how the grid is powered
07
Waste
Where the rubbish goes, what comes back
08
Health
What people eat and die of
09
Heritage
Living culture, and what the law keeps standing
10
Ownership
Who owns the economy, how much of a dollar stays
11
Governance
Freedom, honesty, promises kept
12
Future
Measured trends run forward, pledges against pace
What each 0 to 5 pillar score means, in plain words
The institutions above are the ones cited on this page, ranked by how many of its figures they carry. This same sectioned page renders for all 77 scored destinations, each with its own researched history, comparison charts and three-way future. Read the full methodology
Every figure on this page, and where it came from: 87 sources across 33 institutions
World Bank17 FIGURES
Forest area (% of land area, AG.LND.FRST.ZS), 2023. check
Terrestrial protected areas (% of land area, ER.LND.PTLD.ZS), 2024. check
Marine protected areas (% of territorial waters, ER.MRN.PTMR.ZS), 2021. check
safely managed drinking water (SH.H2O.SMDW.ZS), 2020. check
PM2.5 mean annual exposure (EN.ATM.PM25.MC.M3), 2017. check
Threatened species (mammals EN.MAM.THRD.NO, birds EN.BIR.THRD.NO, fish EN.FSH.THRD.NO, higher plants EN.HPT.THRD.NO), 2022 check
Renewable electricity output (% of total) EG.ELC.RNEW.ZS, 2016 check
CO2 emissions per capita EN.GHG.CO2.PC.CE.AR5, 2024 check
North Atlantic Right Whale (Eubalaena glacialis), assessed 2020, Critically Endangered on the IUCN Red List, and recorded in Iceland in GBIF occurrence data (mammal). check
North Atlantic Right Whale (Eubalaena glacialis), assessed 2020 corroboration check
North Atlantic Right Whale (Eubalaena glacialis), assessed 2020 corroboration check
Common Blue Skate (Dipturus batis), assessed 2021, Critically Endangered on the IUCN Red List, and recorded in Iceland in GBIF occurrence data (shark or ray). check
Common Blue Skate (Dipturus batis), assessed 2021 corroboration check
Common Blue Skate (Dipturus batis), assessed 2021 corroboration check
Roundnose Grenadier (Coryphaenoides rupestris), assessed 2012, Critically Endangered on the IUCN Red List, and recorded in Iceland in GBIF occurrence data (species). check
official introductory booklet, 2024 edition, An assembly was founded at Thingvellir in 930, among the oldest parliamentary institutions in the world. check
official introductory booklet, 2024 edition corroboration check
official introductory booklet, 2024 edition corroboration check
official introductory booklet, 2024 edition corroboration check
official introductory booklet, 2024 edition corroboration check
UNESCO Institute for Statistics5 FIGURES
public data API (indicator XGDP.FSGOV), Public spending on education runs at 7.3% of GDP and 15.7% of all government spending, and secondary enrolment check
public data API (indicator XGDP.FSGOV) corroboration check
public data API (indicator XGDP.FSGOV) corroboration check
public data API (indicator XGDP.FSGOV) corroboration check
public data API (indicator XGDP.FSGOV) corroboration check
IUCN4 FIGURES
Red List Categories and Criteria: Version 3.1, Second edition (2012), Section IV 'The Categories', Critically Endangered, the last IUCN category before Extinct in the Wild, and still recorded in Iceland. check
Red List Categories and Criteria: Version 3.1, Second edition (2012), Section IV 'The Categories' corroboration check
Red List Categories and Criteria: Version 3.1, Second edition (2012), Section IV 'The Categories' corroboration check
Red List Categories and Criteria: Version 3.1, Second edition (2012), Section IV 'The Categories' corroboration check
Stjórnarráð Íslands (Government of Iceland)4 FIGURES
'Bann við algengum einnota plastvörum tekur gildi', 3 July 2021, Yes; single use plastics were banned in 2021 in line with the EU directive check
'Bann við algengum einnota plastvörum tekur gildi', 3 July 2021 corroboration check
'Bann við algengum einnota plastvörum tekur gildi', 3 July 2021 corroboration check
'Bann við algengum einnota plastvörum tekur gildi', 3 July 2021 corroboration check
BirdLife International, IUCN and UNEP-WCMC3 FIGURES
UN SDG Global Database, terrestrial Key Biodiversity Areas covered by protected areas (%) ER_PTD_TERR, Iceland, 2025 (19.6%), country-reported check
UN SDG Global Database, marine Key Biodiversity Areas covered by protected areas (%) ER_MRN_MPA, Iceland, 2025 (16.1%), country-reported check
UN SDG Global Database, freshwater Key Biodiversity Areas covered by protected areas (%) ER_PTD_FRHWTR, Iceland, 2025 (35.9%), country-reported check
Eurostat3 FIGURES
UN SDG Global Database, electronic waste recycled (%) EN_EWT_RCYR, Iceland, 2018 (90.4%), country-reported check
recycling rate of municipal waste (cei_wm011) check
municipal waste by treatment operation (env_wasmun) check
FAO, Global Forest Resources Assessment3 FIGURES
UN SDG Global Database, forest area (% of land area) AG_LND_FRST, Iceland, 2025 (0.61%), country-reported check
UN SDG Global Database, forest area under a long-term management plan (%) AG_LND_FRSTMGT, Iceland, 2025 (96.3%), country-reported check
UN SDG Global Database, forest area inside legally established protected areas (%) AG_LND_FRSTPRCT, Iceland, 2025 (3.0%), country-reported check
IUCN Red List / BirdLife International3 FIGURES
Balearic Shearwater (Puffinus mauretanicus), assessed 2018, Critically Endangered on the IUCN Red List, and recorded in Iceland in GBIF occurrence data (bird). check
Kunming-Montreal Global Biodiversity Framework, Target 3 guidance note, The 30x30 target is 30% by 2030, so 29.5 percentage points are still to be designated. check
Kunming-Montreal Global Biodiversity Framework, Target 3 guidance note corroboration check
FAO2 FIGURES
FAOSTAT Production: Crops and Livestock Products, Europe bulk dataset (release December 2025), By tonnage, the largest crops grown in Iceland are potatoes, barley, cucumbers and gherkins, tomatoes and carr check
FAOSTAT Production: Crops and Livestock Products, Europe bulk dataset (release December 2025) corroboration check
Other published sources2 FIGURES
Nine named single use plastic items plus oxo-degradable plastic banned from 3 July 2021; cups and food containers remain legal but must be charged for check
Natturufraedistofnun Islands (Icelandic Institute of Natural History), species page for slettbakur, Eubalaena glacialis, Eubalaena glacialis range check
Conservation status of the threatened, insular San Jose brush rabbit (Sylvilagus mansuetus), Western North American Naturalist 71(1), Sylvilagus mansuetus range check

 FranceScored on the same twelve pillars as Iceland.78
 SwitzerlandScored on the same twelve pillars as Iceland.75
 GermanyScored on the same twelve pillars as Iceland.75
 United KingdomScored on the same twelve pillars as Iceland.65
 MontenegroScored on the same twelve pillars as Iceland.62
 SerbiaScored on the same twelve pillars as Iceland.58