Destinations › Europe · The Destination Index · universal template · every figure sourced
Netherlands.
Western Europe, bordering the North Sea, between Belgium and Germany. 41,543 sq km and 18,087,633 people, 451 km of coastline, temperate; marine; cool summers and mild winters.
Region · EuropePopulation · ~18,087,633Languages · Dutch, West Frisian (official in Fryslan), with Turkish, Arabic and PapiamentoEco Index · 70/100 · Passable
The Eco Index across 12 pillars · scored 0 to 5 · World Bank, OWID, WHO/UNICEF JMP, FiBL, Protected Planet, IUCN, UNESCO (2023-24)
Conservation
Wildlife
Water
Food & farming
Organic & clean
Climate & energy
Waste
Health
Heritage
Ownership
Governance
Future
The History of the Netherlands.
The Netherlands is a highly secular and modernised society, and its distinctive living folk heritage is more limited than in many countries, though real traditions endure. The Sinterklaas celebration remains a major living custom, and the Catholic south sustains a vibrant regional Carnaval in Limburg and Brabant.
Where the name comes from
Nederland, 'low country', for land much of which sits at or below sea level. Source: UK Permanent Committee on Geographical Names toponymic factfile.
The land itself: coastal lowland and reclaimed polder, with modest hills in the south east. Its high point is Vaalserberg, 322 m, though the highest point in the Kingdom is Mount Scenery on Saba in the Caribbean, 887 m. Source: UK Permanent Committee on Geographical Names toponymic factfile.
Where it starts
The oldest boat in the world
A Neanderthal skull fragment dredged from the North Sea floor, from land now beneath the water, is the first Neanderthal found in the Netherlands. The Pesse canoe, cut from a Scots pine and preserved in a peat bog, dates to between 8250 and 7550 BC and is the oldest boat found anywhere in the world. From around 3400 BC the first farmers of northern Europe raised the hunebedden, of which 54 survive, 52 in Drenthe and 2 in Groningen.
How it got here
Water, trade, and the reckoning
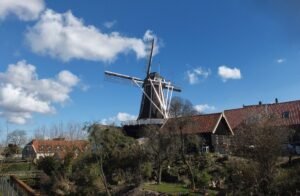
The Rhine became the northern edge of the Roman world. From around 1000 dykes, terps and windmills turned flood defence into a national craft and land was taken back from the sea. Eighty years of war from 1568 ended Spanish rule and established an independent republic. In the seventeenth century Dutch companies built trading empires in Asia, Africa and the Americas, and the Netherlands became a major carrier in the Atlantic slave trade, abolished in its colonies in 1863. The North Sea flood of 1953 killed more than 1,800 people and led to the Delta Works. In 2022 the Dutch state apologised for its role in slavery.
The timeline
c. 50,000 to 70,000 years ago
Krijn.
A Neanderthal skull fragment dredged from the North Sea floor, from land now beneath the water, is the first Neanderthal found in the Netherlands. ↗
c. 8250 to 7550 BC
The Pesse canoe.
A dugout cut from a Scots pine and preserved in a peat bog is the oldest boat found anywhere in the world. ↗
c. 3400 to 2850 BC
The hunebedden.
54 megalithic tombs built by the first farmers of northern Europe survive in Drenthe and Groningen. ↗
c. 12 BC to AD 400s
The Rhine frontier.
The Rhine becomes the northern edge of the Roman world, with Batavian and Frisian peoples on both sides. ↗
c. 1000 onward
Water as engineering.
Dykes, terps and windmills turn flood defence into a national craft, and land is taken back from the sea. ↗
1568 to 1648
The Dutch Revolt.
Eighty years of war end Spanish rule and establish an independent republic. ↗
1600s
Trade, empire and slavery.
Dutch companies build trading empires in Asia, Africa and the Americas, and the Netherlands becomes a major carrier in the Atlantic slave trade, abolished in its colonies in 1863. ↗
1953
The North Sea flood.
A storm surge kills more than 1,800 people and leads to the Delta Works. ↗
2022
State apology.
The Dutch state apologises in 2022 for its role in slavery, part of a longer public reckoning with how that history is commemorated. ↗
Natura 2000 covers about 9% of the land surface and about 26% of coastal and marine waters, rising to 20% of land and 31% of marine waters once the national ecological network and marine strategy areas are counted (Compendium voor de Leefomgeving, 2024), with strong governance and the Wadden Sea recognised as a UNESCO World Heritage site. Rewilding experiments such as Oostvaardersplassen have been influential though controversial.
Is wild Netherlands protected? 22.9% of the land is, against a 30% target for 2030
How protected is nature in Netherlands?
Forest cover11.1%
Terrestrial protected area22.9%
Marine protected area33.5%
39 (mammals, birds, fish & plants) listed as threatened.
Found only here. Few endemics, but the Wadden Sea's seals and internationally important migratory bird flocks.
The watchlist
ThreatenedConey (Oryctolagus cuniculus)Assessed as Endangered on the IUCN Red List, with wild occurrence records for the Netherlands in GBIF.
ThreatenedOxyura leucocephalaAssessed as Endangered on the IUCN Red List, with wild occurrence records for the Netherlands in GBIF.
ThreatenedGwynne's Mining Bee (Andrena bicolor)Not evaluated on the IUCN Red List (version 2026-1), and recorded in Netherlands in GBIF occurrence data (insect).
ThreatenedBittercress (Barbarea vulgaris)Not evaluated on the IUCN Red List (version 2026-1), and recorded in Netherlands in GBIF occurrence data (plant).
ThreatenedBigtree (Sequoiadendron giganteum)Assessed as Endangered on the IUCN Red List, with occurrence records for the Netherlands in GBIF, which for conifers are usually planted rather than wild.
ThreatenedAnguilla anguillaAssessed as Critically Endangered on the IUCN Red List, with wild occurrence records for the Netherlands in GBIF.
ThreatenedOsetr (Acipenser gueldenstaedtii)Assessed as Critically Endangered on the IUCN Red List, with wild occurrence records for the Netherlands in GBIF.
ThreatenedUnio crassusAssessed as Endangered on the IUCN Red List, with wild occurrence records for the Netherlands in GBIF.
Critically Endangered, the last IUCN category before Extinct in the Wild, and still recorded in the wild in the Netherlands. GBIF holds 66 verified occurrence records.
Osetr (Acipenser gueldenstaedtii)
Critically Endangered, the last IUCN category before Extinct in the Wild, and still recorded in the wild in the Netherlands. GBIF holds 1 verified occurrence records.
Species named here are drawn from GBIF occurrence records for Netherlands filtered to the IUCN Red List threatened categories. Species are listed where GBIF holds occurrence records for them in this country. Record counts are not published here because the figure cannot be reproduced from a public GBIF query.
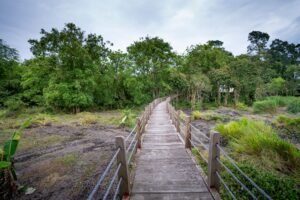
National park, mapped and named in the open record for Netherlands. OpenStreetMap.
Water and Ocean in the Netherlands.
The Netherlands draws on the Rhine and Meuse rivers, dune-filtered groundwater and the IJsselmeer freshwater lake, managed by some of the world's most advanced flood and water engineering. Tap water is excellent and served without chlorine, and about 99.97% of people use safely managed drinking water (World Bank, 2020).
Does the Netherlands have enough fresh water? Under pressure
100% of people here have safely managed drinking water at home (2024, WHO/UNICEF JMP). Tap water is safe for a visitor nearly everywhere.
Cleanest water: The Veluwe and the Wadden Sea.
How much fresh water does the Netherlands have, per person?
621 m³
Netherlands
1,000 m³
the UN “water scarce” line
Netherlands withdraws about 8,234 million cubic metres of fresh water a year (2022). That is 16.7% of the fresh water actually available to it, which FAO counts as low water stress. Of what is taken, farming takes 3%, homes and towns 27%, industry 70%. Source: FAO AQUASTAT.
What are the rules on Netherlands beaches?
✓Tap water: Drinkable.
✓Plastic rules: Plastic-bag charge since 2016 and a deposit-return scheme on bottles and cans..
✓Solo travel: rated easy on the record for this destination.
✕Marine protection: 26.9% of the sea is protected. The 30x30 pledge for 2030 is not met yet.
Named on the open map: Boca Catalina Beach, Boka Sami Beach, Cabana Beach, Chachacha Beach, Hadicurari Beach, Hemingway Beach, Jan Thiel Beach, LionsDive Beach. That is 12 named beaches in the public record for Netherlands, each one a place you can look up before you go. OpenStreetMap.
Where does the sewage go?
97.5%
of people have safely managed sanitation
97.5% of people here use a safely managed sanitation service, meaning waste is contained, emptied and treated rather than reaching the ground or the sea untreated (2024, World Bank / WHO-UNICEF JMP, SDG 6.2.1). That is close to universal coverage.
How is the sea around Netherlands doing?
One cross-section, every answer measured.
Surface
What the coast carries
Mild maritime climate; wind is a daily reality and the coast is cool even in July.
Nearshore
Protected water
33.5% of territorial waters are protected, against the 30% pledged for 2030 under the Global Biodiversity Framework.
Cleanest
Where the water is cleanest
The Veluwe and the Wadden Sea..
The record
Measured
The Netherlands draws on the Rhine and Meuse rivers, dune-filtered groundwater and the IJsselmeer freshwater lake, managed by some of the world's most advanced flood and water engineering. Tap water is excellent and served without chlorine, and about 99.97% of people use safely managed drinking water (World Bank, 2020).
Sea protected
26.9%
Against the 30% pledged for 2030 under the Global Biodiversity Framework.
Threatened species
39 (mammals, birds, fish & plants)
Mammals, birds, fish and higher plants on the IUCN list.
Cleanest water
here
The Veluwe and the Wadden Sea..
Is the tap water safe in Netherlands?
100% of people have safely managed drinking water at home (2024, WHO/UNICEF JMP). Renewable fresh water works out at about 621 cubic metres per person a year (World Bank).
How hard is the water supply being pushed?
Of every 10 buckets nature refills, 2 are already taken. Withdrawals run at 16.7% of what the Netherlands renews internally each year (2022, World Bank / FAO AQUASTAT). That is inside the 25% mark generally treated as water stress, so the supply has headroom.
When is the best time to visit Netherlands? Tap your month.
Tap your month.
JanFebMarAprMayJunJulAugSepOctNovDec
.
How much fresh water does Netherlands actually have?
Nature renews about 621 cubic metres of fresh water per person per year here. That ranks the Netherlands 37 of 208 countries measured, placing it among the 40 driest countries on Earth per person. The UN treats anything under 1,000 cubic metres as water scarce, and this is below that line. World Bank / FAO AQUASTAT.
The Netherlands is one of the world's largest food exporters by value, with intensive high-yield horticulture, glasshouse growing and dairy, though it relies on imported animal feed and tropical produce and faces a serious nitrogen-pollution crisis from farming intensity.
Where does the food in Netherlands come from?
13.3% imported
about US$115,518m a year
On the plate: Potatoes, bread, seasonal vegetables.
How often each food is on the plate
Share of people eating each one regularly. These overlap, so they do not add up to 100%.
Potatoes60%
Bread33%
Seasonal vegetables24%
Herring15%
1 of 10
bites are imported
The island buys in more food energy than it eats. About US$115,518m a year leaves the country to pay for it. The green slice is roughly what still grows here.
About 13.3% of everything the Netherlands buys in from abroad is food, roughly 1 in every 10 imported items on the dock (2024, World Bank). Farming itself is 1.7% of the economy and 53.5% of the land is agricultural, of which 30% is arable. The green slice is roughly what still grows here.
What is killing people in the Netherlands? The imported diet.
Cause of death, and the diet behind it.
Non-communicable diseases, all combined78.2%
Diabetes5%
Adults living with overweight or obesity. 45.9%.
Can the Netherlands feed itself?
30.0%
Arable land
53.6%
Agricultural land
176,331
Farmers
2,493,289
Arable acres
1.7%
Agriculture, share of GDP
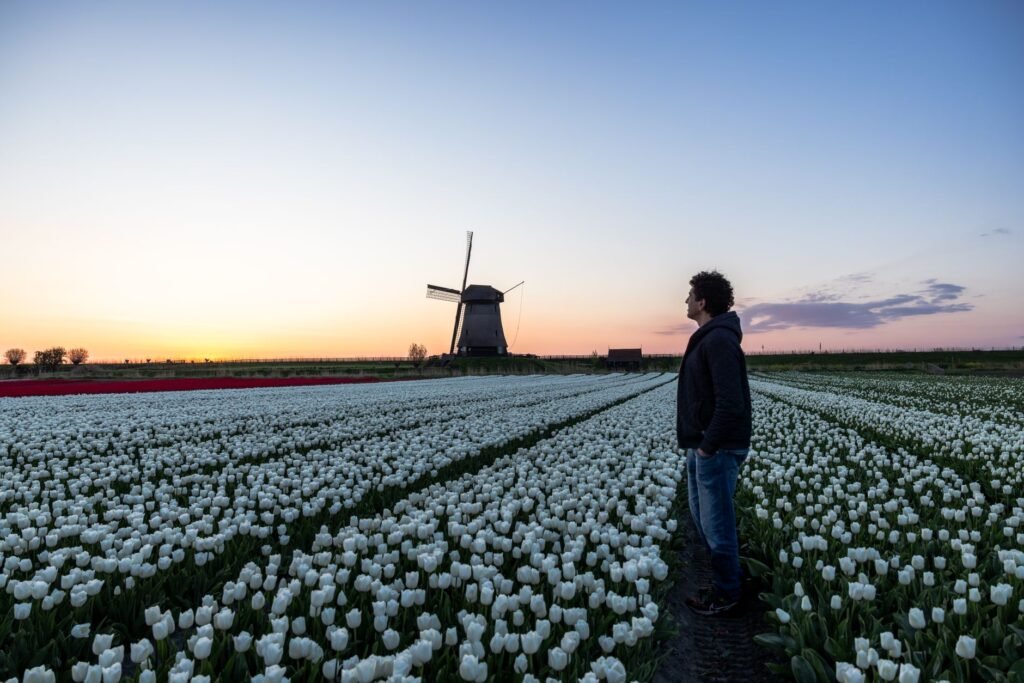
Harvest: Field vegetables and fruit from summer into autumn, tulip bloom mid-April to early May.
Feeding itself
The Netherlands is one of the world's largest food exporters by value, with intensive high-yield horticulture, glasshouse growing and dairy, though it relies on imported animal feed and tropical produce and faces a serious nitrogen-pollution crisis from farming intensity.
Certification
Organic farming covers about 5.1% of agricultural land (Eurostat, 2024), below the EU average and the EU target of 25% by 2030, but a real and certified sector.
Water for crops
The Netherlands draws on the Rhine and Meuse rivers, dune-filtered groundwater and the IJsselmeer freshwater lake, managed by some of the world's most advanced flood and water engineering. Tap water is excellent and served without chlorine, and about 99.97% of people use safely managed drinking water (World Bank, 2020).
Why the organic number looks like that. Certified-organic farmland is not separately reported for the Netherlands, and that is a certification gap rather than proof nothing is grown cleanly. What the official land record does show: 53.5% of the country is agricultural land and 30% is arable (2023, World Bank). Certification is paid for per farm per year by a foreign body, which prices out smallholders, so the organic number reads worse than the practice.
The plant-based kitchen here is not an import. By tonnage, the largest crops grown in Netherlands are potatoes, sugar beet, onions and shallots and tomatoes (FAO, FAOSTAT crop production, 2024). That is what the land itself puts on a plate.
Buy direct where residents buy: Bos en Lommerplein markt, Grote Markt, Lonneker Markt, Maandag & Zaterdag Markt, Markt Anton de Komplein, Markt Hoofddorp Overbos. Each is a mapped, named marketplace, so the money stays with the seller rather than the importer. OpenStreetMap.
The Netherlands has cut emissions substantially but remains a relatively high emitter at about 6.3 tonnes per person in 2024, a legacy of its industry, dense population and long dependence on Groningen natural gas. Renewables now supply close to half of electricity, around 46 per cent in 2023, led by rapidly expanding offshore wind and solar. The country has a binding Climate Act targeting net zero by 2050 and a coal phase-out, and electricity-sector emissions are falling quickly. Emissions per person nonetheless sit in the mid range and the wider economy is still carbon-intensive. Strong policy and rising renewables are offset by continued mid-level emissions.
What powers the Netherlands?
Renewable 51.2%Fossil 45.9%
Climate pollution per person
The safe amount, what the planet can absorb
2 tonnes
One person here
6.6 tonnes
The world average, for comparison
4.7 tonnes
The worst it ever got
12.1 tonnes
The grid
The Netherlands has cut emissions substantially but remains a relatively high emitter at about 6.3 tonnes per person in 2024, a legacy of its industry, dense population and long dependence on Groningen natural gas. Renewables now supply close to half of electricity, around 46 per cent in 2023, led by rapidly expanding offshore wind and solar.
Pollution
A plastic-bag charge has applied since 2016 and a deposit-return scheme now covers bottles and cans, and air is relatively clean at about 9.7 micrograms per cubic metre PM2.5 (IQAir, 2025), though intensive livestock farming drives heavy ammonia and nitrogen pollution.
Water stress
The Netherlands draws on the Rhine and Meuse rivers, dune-filtered groundwater and the IJsselmeer freshwater lake, managed by some of the world's most advanced flood and water engineering. Tap water is excellent and served without chlorine, and about 99.97% of people use safely managed drinking water (World Bank, 2020).
What pollutes most here
1The gridThe share of electricity still generated from fossil fuel.49%
2IndustryIntensive livestock farming (nitrogen) and the Rotterdam petrochemical cluster..named
3AirModelled annual mean against a WHO guideline of 5 µg/m³.9.7
4On the recordA plastic-bag charge has applied since 2016 and a deposit-return scheme now covers bottles and cans, and air is relatively clean at about 9.7 micrograms per cubic metre PM2.5 (IQAir, 2025), though intensive livestock farming drives heavy ammonia and nitrogen pollution.
What has the Netherlands promised on climate?
Net zero, whole economy2050
Electricity renewable today33.1% (2021)
Land protected, against a 30% target22.9% by 2025
Sea protected, against a 30% target33.5% by 2025
The net-zero target year on file with Climate Watch is 2050, status: in law. Measured against it, 33.1% of electricity is already renewable (2021, World Bank), so 66.9% of the grid is still to be converted. The pledge on file is measured here against what has actually been delivered, not taken on its own (UNFCCC NDC Registry, CBD Kunming-Montreal Target 3).
The biggest line item
One return flight against a whole year of living.
A resident's entire year6.6 t CO2e
Safe-climate budget, per year2 t CO2e
Sydney return, economy3 t CO2e
Singapore return, economy1.89 t CO2e
Johannesburg return, economy1.63 t CO2e
Los Angeles return, economy1.61 t CO2e
New York return, economy1.06 t CO2e
How much CO2 does flying to the Netherlands emit?
Tap where you would fly from. One return flight, economy.
Every prompt runs on a machine in a building on somebody’s grid. What that costs the planet depends less on the prompt than on what is burning to power it. Here is what would power one in the Netherlands.
Data centres
162
Registered colocation and interconnection facilities, PeeringDB, 2026
Grid renewable
51.2 %
What a machine here runs on.
What powers a data centre in the Netherlands?
A machine here runs mostly on renewables, but not entirely.
Renewable 51.2%Fossil 48.8%
Cooling water. Every one of those halls runs on the national grid, which is 33.1% renewable today (World Bank). A data centre is only as clean as the electricity behind it, so the same figure that decides this country's climate score also decides the footprint of the AI running inside it. Cooling water use is not separately published by facility, and no operator here reports it.
The rules. Netherlands has 162 colocation and interconnection facilities on the public PeeringDB register, concentrated in Amsterdam (37), Rotterdam (10), Eindhoven (6), alongside 34 internet exchanges (AMS-IX, NL-ix, NDIX, R_iX). Named sites include NIKHEF Amsterdam, Digital Realty AMS17 - Amsterdam, Equinix AM7 - Amsterdam, Kuiperberweg, Global Switch Amsterdam.
Where the cables land. 8 landing points · Beverwijk, Callantsoog, Domburg, Eemshaven
47% residents to 53% visitors across a year. 20,129,000 international arrivals in 2019 against 18,087,633 people who live here (2025, World Bank / UN Tourism).
Where a visitor dollar goes in Netherlands
7,265k
Visitors a year
0.4
Visitors per resident
How deep in debt is the Netherlands?· for every $100 the Netherlands earns in a year, it owes…
Pay to the order of: the creditorsmemo · the 1993 peak
$ 77The worst year on the IMF record. The Netherlands owed $77 for every $100 it earned.
IMF World Economic Outlook, 1993signed, the creditors
Pay to the order of: the creditorsmemo · today
$ 44What is owed now, for every $100 of national income (2026).
IMF World Economic Outlook, 2026signed, the creditors
Pay to the order of: the creditorsmemo · projected 2031
$ 48The IMF's own forecast has this rising to $48 by 2031.
IMF World Economic Outlook projection, 2031signed, the forecast
For every $100 the Netherlands earns in a year, it owes $44 (2026, IMF World Economic Outlook). The interest on that is paid before schools, clinics or coastline get their turn.
Where does a tourist dollar actually go in the Netherlands?
Play one tourist dollar around the board. Every square is a measured fact from this page.
START!
1
GO: a visitor lands
$100 goes on the table. 20,129,000 international arrivals in 2019 against 18,087,633 residents, 1.1 visitors for every resident (World Bank / UN Tourism).
$100 in play
2
The bed
Who owns the largest places to stay in the Netherlands is not published in the records we can check, so this square is left open rather than guessed. Where a listing names its owner, it is shown in the ownership table below.
not published
3
The plate
Food is only 13.3% of everything the Netherlands imports (2024, World Bank), so most of a meal is bought from producers inside the country. Eating what the land here actually grows, sugar beets, potatoes, onions, wheat, tomatoes, carrots/turnips, keeps that money with the grower.
mostly home-grown
4
The power
66.9% of the electricity is fossil (2021, World Bank). Lighting, cooling and hot water are paid for largely in imported fuel.
burns away
5
What actually stays
On the parts that can be measured, the power leaves and the plate stays. It is genuinely a coin toss, decided by what you book.
split
6
Pay the bank first
The Netherlands owes $44 for every $100 it earns (IMF World Economic Outlook, 2026 projection). The interest is paid before anything else on this board.
$44 per $100
7
A spread hand
The largest single export is machinery and mechanical appliances at 14.4% of the total, with mineral fuels and oils second at 13.1% (2025, UN Comtrade). No one shock can take the whole board.
top export 18.0%
8
Community chest
Tourism earns 1.4% of everything the Netherlands makes from exports (2020, World Bank / UN Tourism). That is how much of the economy depends on the game continuing.
1.4% of exports
9
The flight
Getting here is usually the biggest single line on the bill. From Sydney a return economy seat is 3.00 t CO2, on the UK Government's published conversion factors. It is the one part of the trip this board cannot reduce.
3.00 t CO2
10
Back to GO
The economy turns over about US$1,450 billion a year (IMF World Economic Outlook, 2026 projection). Every lap of this board is a choice about how much of it stays.
US$1,450bn
GDPUS$1,332.8bn
Agriculture, share of GDP1.7%
Visitors a year7,265,000
Visitors per resident0.4
Residents~18,087,633
Agriculture
Farming is 1.7% of the economy. The Netherlands is one of the world's largest food exporters by value, with intensive high-yield horticulture, glasshouse growing and dairy, though it relies on imported animal feed and tropical produce and faces a serious nitrogen-pollution crisis from farming intensity.
Natural materials
The Netherlands has deep flax-linen and Twente textile heritage that is now much reduced as living production, offset by strong circular-economy and textile-recycling policy and a deposit-return culture that curbs single-use waste.
Energy
The Netherlands has cut emissions substantially but remains a relatively high emitter at about 6.3 tonnes per person in 2024, a legacy of its industry, dense population and long dependence on Groningen natural gas. Renewables now supply close to half of electricity, around 46 per cent in 2023, led by rapidly expanding offshore wind and solar.
Who owns the biggest hotels in the Netherlands?
By rooms · company records and press.
Camping Si-Es-An · ~25 roomsIndependentnot published
Sir Adam Hotel · ~108 roomsCorporatenot published
Sir Albert Hotel · ~90 roomsCorporatenot published
Van der Valk Nijmegen-Lent · ~116 roomsFranchisenot published
Landgoed De Wilmersberg · ~60 roomsIndependentnot published
Hotel Okura Amsterdam · ~300 roomsCorporatenot published
Parc Broekhuizen · ~22 roomsIndependentnot published
Pestana Amsterdam Riverside · ~154 roomsCorporatenot published
Park Plaza Victoria · ~306 roomsCorporatenot published
Van der Valk Gilze Tilburg · ~120 roomsFranchisenot published
Visitors, over time
201515,007k
201615,828k
201717,924k
201818,780k
201920,129k
20207,265k
International tourism receipts run at about US$10.93 billion in 2020 (World Bank / UN Tourism). That is 1.4% of everything the country earns from exports.
How much of your money actually stays here?
Tap the holiday you are planning.
All-inclusive resortForeign-owned hotel and tourist restaurantsLocally owned stay and local restaurantsGuesthouse, markets and public transport
Resort guest, villa renter, family, nomad or backpacker. The honest playbook for each, from the same sourced numbers.
Already booked a resort? · the rescue list
Five swaps that move your money back on-island
1. Eat where the country eats Choose kitchens cooking what the land here grows, sugar beets, potatoes, onions, wheat, tomatoes and carrots/turnips, over an imported menu. The checked list →
2. Book with a local operator Never the lobby desk. The margin on a tour is the part that stays. Eco tours →
3. Stay somewhere locally owned Ownership decides where the room rate books. Eco stays →
4. Use the transport residents use A dense train network and world-class cycling, with contactless and the OV-chipkaart for public transport.
5. Buy the craft, not the souvenir Natural-materials work made here pays the maker directly; imported gifts pay a shipping line.
swipe →
First time here
A densely populated, highly engineered delta with excellent tap water, strong recycling and deposit-return systems, and the internationally important Wadden Sea.
Best time: Spring for tulips, summer for long days.
Getting around
A dense train network and world-class cycling, with contactless and the OV-chipkaart for public transport.
Transport is where the fare either stays or leaves.
Eating here
The everyday plate that actually grows here is sugar beets, potatoes, onions, wheat, tomatoes and carrots/turnips. Ordering those keeps the money with the grower and cuts the imported share of the meal.
Eating what the country grows is the cheapest way to cut the import bill.
Good to know
Cards everywhere; EUR. Cycling rules are serious; the train network is excellent.
Rate my hotel. Tap yours for the honest verdict.
Ownership from company records and press.
Camping Si-Es-AnSir Adam HotelSir Albert HotelVan der Valk Nijmegen-LentLandgoed De WilmersbergHotel Okura AmsterdamParc BroekhuizenPestana Amsterdam RiversidePark Plaza VictoriaVan der Valk Gilze Tilburg
.
Who owns the big hotels
Camping Si-Es-AnIndependent · 25 rooms
Sir Adam HotelCorporate · 108 rooms
Sir Albert HotelCorporate · 90 rooms
Van der Valk Nijmegen-LentFranchise · 116 rooms
Landgoed De WilmersbergIndependent · 60 rooms
Hotel Okura AmsterdamCorporate · 300 rooms
Parc BroekhuizenIndependent · 22 rooms
Pestana Amsterdam RiversideCorporate · 154 rooms
Park Plaza VictoriaCorporate · 306 rooms
Van der Valk Gilze TilburgFranchise · 120 rooms
None of the 10 properties listed here publishes who ultimately owns it, so no claim is made either way. Ownership is what decides how much of a room rate stays in the country, which is why we show it when a listing states it.
Society and Governance in the Netherlands.
How well is the Netherlands actually run?
Governance, measured · World Bank WGI
Four measured answers, none of them opinion. Averaged across corruption control, delivery and accountability, the Netherlands scores 86 out of 100 (2024, World Bank Worldwide Governance Indicators). That is a state that generally does what it says it will do, which is what makes a climate pledge worth reading.
How well is Netherlands run? · each scored out of 100, higher is better
Clean government, scored 87 of 100
Control of corruption scores 86.5 out of 100 (2024, World Bank Worldwide Governance Indicators). That puts it in the cleanest quarter of governments measured.
87
Freedom and rights, scored 86 of 100
Voice and accountability, which measures free expression, free media and the ability to choose a government, scores 85.8 out of 100 (2024, World Bank WGI). Citizens here can question their government openly.
86
Government effectiveness, scored 85 of 100
Government effectiveness, which measures the quality of public services and how well policy is actually delivered, scores 85.4 out of 100 (2024, World Bank WGI). Delivery is rated among the strongest measured.
85
Income equality, scored 26 of 100
The Gini index of income inequality reads 25.7 (2021, World Bank). Zero is perfect equality and 100 is one person holding everything. Below 40 is the level usually treated as manageable, and the Netherlands sits inside it.
26
LGBTQ+ status: HighSolo female travel: EasyIndustry to avoid: Intensive livestock farming (nitrogen) and the Rotterdam petrochemical cluster.
What is daily life in Netherlands really like? Measured
Getting around, breathing, throwing away, learning. The honest checklist.
TransportAirWaterWastePower
✓How you get around A dense train network and world-class cycling, with contactless and the OV-chipkaart for public transport.
✓Air quality, measured Modelled annual mean 9.7. The WHO guideline is 5 µg/m³.
✓Where the air is cleanest The Wadden islands and North Sea coast.
✓Tap water Drinkable
✓What to drink Excellent tap water everywhere.
✓Plastic rules Plastic-bag charge since 2016 and a deposit-return scheme on bottles and cans.
✓Sockets and voltage Type C/F, 230V
Made in the Netherlands.
The Netherlands has deep flax-linen and Twente textile heritage that is now much reduced as living production, offset by strong circular-economy and textile-recycling policy and a deposit-return culture that curbs single-use waste. Every step of processing done at home is value that stops leaving the country.
What Netherlands actually sells the world
The single biggest thing Netherlands sells the world is mineral fuels and oils, 18.0% of all exports in 2023 (about US$129.48 billion, UN Comtrade). The next four are machinery and mechanical appliances at 13.5%, electrical machinery and electronics at 8.9%, optical, medical and precision instruments at 6.1%, vehicles at 4.1%.
Made now · natural materials
Netherlands has deep flax-linen
Worked in Netherlands from local material, and still a working craft rather than a museum piece.
Made now · natural materials
Offset by strong circular-economy
Worked in Netherlands from local material, and still a working craft rather than a museum piece.
Made now · natural materials
Textile-recycling policy
Worked in Netherlands from local material, and still a working craft rather than a museum piece.
Made now · natural materials
Deposit-return culture that curbs single-use waste
Worked in Netherlands from local material, and still a working craft rather than a museum piece.
Could make · grown here already
Potatoes
Grown in Netherlands and mostly sold raw. Processing it here would keep the margin here.
Could make · grown here already
Dairy
Grown in Netherlands and mostly sold raw. Processing it here would keep the margin here.
Could make · grown here already
Cheese
Grown in Netherlands and mostly sold raw. Processing it here would keep the margin here.
The maths for an entrepreneur. the Netherlands produces about US$1,333 billion a year, which is roughly US$73,684 per person (2025, World Bank). Farming is 1.7% of that, while food is 13.3% of everything the country imports. The country buys in more food than its own farms contribute to the economy, and every point of that gap is a business someone could build here rather than ship in. With 30% of the land arable, the raw material for that is already in the ground.
A living tradition of Netherlands, still practised rather than archived.
Southern Carnaval of Limburg
A living tradition of Netherlands, still practised rather than archived.
Brabant
A living tradition of Netherlands, still practised rather than archived.
Frisian language
A living tradition of Netherlands, still practised rather than archived.
Traditional sportsA living tradition of Netherlands, still practised rather than archived.
Klompendansen clog dancingA living tradition of Netherlands, still practised rather than archived.
Does Netherlands protect its heritage by law?
Partly, and the gaps say as much as the protections.
What is kept alive. The Netherlands is a highly secular and modernised society, and its distinctive living folk heritage is more limited than in many countries, though real traditions endure. The Sinterklaas celebration remains a major living custom, and the Catholic south sustains a vibrant regional Carnaval in Limburg and Brabant. Frisian culture keeps its own language alive along with traditional sports such as fierljeppen and kaatsen.
Who it belongs to. Tourism is developed and urban with a strong civic sustainability ethic and world-class cycling culture, and benefits are broadly distributed, but this is destination tourism facing overtourism pressure in Amsterdam rather than community-rooted or indigenous tourism.
Only here. Wadlopen, guided walking across the Wadden Sea mudflats at low tide..
Three futures for the Netherlands, every one run forward from measured data.
Where the making actually happens
Named cultural and craft sites on the open map: Botanical Garden Zuidas (Amsterdam), The Bonaire Botanical Garden. OpenStreetMap. Named craft workshops on the open map: 't Naaldje Kledingreparatie en Verstelwerk, Art & Hobby, Benthe, Brijen en Zo, Brugman Art, Crea-Art.
Every measured trend on one line
Run forward at the pace already recorded.
+6%
Forest cover
1995: 10.4 % → 2023: 11.1 %
+1814%
Renewable electricity
1995: 1.7 % → 2021: 33.1 %
-43%
CO2 per person
1995: 11.5 t → 2024: 6.6 t
+11%
Tourist arrivals
1995: 6574 k → 2020: 7265 k
+30%
Protected land
2013: 17.6 % → 2025: 22.9 %
-55%
Farm workforce
1995: 3.83 % → 2025: 1.7 %
+55%
Protected sea
2013: 21.6 % → 2025: 33.5 %
-8%
Agricultural land
1995: 58.2 % → 2023: 53.5 %
+36%
Urban population
1995: 70.7 % → 2025: 95.9 %
-59%
Air pollution
1995: 21.1 µg/m³ → 2023: 8.6 µg/m³
-13%
Fresh water per person
1995: 711.6 m³ → 2022: 621.4 m³
+8%
Adult overweight
1995: 42.6 % → 2022: 45.9 %
+0%
Electricity access
1995: 100 % → 2024: 100 %
+151%
GDP per person
1995: 29301 → 2025: 73684
+17%
Population
1995: 15459 k → 2025: 18088 k
+917%
Renewable energy use
1995: 1.2 % → 2021: 12.2 %
-28%
Energy per person
1995: 4732 kg → 2024: 3416 kg
+48%
Protected area, total
2013: 20.2 % → 2025: 29.8 %
+6%
Life expectancy
1995: 77.4 yrs → 2024: 82 yrs
-12%
Cereal yield
1995: 7769 ha → 2024: 6806 ha
-59%
Fertiliser use
1995: 582.2 ha → 2023: 238 ha
-86%
Rural population
1995: 29.3 % → 2025: 4.1 %
+44%
Water productivity
1995: 77.1 $/m3 → 2022: 111.3 $/m3
+30%
Health spending
2000: 7.7 % → 2024: 10 %
+6%
Forest area
1995: 3524 km2 → 2023: 3723 km2
+12%
Electric power use
1995: 5718 kWh → 2024: 6386 kWh
-23%
Emissions: Agriculture
1990: 24.3 e → 2023: 18.6 e
-40%
Emissions: Building
1990: 28.9 e → 2023: 17.4 e
-25%
Emissions: Electricity/Heat
1990: 57.8 e → 2023: 43.6 e
-27%
Emissions: Energy
1990: 156.2 e → 2023: 113.8 e
-82%
Emissions: Industrial Processes
1990: 19.5 e → 2023: 3.5 e
-30%
Emissions: Manufacturing/Construction
1990: 28.6 e → 2023: 20.1 e
World Bank open data, recorded series
How much forest is left?
Forest cover moved from 10.4% to 11.1% across 28 recorded years.
World Bank AG.LND.FRST.ZS
How clean is the grid?
Renewable electricity moved from 1.7% to 33.1% across 26 recorded years.
World Bank EG.ELC.RNEW.ZS
How much climate pollution per person?
CO2 per person moved from 11.5 t to 6.6 t across 29 recorded years.
World Bank EN.GHG.CO2.PC.CE.AR5
How many people visit?
Tourist arrivals moved from 6574k to 7265k across 25 recorded years.
World Bank ST.INT.ARVL
How much land is protected?
Protected land moved from 17.6% to 22.9% across 12 recorded years.
World Bank ER.LND.PTLD.ZS
How many people still farm?
Farm workforce moved from 3.8% to 1.7% across 30 recorded years.
World Bank SL.AGR.EMPL.ZS
How much sea is protected?
Protected sea moved from 21.6% to 33.5% across 12 recorded years.
World Bank ER.MRN.PTMR.ZS
How much land is farmed?
Agricultural land moved from 58.2% to 53.5% across 28 recorded years.
World Bank AG.LND.AGRI.ZS
How fast is it urbanising?
Urban population moved from 70.7% to 95.9% across 30 recorded years.
World Bank SP.URB.TOTL.IN.ZS
Is the air getting cleaner?
Air pollution moved from 21.1 µg/m³ to 8.6 µg/m³ across 28 recorded years.
World Bank EN.ATM.PM25.MC.M3
Is water getting scarcer?
Fresh water per person moved from 711.6 m³ to 621.4 m³ across 27 recorded years.
World Bank ER.H2O.INTR.PC
Is diet-related disease rising?
Adult overweight moved from 42.6% to 45.9% across 27 recorded years.
World Bank SH.STA.OWAD.ZS
Who has power?
Electricity access moved from 100.0% to 100.0% across 29 recorded years.
World Bank EG.ELC.ACCS.ZS
Is income rising?
GDP per person moved from 29301 to 73684 across 30 recorded years.
World Bank NY.GDP.PCAP.CD
How fast is it growing?
Population moved from 15459k to 18088k across 30 recorded years.
World Bank SP.POP.TOTL
What share of all energy is renewable?
Renewable energy use moved from 1.2% to 12.2% across 26 recorded years.
World Bank EG.FEC.RNEW.ZS
How much energy does one person use?
Energy per person moved from 4732 kg to 3416 kg across 29 recorded years.
World Bank EG.USE.PCAP.KG.OE
How much land and sea is protected together?
Protected area, total moved from 20.2% to 29.8% across 12 recorded years.
World Bank ER.PTD.TOTL.ZS
How long do people live?
Life expectancy moved from 77.4 yrs to 81.97 yrs across 29 recorded years.
World Bank SP.DYN.LE00.IN
How much does a hectare of cereal produce?
Cereal yield moved from 7769 kg/ha to 6806 kg/ha across 29 recorded years.
World Bank AG.YLD.CREL.KG
How much fertiliser goes on the land?
Fertiliser use moved from 582.15 kg/ha to 238.02 kg/ha across 28 recorded years.
World Bank AG.CON.FERT.ZS
How many people still live rurally?
Rural population moved from 29.31% to 4.06% across 30 recorded years.
World Bank SP.RUR.TOTL.ZS
How much value per cubic metre of water?
Water productivity moved from 77.08 $/m3 to 111.3 $/m3 across 27 recorded years.
World Bank ER.GDP.FWTL.M3.KD
How much goes on health?
Health spending moved from 7.7% to 10.01% across 24 recorded years.
World Bank SH.XPD.CHEX.GD.ZS
How much forest is there in total?
Forest area moved from 3524 km2 to 3723 km2 across 28 recorded years.
World Bank AG.LND.FRST.K2
How much electricity per person?
Electric power use moved from 5718 kWh to 6386 kWh across 29 recorded years.
World Bank EG.USE.ELEC.KH.PC
How have agriculture emissions moved?
Agriculture emissions moved from 24.27 to 18.62 MtCO2e across 33 recorded years.
Climate Watch (WRI), historical emissions
How have building emissions moved?
Building emissions moved from 28.89 to 17.44 MtCO2e across 33 recorded years.
Climate Watch (WRI), historical emissions
How have electricity/heat emissions moved?
Electricity/Heat emissions moved from 57.84 to 43.61 MtCO2e across 33 recorded years.
Climate Watch (WRI), historical emissions
How have energy emissions moved?
Energy emissions moved from 156.21 to 113.83 MtCO2e across 33 recorded years.
Climate Watch (WRI), historical emissions
How have industrial processes emissions moved?
Industrial Processes emissions moved from 19.47 to 3.51 MtCO2e across 33 recorded years.
Climate Watch (WRI), historical emissions
How have manufacturing/construction emissions moved?
Manufacturing/Construction emissions moved from 28.6 to 20.14 MtCO2e across 33 recorded years.
Climate Watch (WRI), historical emissions
Worst caseCurrent pathBest case
Worst case
Every measured decline continues at the pace already recorded. The weakest pillar, heritage at 2/5, is the one that gives way first.
Computed from: recorded series extended with no policy change
Current path
Every line above is a recorded World Bank series for this country. The current path is simply those series continuing at the pace already measured.
Computed from: recorded series, no policy change assumed
Best case
The pledges are met on their own stated timetables and the weakest pillars are lifted to match the strongest. Netherlands already shows it can do this: water scores 5/5.
Computed from: each published target delivered on its own date
What the best case actually asks for
Lift heritage
It scores 2 out of 5 today, among the weakest parts of Netherlands's record. The Netherlands is a highly secular and modernised society, and its distinctive living folk heritage is more limited than in many countries, though real traditions endure. The Sinterklaas celebration remains a major living custom, and the Catholic south sustains a vibrant regional Carnaval in Limburg and Brabant. Frisian culture keeps its own language alive along with traditional sports such as fierljeppen and kaatsen. Folk elements such as klompendansen clog dancing survive largely in a folkloric and staged form. Living tradition is present but modest against a broadly secular national culture. Lifting it toward the 5/5 the strongest pillars already reach is what the best case turns on.
measured each year
Costs: spending and enforcement, not new technology
Lift natural fibres
It scores 2 out of 5 today, among the weakest parts of Netherlands's record. The Netherlands has deep flax-linen and Twente textile heritage that is now much reduced as living production, offset by strong circular-economy and textile-recycling policy and a deposit-return culture that curbs single-use waste. Lifting it toward the 5/5 the strongest pillars already reach is what the best case turns on.
measured each year
Costs: spending and enforcement, not new technology
Lift wildlife
It scores 2 out of 5 today, among the weakest parts of Netherlands's record. Most of the landscape is heavily modified with little endemism and few large wild mammals, but the Wadden Sea is a globally important stop on the East Atlantic migratory bird flyway and a major seal habitat. Lifting it toward the 5/5 the strongest pillars already reach is what the best case turns on.
measured each year
Costs: spending and enforcement, not new technology
Government and Goals in the Netherlands.
Who is in charge of Netherlands now · Office-holders from the UN Protocol and Liaison Service public list of Heads of State and Heads of Government, 8 September 2026. Legislature and election dates from IFES ElectionGuide. Constitution dates from the Constitute Project. Governance scores from the World Bank Worldwide Governance Indicators 2024.
Rob Jetten
Prime Minister
Rob Jetten is the head of government of Netherlands, in office since 23 February 2026. Every climate, protection and energy pledge on this page is delivered, or not, under this administration.
Public opinion, measured
Voice and accountability, the freedom to question government: 85.8 / 100. Among the strongest measured. World Bank WGI 2024
Control of corruption: 86.5 / 100. Among the strongest measured. World Bank WGI 2024
Political stability and absence of violence: 73.2 / 100. Above the halfway mark of governments measured. World Bank WGI 2024
Rule of law: 86.3 / 100. Among the strongest measured. World Bank WGI 2024
Regulatory quality: 82 / 100. Among the strongest measured. World Bank WGI 2024
Rob JettenPrime Minister
States General (Staten-Generaal)Legislature, bicameral
Last election29 October 2025
Constitution1814, as revised to 2008
Government typeparliamentary constitutional monarchy; part of the Kingdom of the Netherlands
Netherlands national goals: climate commitments on record · as recorded by Climate Watch, World Resources Institute
2050
Net zero
In Law
Net-zero target as recorded by Climate Watch. Status: In Law (1/1/2020) ↗
The questions people actually type, answered in full sentences from the sourced data above.
swipe →
Is Netherlands sustainable?
Netherlands scores 70 out of 100 on the Throne Eco Index, across twelve equally weighted pillars. A densely populated, highly engineered delta with excellent tap water, strong recycling and deposit-return systems, and the internationally important Wadden Sea.
Is the water in Netherlands safe and plentiful?
The Netherlands draws on the Rhine and Meuse rivers, dune-filtered groundwater and the IJsselmeer freshwater lake, managed by some of the world's most advanced flood and water engineering. Tap water is excellent and served without chlorine, and about 99.97% of people use safely managed drinking water (World Bank, 2020).
Can Netherlands feed itself?
The Netherlands is one of the world's largest food exporters by value, with intensive high-yield horticulture, glasshouse growing and dairy, though it relies on imported animal feed and tropical produce and faces a serious nitrogen-pollution crisis from farming intensity.
Is it easy to eat plant-based in Netherlands?
Dutch cities have a strong and growing plant-based scene, and the country is a hub for plant-based product innovation, so vegan and vegetarian eating is easy, especially in Amsterdam, Rotterdam and Utrecht.
How much of Netherlands is actually protected?
Natura 2000 covers about 9% of the land surface and about 26% of coastal and marine waters, rising to 20% of land and 31% of marine waters once the national ecological network and marine strategy areas are counted (Compendium voor de Leefomgeving, 2024), with strong governance and the Wadden Sea recognised as a UNESCO World Heritage site. Rewilding experiments such as Oostvaardersplassen have been influential though controversial.
What wildlife is left in Netherlands?
Most of the landscape is heavily modified with little endemism and few large wild mammals, but the Wadden Sea is a globally important stop on the East Atlantic migratory bird flyway and a major seal habitat.
Is Netherlands on clean energy?
The Netherlands has cut emissions substantially but remains a relatively high emitter at about 6.3 tonnes per person in 2024, a legacy of its industry, dense population and long dependence on Groningen natural gas. Renewables now supply close to half of electricity, around 46 per cent in 2023, led by rapidly expanding offshore wind and solar. The country has a binding Climate Act targeting net zero by 2050 and a coal phase-out, and electricity-sector emissions are falling quickly.
How polluted is Netherlands?
A plastic-bag charge has applied since 2016 and a deposit-return scheme now covers bottles and cans, and air is relatively clean at about 9.7 micrograms per cubic metre PM2.5 (IQAir, 2025), though intensive livestock farming drives heavy ammonia and nitrogen pollution.
Does recycling work in Netherlands?
About 54.6% of municipal waste is recycled (Eurostat, 2023), supported by mature separate collection and deposit-return systems.
Is the farming in Netherlands organic?
Organic farming covers about 5.1% of agricultural land (Eurostat, 2024), below the EU average and the EU target of 25% by 2030, but a real and certified sector.
Are there natural materials and craft in Netherlands?
The Netherlands has deep flax-linen and Twente textile heritage that is now much reduced as living production, offset by strong circular-economy and textile-recycling policy and a deposit-return culture that curbs single-use waste.
Is there living culture in Netherlands?
Tourism is developed and urban with a strong civic sustainability ethic and world-class cycling culture, and benefits are broadly distributed, but this is destination tourism facing overtourism pressure in Amsterdam rather than community-rooted or indigenous tourism.
What heritage does Netherlands keep alive?
The Netherlands is a highly secular and modernised society, and its distinctive living folk heritage is more limited than in many countries, though real traditions endure. The Sinterklaas celebration remains a major living custom, and the Catholic south sustains a vibrant regional Carnaval in Limburg and Brabant. Frisian culture keeps its own language alive along with traditional sports such as fierljeppen and kaatsen.
So is the Netherlands actually green? The measured answer
What is working: sea protected at 33.5%.
What is not: renewable electricity at 33.1% against a 100% mark.
Netherlands sits 25 of 77 at 70/100. Every name links to its own destination page, built exactly like this one. The full ranking →
What is Netherlands particularly good at?
✓Recycling, scored 5/5. About 54.6% of municipal waste is recycled (Eurostat, 2023), supported by mature separate collection and deposit-return systems.
✓Water, scored 5/5. The Netherlands draws on the Rhine and Meuse rivers, dune-filtered groundwater and the IJsselmeer freshwater lake, managed by some of the world's most advanced flood and water engineering. Tap water is excellent and served without chlorine, and about 99.97% of people use safely managed drinking water (World Bank, 2020).
✓Conservation, scored 4/5. Natura 2000 covers about 9% of the land surface and about 26% of coastal and marine waters, rising to 20% of land and 31% of marine waters once the national ecological network and marine strategy areas are counted (Compendium voor de Leefomgeving, 2024), with strong governance and the Wadden Sea recognised as a UNESCO World Heritage site. Rewilding experiments such as Oostvaardersplassen have been influential though controversial.
Where does Netherlands score worst?
✕Heritage, scored 2/5. The Netherlands is a highly secular and modernised society, and its distinctive living folk heritage is more limited than in many countries, though real traditions endure. The Sinterklaas celebration remains a major living custom, and the Catholic south sustains a vibrant regional Carnaval in Limburg and Brabant. Frisian culture keeps its own language alive along with traditional sports such as fierljeppen and kaatsen. Folk elements such as klompendansen clog dancing survive largely in a folkloric and staged form. Living tradition is present but modest against a broadly secular national culture.
✕Natural fibres, scored 2/5. The Netherlands has deep flax-linen and Twente textile heritage that is now much reduced as living production, offset by strong circular-economy and textile-recycling policy and a deposit-return culture that curbs single-use waste.
✕Wildlife, scored 2/5. Most of the landscape is heavily modified with little endemism and few large wild mammals, but the Wadden Sea is a globally important stop on the East Atlantic migratory bird flyway and a major seal habitat.
Similar countries doing it better and worse
FranceScored on the same twelve pillars as Netherlands.78
SwitzerlandScored on the same twelve pillars as Netherlands.75
GermanyScored on the same twelve pillars as Netherlands.75
United KingdomScored on the same twelve pillars as Netherlands.65
MontenegroScored on the same twelve pillars as Netherlands.62
SerbiaScored on the same twelve pillars as Netherlands.58
A note from the lens of mother natureswipe →
Energy, 3/5
The Netherlands has cut emissions substantially but remains a relatively high emitter at about 6.3 tonnes per person in 2024, a legacy of its industry, dense population and long dependence on Groningen natural gas. Renewables now supply close to half of electricity, around 46 per cent in 2023, led by rapidly expanding offshore wind and solar.
Food and farming, 4/5
The Netherlands is one of the world's largest food exporters by value, with intensive high-yield horticulture, glasshouse growing and dairy, though it relies on imported animal feed and tropical produce and faces a serious nitrogen-pollution crisis from farming intensity.
Heritage, 2/5
The Netherlands is a highly secular and modernised society, and its distinctive living folk heritage is more limited than in many countries, though real traditions endure. The Sinterklaas celebration remains a major living custom, and the Catholic south sustains a vibrant regional Carnaval in Limburg and Brabant.
Consequence: It is the lowest-scoring part of Netherlands's record, so it is where the score moves first.
The Netherlands Directory.
Everything on Hold The Throne that sits in Netherlands, checked and listed.
World Bank Worldwide Governance Indicators, 2024. Percentile among all governments measured.
Government effectiveness
85.4 / 100
World Bank Worldwide Governance Indicators, 2024. Percentile among all governments measured.
Rule of law
86.3 / 100
World Bank Worldwide Governance Indicators, 2024. Percentile among all governments measured.
Political stability
73.2 / 100
World Bank Worldwide Governance Indicators, 2024. Percentile among all governments measured.
Voice and accountability
85.8 / 100
World Bank Worldwide Governance Indicators, 2024. Percentile among all governments measured.
Environmental Performance Index
66.9 / 100 · 14 of 180
Yale Environmental Performance Index 2024, ranked 14 of 180 countries assessed.
Ecosystem vitality
66.7 / 100 · 28 of 180
Yale Environmental Performance Index 2024, ranked 28 of 180 countries assessed.
Biodiversity and habitat
60.5 / 100 · 45 of 180
Yale Environmental Performance Index 2024, ranked 45 of 180 countries assessed.
Air pollution
92.6 / 100 · 16 of 180
Yale Environmental Performance Index 2024, ranked 16 of 180 countries assessed.
Terrestrial biomes protected
90.1 / 100 · 25 of 180
Yale Environmental Performance Index 2024, ranked 25 of 180 countries assessed.
Marine protected areas
32.6 / 100 · 121 of 131
Yale Environmental Performance Index 2024, ranked 121 of 131 countries assessed.
How the Netherlands Is Scored. The Throne Standard.
Every destination on the index is scored the same way, so a 4 in Barbados means exactly what a 4 means in Iceland. No self-declared data and no brochure claims are accepted. Every figure on this page carries its named source and year, and the history on each page names what empire took as plainly as it scores the present.
The 12 pillars every destination is scored on, equally weighted
01
Conservation
Land and sea actually protected, not pledged
02
Wildlife
What survives, what is endemic, what is lost
03
Water
Fresh water per person, and the ocean’s health
04
Food & farming
Whether the place can feed itself
05
Organic & clean
Certified land and pesticide reality
06
Climate & energy
Emissions per person, how the grid is powered
07
Waste
Where the rubbish goes, what comes back
08
Health
What people eat and die of
09
Heritage
Living culture, and what the law keeps standing
10
Ownership
Who owns the economy, how much of a dollar stays
11
Governance
Freedom, honesty, promises kept
12
Future
Measured trends run forward, pledges against pace
What each 0 to 5 pillar score means, in plain words
The institutions above are the ones cited on this page, ranked by how many of its figures they carry. This same sectioned page renders for all 77 scored destinations, each with its own researched history, comparison charts and three-way future. Read the full methodology
Every figure on this page, and where it came from: 73 sources across 29 institutions
World Bank17 FIGURES
Forest area (% of land area) AG.LND.FRST.ZS, 2023 check
Terrestrial protected areas (% of land area) ER.LND.PTLD.ZS, 2024 check
Marine protected areas (% of territorial waters) ER.MRN.PTMR.ZS, 2025 check
People using safely managed drinking water services (% of population) SH.H2O.SMDW.ZS, 2020 check
Threatened species (mammals EN.MAM.THRD.NO, birds EN.BIR.THRD.NO, fish EN.FSH.THRD.NO, higher plants EN.HPT.THRD.NO), 2022 check
Renewable electricity output (% of total) EG.ELC.RNEW.ZS, 2021 check
CO2 emissions per capita EN.GHG.CO2.PC.CE.AR5, 2024 check
UN SDG Global Database, electronic waste recycled (%) EN_EWT_RCYR, Netherlands, 2018 (75.6%), country-reported check
recycling rate of municipal waste (cei_wm011) check
municipal waste by treatment operation (env_wasmun) check
area under organic farming (sdg_02_40), 2024 check
Other published sources4 FIGURES
Natura 2000 is 9% of land and 26% of marine waters; the World Bank figures cited were all protected areas, and its marine value is now 33.5% (2025), not 26.9% (2021) check
Not Evaluated (NE) on the IUCN Red List version 2026-1; it has no global assessment at all check
Not Evaluated (NE) on the IUCN Red List version 2026-1; it has no global assessment at all check
2025 annual data published; mineral fuels fell to 13.1% and machinery (HS 84) is now largest at 14.4% check
Rijkswaterstaat4 FIGURES
The IJsselmeer and Markermeer: a natural water tank, The Netherlands draws on the Rhine and Meuse rivers, dune-filtered groundwater and the IJsselmeer freshwater l check
The IJsselmeer and Markermeer: a natural water tank corroboration check
The IJsselmeer and Markermeer: a natural water tank corroboration check
The IJsselmeer and Markermeer: a natural water tank corroboration check
UNESCO Institute for Statistics4 FIGURES
public data API, indicator XGDP.FSGOV (government expenditure on education as a percentage of GDP), Public spending on education runs at 5.2% of GDP and 12.0% of all government spending, and secondary enrolment check
public data API, indicator XGDP.FSGOV (government expenditure on education as a percentage of GDP) corroboration check
public data API, indicator XGDP.FSGOV (government expenditure on education as a percentage of GDP) corroboration check
public data API, indicator XGDP.FSGOV (government expenditure on education as a percentage of GDP) corroboration check
BirdLife International, IUCN and UNEP-WCMC3 FIGURES
UN SDG Global Database, terrestrial Key Biodiversity Areas covered by protected areas (%) ER_PTD_TERR, Netherlands, 2025 (79.2%), country-reported check
UN SDG Global Database, marine Key Biodiversity Areas covered by protected areas (%) ER_MRN_MPA, Netherlands, 2025 (96.0%), country-reported check
UN SDG Global Database, freshwater Key Biodiversity Areas covered by protected areas (%) ER_PTD_FRHWTR, Netherlands, 2025 (86.1%), country-reported check
Drents Museum3 FIGURES
collection record, object 1955-VIII-2, The Pesse canoe, cut from a Scots pine and preserved in a peat bog, dates to between 8250 and 7550 BC and is t check


 FranceScored on the same twelve pillars as Netherlands.78
 SwitzerlandScored on the same twelve pillars as Netherlands.75
 GermanyScored on the same twelve pillars as Netherlands.75
 United KingdomScored on the same twelve pillars as Netherlands.65
 MontenegroScored on the same twelve pillars as Netherlands.62
 SerbiaScored on the same twelve pillars as Netherlands.58