Destinations › Europe · The Destination Index · universal template · every figure sourced
United Kingdom.
Western Europe, islands, including the northern one-sixth of the island of Ireland, between the North Atlantic Ocean and the North Sea; northwest of France. 243,610 sq km and 69,487,000 people, 12,429 km of coastline, temperate; moderated by prevailing southwest winds over the North Atlantic Current; more than one-half of the days are overcast.
Region · EuropePopulation · ~69,487,000Languages · English, with Welsh, Scottish Gaelic, Scots, Irish and CornishEco Index · 65/100 · Passable
The Eco Index across 12 pillars · scored 0 to 5 · World Bank, OWID, WHO/UNICEF JMP, FiBL, Protected Planet, IUCN, UNESCO (2023-24)
Conservation
Wildlife
Water
Food & farming
Organic & clean
Climate & energy
Waste
Health
Heritage
Ownership
Governance
Future
The History of the United Kingdom.
The United Kingdom keeps notable folk traditions, though society is largely secular and modernised. Morris dancing, Highland dancing, ceilidh, maypole and rapper sword dancing survive, alongside folk song, sea shanties, bagpipes, brass bands and Welsh male voice choirs.
Where the name comes from
'Britain' comes through Latin Britannia from a name for the island's peoples. The state title describes the union itself rather than a place. Source: national and regional toponymic records.
The land itself: rugged hills and low mountains through the north and west, level to rolling plains across the east and south east. Its high point is Ben Nevis, 1,345 m. Source: national mapping and survey records.
Where it starts
Nearly a million years
Footprints and stone tools at Happisburgh on the Norfolk coast are around 900,000 years old, the earliest evidence of humans anywhere in northern Europe. At Star Carr in Yorkshire, a Mesolithic settlement around 11,000 years old preserved worked timber, antler headdresses and a wooden platform. The stone village of Skara Brae on Orkney, built around 3180 BC, had fitted furniture, drains and linked houses, and was lived in for six centuries. Stonehenge was raised in stages, with bluestones carried from Wales.
How it got here
Empire, and its cost
Much of the island was Roman for nearly four centuries. Norse raids and settlement were followed by Norman conquest in 1066, and Magna Carta limited royal power in 1215. From the seventeenth century Britain built a global empire and was the dominant carrier in the transatlantic slave trade between 1640 and 1807, transporting an estimated 3.1 million Africans, of whom about 2.7 million arrived, and standing second to Portugal and Brazil across the trade as a whole. It abolished the trade in 1807 and slavery in 1833. Women gained the vote on equal terms with men in 1928.
The timeline
c. 900,000 years ago
Happisburgh.
Footprints and stone tools on the Norfolk coast are the earliest evidence of humans in northern Europe. ↗
c. 11,000 years ago
Star Carr.
A Mesolithic settlement in Yorkshire with worked timber, antler headdresses and a wooden platform. ↗
c. 3180 BC
Skara Brae.
A stone village on Orkney, with fitted furniture, drains and linked houses, occupied for six centuries. ↗
c. 3000 to 2000 BC
Stonehenge.
Raised in stages on Salisbury Plain, with bluestones brought from Wales. ↗
AD 43 to 410
Roman Britain.
Much of the island is incorporated into the Roman world from AD 43 to around 411. ↗
793 onward
Norse and Norman.
Norse raids and settlement are followed by Norman conquest in 1066. ↗
1215
Magna Carta.
A charter limiting royal power is sealed at Runnymede in 1215, drawing on a tradition of English law codes and charters that ran well before it. ↗
1600s to 1800s
Empire and slavery.
Britain builds a global empire and is the dominant carrier in the transatlantic slave trade between 1640 and 1807, second only to Portugal across the trade as a whole, before abolishing the trade in 1807 and slavery in 1833. ↗
1928
Equal franchise.
The Representation of the People Act 1928 gives women the vote at 21 on the same terms as men, after an earlier act had granted it only to older women meeting a property qualification. ↗
British Museum · Historic England · National Museums Scotland
Nature and Biodiversity in the United Kingdom.
On paper the UK protects about 28.4% of its land and 47% of its seas (World Bank, 2025), which looks strong. In practice protection is weak: more than half of Sites of Special Scientific Interest are in unfavourable condition and many marine protected areas still permit bottom trawling, so several are effectively paper parks.
Is wild United Kingdom protected? 28.4% of the land is, against a 30% target for 2030
Found only here. Few full endemics; the Scottish primrose and the Scottish crossbill, Britain's only endemic bird
The watchlist
ThreatenedOryctolagus cuniculusEndangered on the IUCN Red List, and recorded in United Kingdom in GBIF occurrence data (mammal).
ThreatenedGough Finch (Rowettia goughensis)Critically Endangered on the IUCN Red List, and recorded in United Kingdom in GBIF occurrence data (bird).
ThreatenedLepidochelys kempiiCritically Endangered on the IUCN Red List, and recorded in United Kingdom in GBIF occurrence data (turtle).
ThreatenedGaleorhinus galeusCritically Endangered on the IUCN Red List, and recorded in United Kingdom in GBIF occurrence data (shark or ray).
ThreatenedGwynne's Mining Bee (Andrena bicolor)Not evaluated on the IUCN Red List, and recorded in United Kingdom in GBIF occurrence data (insect).
ThreatenedGiant Herb-Robert (Geranium maderense)Critically Endangered on the IUCN Red List, and recorded in United Kingdom in GBIF occurrence data (plant).
ThreatenedAnguilla anguillaNot evaluated on the IUCN Red List, and recorded in United Kingdom in GBIF occurrence data (species).
Critically Endangered, the last IUCN category before Extinct in the Wild, and still recorded in United Kingdom. GBIF holds 4 verified occurrence records.
Lepidochelys kempii
Critically Endangered, the last IUCN category before Extinct in the Wild, and still recorded in United Kingdom. GBIF holds 1 verified occurrence records.
Galeorhinus galeus
Critically Endangered, the last IUCN category before Extinct in the Wild, and still recorded in United Kingdom. GBIF holds 4 verified occurrence records.
Species named here are drawn from GBIF occurrence records for United Kingdom filtered to the IUCN Red List threatened categories. Species are listed where GBIF holds occurrence records for them in this country. Record counts are not published here because the figure cannot be reproduced from a public GBIF query.
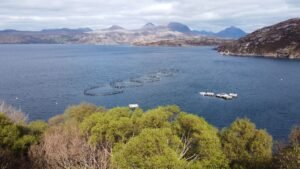
Marine protected area in Scotland, mapped and named in the open record for United Kingdom. OpenStreetMap.
Water and Ocean in the United Kingdom.
The UK relies on its own rainfall, upland reservoirs, rivers and aquifers, and 99.8% of people have safely managed drinking water (World Bank and JMP, 2024). Tap water is safe everywhere. The main weakness is the drier south east, which is officially water stressed and prone to hosepipe bans, alongside high leakage from ageing pipes.
Does the United Kingdom have enough fresh water? Yes, with headroom
99.8% of people here have safely managed drinking water at home (2024, WHO/UNICEF JMP). Tap water is safe for a visitor nearly everywhere.
Cleanest water: Upland Wales, the Lake District and the Scottish lochs
How much fresh water does the United Kingdom have, per person?
2,144 m³
United Kingdom
1,000 m³
the UN “water scarce” line
United Kingdom withdraws about 8,419 million cubic metres of fresh water a year (2022). That is 14.4% of the fresh water actually available to it, which FAO counts as low water stress. Of what is taken, farming takes 14%, homes and towns 74%, industry 12%. Source: FAO AQUASTAT.
What are the rules on United Kingdom beaches?
✓Tap water: Drinkable.
✓Plastic rules: Carrier bag charge plus bans on microbeads and single use straws, stirrers, plates and cutlery.
✓Solo travel: rated easy on the record for this destination.
✓Marine protection: 46.8% of the sea is protected. The 30x30 pledge is met.
Named on the open map: Abbot's Cliff Beach, Avon Beach, Blackpool Sands, Branscombe Beach, Denge Beach, Fossil Beach, Giggen Cove, Hele Beach. That is 14 named beaches in the public record for United Kingdom, each one a place you can look up before you go. OpenStreetMap.
Where does the sewage go?
97.8%
of people have safely managed sanitation
97.8% of people here use a safely managed sanitation service, meaning waste is contained, emptied and treated rather than reaching the ground or the sea untreated (2024, World Bank / WHO-UNICEF JMP, SDG 6.2.1). That is close to universal coverage.
How is the sea around United Kingdom doing?
One cross-section, every answer measured.
Surface
What the coast carries
Mild and changeable all year; summer is genuinely lovely, winter is short and damp.
Nearshore
Protected water
46.8% of territorial waters are protected, against the 30% pledged for 2030 under the Global Biodiversity Framework.
Cleanest
Where the water is cleanest
Upland Wales, the Lake District and the Scottish lochs.
The record
Measured
The UK relies on its own rainfall, upland reservoirs, rivers and aquifers, and 99.8% of people have safely managed drinking water (World Bank and JMP, 2024). Tap water is safe everywhere.
Sea protected
46.8%
Against the 30% pledged for 2030 under the Global Biodiversity Framework.
Threatened species
165
Mammals, birds, fish and higher plants on the IUCN list.
Cleanest water
here
Upland Wales, the Lake District and the Scottish lochs.
Is the tap water safe in United Kingdom?
99.8% of people have safely managed drinking water at home (2024, WHO/UNICEF JMP). Renewable fresh water works out at about 2,144 cubic metres per person a year (World Bank).
How hard is the water supply being pushed?
Of every 10 buckets nature refills, 1 are already taken. Withdrawals run at 14.3% of what the United Kingdom renews internally each year (2022, World Bank / FAO AQUASTAT). That is inside the 25% mark generally treated as water stress, so the supply has headroom.
When is the best time to visit United Kingdom? Tap your month.
Tap your month.
JanFebMarAprMayJunJulAugSepOctNovDec
.
How much fresh water does United Kingdom actually have?
Nature renews about 2,144 cubic metres of fresh water per person per year here. That ranks the United Kingdom 83 of 208 countries measured, putting it in the drier half of the world. The UN treats anything under 1,000 cubic metres as water scarce, and this is above that line. World Bank / FAO AQUASTAT.
The UK produced about 58% of the food it consumed in 2023, importing the remaining 42% (DEFRA, Agriculture in the United Kingdom 2023). It is a capable farming nation for cereals, dairy, lamb and root crops, but leans on imports for fruit, much fresh produce and out of season goods.
Where does the food in United Kingdom come from?
9.8% imported
about US$93,032m a year
On the plate: Potatoes, oats, wheat, brassicas, apples
How often each food is on the plate
Share of people eating each one regularly. These overlap, so they do not add up to 100%.
Potatoes60%
Oats51%
Wheat42%
Brassicas33%
Apples24%
1 of 10
bites are imported
The island buys in more food energy than it eats. About US$93,032m a year leaves the country to pay for it. The green slice is roughly what still grows here.
Food is 9.8% of everything the United Kingdom imports (2025, World Bank). Farming itself is 0.6% of the economy and 70.3% of the land is agricultural, of which 25% is arable. The green slice is roughly what still grows here.
What is killing people in the United Kingdom? The imported diet.
Cause of death, and the diet behind it.
Non-communicable diseases, all combined79.7%
Diabetes7.4%
Adults living with overweight or obesity. 61.4%.
Can the United Kingdom feed itself?
25.0%
Arable land
70.3%
Agricultural land
301,423
Farmers
14,934,264
Arable acres
0.6%
Agriculture, share of GDP
Harvest: Late summer to autumn; cereals August to September, apples September to October
Feeding itself
The UK produced about 58% of the food it consumed in 2023, importing the remaining 42% (DEFRA, Agriculture in the United Kingdom 2023). It is a capable farming nation for cereals, dairy, lamb and root crops, but leans on imports for fruit, much fresh produce and out of season goods.
Certification
Organic farmland is about 2.7% of agricultural land (FiBL, 2020), supported by well established Soil Association certification and a sizeable organic retail market. The share is modest and has grown only slowly.
Water for crops
The UK relies on its own rainfall, upland reservoirs, rivers and aquifers, and 99.8% of people have safely managed drinking water (World Bank and JMP, 2024). Tap water is safe everywhere.
Why the organic number looks like that. Certified-organic farmland is not separately reported for the United Kingdom, and that is a certification gap rather than proof nothing is grown cleanly. What the official land record does show: 70.3% of the country is agricultural land and 25% is arable (2023, World Bank). Certification is paid for per farm per year by a foreign body, which prices out smallholders, so the organic number reads worse than the practice.
What actually grows here
WheatSugar beetsBarleyPotatoesRapeseedOats
The food that already fits
The plant-based kitchen here is not an import. By tonnage, the largest crops grown in United Kingdom are wheat, sugar beet, barley and potatoes (FAO, FAOSTAT crop production, 2024). That is what the land itself puts on a plate.
Buy direct where residents buy: Apple Market, Bermondsey Farmers' Market, Blackheath Farmers' Market, Broadgate Farmers' Market, Buxton Market, Cheadle Market. Each is a mapped, named marketplace, so the money stays with the seller rather than the importer. OpenStreetMap.
Checked kitchens from the directory: Vantra Vegan → Vantra Vegan is a 100% plant based restaurant in London, United Kingdom. See its verified sustainability ratin. Every kitchen listed here is checked for how plant-based the menu really is before it earns its place.
Renewables generated a record 50.4% of United Kingdom electricity in 2024, led by wind at about 29%, and the country closed its last coal-fired power station at Ratcliffe-on-Soar in September 2024, ending 142 years of coal power. Territorial CO2 emissions have fallen to about 4.53 tonnes per person (2024), near the world average. The United Kingdom has a legally binding target of net zero by 2050 under the Climate Change Act, supported by interim carbon budgets. Even so, gas still supplies a large share of power and heat, which keeps the score in the moderate band rather than high.
What powers the United Kingdom?
Renewable 52%Fossil 35.6%
Climate pollution per person
The safe amount, what the planet can absorb
2 tonnes
One person here
4.22 tonnes
The world average, for comparison
4.7 tonnes
The worst it ever got
12.28 tonnes
The grid
Renewables generated a record 50.4% of United Kingdom electricity in 2024, led by wind at about 29%, and the country closed its last coal-fired power station at Ratcliffe-on-Soar in September 2024, ending 142 years of coal power. Territorial CO2 emissions have fallen to about 4.53 tonnes per person (2024), near the world average.
Pollution
Air is comparatively clean, with a PM2.5 annual mean around 9.5 micrograms per cubic metre (World Bank, 2023), and the UK has a carrier bag charge, a microbead ban and bans on single use plastic straws, stirrers, plates and cutlery. Litter and fly tipping remain persistent problems, which keeps this short of the top band.
Water stress
The UK relies on its own rainfall, upland reservoirs, rivers and aquifers, and 99.8% of people have safely managed drinking water (World Bank and JMP, 2024). Tap water is safe everywhere.
What pollutes most here
1The gridThe share of electricity still generated from fossil fuel.59.8%
2IndustryLegacy road traffic air pollution in city centres.named
3AirModelled annual mean against a WHO guideline of 5 µg/m³.9.5
4On the recordAir is comparatively clean, with a PM2.5 annual mean around 9.5 micrograms per cubic metre (World Bank, 2023), and the UK has a carrier bag charge, a microbead ban and bans on single use plastic straws, stirrers, plates and cutlery.
What has the United Kingdom promised on climate?
Net zero, whole economy2050
Electricity renewable today40.2% (2021)
Land protected, against a 30% target28.4% by 2025
Sea protected, against a 30% target46.8% by 2025
The net-zero target year on file with Climate Watch is 2050, status: in law; in policy document. Measured against it, 40.2% of electricity is already renewable (2021, World Bank), so 59.8% of the grid is still to be converted. The pledge on file is measured here against what has actually been delivered, not taken on its own (UNFCCC NDC Registry, CBD Kunming-Montreal Target 3).
The biggest line item
One return flight against a whole year of living.
A resident's entire year4.22 t CO2e
Safe-climate budget, per year2 t CO2e
Sydney return, economy3.06 t CO2e
Singapore return, economy1.96 t CO2e
Johannesburg return, economy1.63 t CO2e
Los Angeles return, economy1.58 t CO2e
New York return, economy1 t CO2e
How much CO2 does flying to the United Kingdom emit?
Tap where you would fly from. One return flight, economy.
Every prompt runs on a machine in a building on somebody’s grid. What that costs the planet depends less on the prompt than on what is burning to power it. Here is what would power one in the United Kingdom.
Data centres
248
Operational facilities, Cloudscene, July 2026.
Grid renewable
52.0 %
What a machine here runs on.
What powers a data centre in the United Kingdom?
A machine here runs mostly on renewables, but not entirely.
Renewable 52%Fossil 48%
Cooling water. Every one of those halls runs on the national grid, which is 40.2% renewable today (World Bank). A data centre is only as clean as the electricity behind it, so the same figure that decides this country's climate score also decides the footprint of the AI running inside it. Cooling water use is not separately published by facility, and no operator here reports it.
The rules. United Kingdom has 248 colocation and interconnection facilities on the public PeeringDB register, concentrated in London (45), Slough (20), Manchester (17), alongside 29 internet exchanges (LINX LON1, LONAP, LINX LON2, IXLeeds). Named sites include Telehouse, London (Docklands North), Digital Realty London LHR17, Telehouse, London (Docklands East), Digital Realty London LHR20.
Where the cables land. 125 landing points · Aberdeen, Achnaba, Aikerness Bay, Aldeburgh
63% residents to 37% visitors across a year. 40,857,000 international arrivals in 2019 against 69,487,000 people who live here (2025, World Bank / UN Tourism).
Where a visitor dollar goes in United Kingdom
11,101k
Visitors a year
0.2
Visitors per resident
How deep in debt is the United Kingdom?· for every $100 the United Kingdom earns in a year, it owes…
Pay to the order of: the creditorsmemo · today
$ 104What is owed now, for every $100 of national income (2026).
IMF World Economic Outlook, 2026signed, the creditors
Pay to the order of: the creditorsmemo · projected 2031
$ 103The IMF's own forecast has this falling to $103 by 2031.
IMF World Economic Outlook projection, 2031signed, the forecast
For every $100 the United Kingdom earns in a year, it owes $104 (2026, IMF World Economic Outlook). That is more than a full year of national income, and the interest is paid before anything else.
Where does a tourist dollar actually go in the United Kingdom?
Play one tourist dollar around the board. Every square is a measured fact from this page.
START!
1
GO: a visitor lands
$100 goes on the table. 40,857,000 international arrivals in 2019 against 69,487,000 residents, 0.6 visitors for every resident (World Bank / UN Tourism).
$100 in play
2
The bed
Who owns the largest places to stay in the United Kingdom is not published in the records we can check, so this square is left open rather than guessed. Where a listing names its owner, it is shown in the ownership table below.
not published
3
The plate
Food is only 9.8% of everything the United Kingdom imports (2025, World Bank), so most of a meal is bought from producers inside the country. Eating what the land here actually grows, wheat, sugar beets, barley, potatoes, rapeseed, oats, keeps that money with the grower.
mostly home-grown
4
The power
40.2% of the electricity is renewable (2021, World Bank), so the energy on the bill is mostly generated inside the country rather than shipped in.
made at home
5
What actually stays
Of the two parts of a visitor's bill that can be measured here, the plate and the power stay inside the United Kingdom. This is not an economy where a visitor's money drains away, and the board is shorter for it.
most of it
6
Pay the bank first
The United Kingdom owes $104 for every $100 it earns (IMF World Economic Outlook, 2026 projection). The interest is paid before anything else on this board.
$104 per $100
7
A spread hand
The largest single export, machinery and mechanical appliances, is 16.6% of the total (2023, UN Comtrade). No one shock can take the whole board.
top export 16.6%
8
Community chest
Tourism earns 8.2% of everything the United Kingdom makes from exports (1998, World Bank / UN Tourism). That is how much of the economy depends on the game continuing.
8.2% of exports
9
The flight
Getting here is usually the biggest single line on the bill. From Sydney a return economy seat is 3.06 t CO2, on the UK Government's published conversion factors. It is the one part of the trip this board cannot reduce.
3.06 t CO2
10
Back to GO
The economy turns over about US$4,265 billion a year (IMF World Economic Outlook, 2026 projection). Every lap of this board is a choice about how much of it stays.
US$4,265bn
GDPUS$4,002.6bn
Agriculture, share of GDP0.6%
Visitors a year11,101,000
Visitors per resident0.2
Residents~69,487,000
Agriculture
Farming is 0.6% of the economy. The UK produced about 58% of the food it consumed in 2023, importing the remaining 42% (DEFRA, Agriculture in the United Kingdom 2023).
Natural materials
The UK has genuinely living natural fibre traditions. Harris Tweed is hand woven from pure new wool in the Outer Hebrides and protected by its own Act of Parliament, and British wool, Fair Isle knitting and Irish linen all remain in production.
Energy
Renewables generated a record 50.4% of United Kingdom electricity in 2024, led by wind at about 29%, and the country closed its last coal-fired power station at Ratcliffe-on-Soar in September 2024, ending 142 years of coal power. Territorial CO2 emissions have fallen to about 4.53 tonnes per person (2024), near the world average.
Who owns the biggest hotels in the United Kingdom?
By rooms · company records and press.
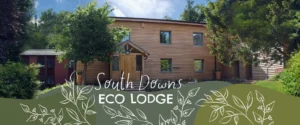
South Downs Eco Lodge · ~14 roomsIndependentnot published
The 25 Boutique B&B · ~6 roomsIndependentnot published
Cornish Gems Dune Hideaway · ~1 roomsIndependentnot published
Cornish Gems Killifreth Stamps · ~1 roomsIndependentnot published
Cornish Gems Boslagen · ~1 roomsIndependentnot published
Cornish Gems Alta · ~1 roomsIndependentnot published
Elmley Nature Reserve · ~12 roomsIndependentnot published
Adagio Stratford London · ~136 roomsCorporatenot published
Cambrian Cottages · ~5 roomsIndependentnot published
Cuffern Manor Guest House · ~11 roomsIndependentnot published
Visitors, over time
201536,792k
201639,129k
201741,080k
201840,283k
201940,857k
202011,101k
How much of your money actually stays here?
Tap the holiday you are planning.
All-inclusive resortForeign-owned hotel and tourist restaurantsLocally owned stay and local restaurantsGuesthouse, markets and public transport
Resort guest, villa renter, family, nomad or backpacker. The honest playbook for each, from the same sourced numbers.
Already booked a resort? · the rescue list
Five swaps that move your money back on-island
1. Eat where the country eats Choose kitchens cooking what the land here grows, wheat, sugar beets, barley, potatoes, rapeseed and oats, over an imported menu. The checked list →
2. Book with a local operator Never the lobby desk. The margin on a tour is the part that stays. Eco tours →
3. Stay somewhere locally owned Ownership decides where the room rate books. Eco stays →
4. Use the transport residents use An extensive rail network, coaches and car hire; cities are walkable with public transport
5. Buy the craft, not the souvenir Natural-materials work made here pays the maker directly; imported gifts pay a shipping line.
swipe →
First time here
A wealthy island nation with safe water, clean air and living wool traditions, yet ranked among the most nature depleted countries on Earth.
Best time: Late spring to early autumn
Getting around
An extensive rail network, coaches and car hire; cities are walkable with public transport
Transport is where the fare either stays or leaves.
Eating here
The everyday plate that actually grows here is wheat, sugar beets, barley, potatoes, rapeseed and oats. Ordering those keeps the money with the grower and cuts the imported share of the meal.
Eating what the country grows is the cheapest way to cut the import bill.
Good to know
Cards everywhere; GBP. Queue politely; drive on the left.
None of the 10 properties listed here publishes who ultimately owns it, so no claim is made either way. Ownership is what decides how much of a room rate stays in the country, which is why we show it when a listing states it.
Society and Governance in the United Kingdom.
How well is the United Kingdom actually run?
Governance, measured · World Bank WGI
Four measured answers, none of them opinion. Averaged across corruption control, delivery and accountability, the United Kingdom scores 77 out of 100 (2024, World Bank Worldwide Governance Indicators). That is a state that generally does what it says it will do, which is what makes a climate pledge worth reading.
How well is United Kingdom run? · each scored out of 100, higher is better
Clean government, scored 78 of 100
Control of corruption scores 78.4 out of 100 (2024, World Bank Worldwide Governance Indicators). That puts it in the cleanest quarter of governments measured.
78
Freedom and rights, scored 80 of 100
Voice and accountability, which measures free expression, free media and the ability to choose a government, scores 79.6 out of 100 (2024, World Bank WGI). Citizens here can question their government openly.
80
Government effectiveness, scored 74 of 100
Government effectiveness, which measures the quality of public services and how well policy is actually delivered, scores 74.4 out of 100 (2024, World Bank WGI). Delivery is rated above average.
74
Income equality, scored 32 of 100
The Gini index of income inequality reads 32.4 (2021, World Bank). Zero is perfect equality and 100 is one person holding everything. Below 40 is the level usually treated as manageable, and the United Kingdom sits inside it.
32
LGBTQ+ status: HighSolo female travel: EasyIndustry to avoid: Legacy road traffic air pollution in city centres
What is daily life in United Kingdom really like? Measured
Getting around, breathing, throwing away, learning. The honest checklist.
TransportAirWaterWastePower
✓How you get around An extensive rail network, coaches and car hire; cities are walkable with public transport
✓Air quality, measured Modelled annual mean 9.5. The WHO guideline is 5 µg/m³.
✓Where the air is cleanest The Scottish Highlands and the Hebrides
✓Tap water Drinkable
✓What to drink Tap water is safe nationwide.
✓Plastic rules Carrier bag charge plus bans on microbeads and single use straws, stirrers, plates and cutlery
✓Sockets and voltage Type C/F, 230V
Made in the United Kingdom.
The UK has genuinely living natural fibre traditions. Harris Tweed is hand woven from pure new wool in the Outer Hebrides and protected by its own Act of Parliament, and British wool, Fair Isle knitting and Irish linen all remain in production. Every step of processing done at home is value that stops leaving the country.
What United Kingdom actually sells the world
The single biggest thing United Kingdom sells the world is machinery and mechanical appliances, 16.6% of all exports in 2023 (about US$86.57 billion, UN Comtrade). The next four are pearls, gemstones and precious metals at 15.5%, vehicles at 9.7%, mineral fuels and oils at 8.2%, electrical machinery and electronics at 5.5%.
Sells now · 16.6% of exports
Machinery and mechanical appliances
Machinery and mechanical appliances is 16.6% of everything United Kingdom sold abroad in 2023, worth about US$86.57 billion. UN Comtrade.
Sells now · 15.5% of exports
Pearls, gemstones and precious metals
Pearls, gemstones and precious metals is 15.5% of everything United Kingdom sold abroad in 2023, worth about US$80.79 billion. UN Comtrade.
Sells now · 9.7% of exports
Vehicles
Vehicles is 9.7% of everything United Kingdom sold abroad in 2023, worth about US$50.32 billion. UN Comtrade.
Sells now · 8.2% of exports
Mineral fuels and oils
Mineral fuels and oils is 8.2% of everything United Kingdom sold abroad in 2023, worth about US$42.67 billion. UN Comtrade.
Sells now · 5.5% of exports
Electrical machinery and electronics
Electrical machinery and electronics is 5.5% of everything United Kingdom sold abroad in 2023, worth about US$28.47 billion. UN Comtrade.
Could make · grown here already
Potatoes
Grown in United Kingdom and mostly sold raw. Processing it here would keep the margin here.
Could make · grown here already
Oats
Grown in United Kingdom and mostly sold raw. Processing it here would keep the margin here.
Could make · grown here already
Wheat
Grown in United Kingdom and mostly sold raw. Processing it here would keep the margin here.
The maths for an entrepreneur. the United Kingdom produces about US$4,003 billion a year, which is roughly US$57,602 per person (2025, World Bank). Farming is 0.6% of that, while food is 9.8% of everything the country imports. The country buys in more food than its own farms contribute to the economy, and every point of that gap is a business someone could build here rather than ship in. With 25% of the land arable, the raw material for that is already in the ground.
A living tradition of United Kingdom, still practised rather than archived.
Well dressing
A living tradition of United Kingdom, still practised rather than archived.
Padstow's Obby Oss
A living tradition of United Kingdom, still practised rather than archived.
Shetland's Norse-rooted Up Helly Aa fire festival
A living tradition of United Kingdom, still practised rather than archived.
Does United Kingdom protect its heritage by law?
Partly, and the gaps say as much as the protections.
What is kept alive. The United Kingdom keeps notable folk traditions, though society is largely secular and modernised. Morris dancing, Highland dancing, ceilidh, maypole and rapper sword dancing survive, alongside folk song, sea shanties, bagpipes, brass bands and Welsh male voice choirs. Living calendar customs include wassailing, well dressing, Padstow's Obby Oss and Shetland's Norse-rooted Up Helly Aa fire festival, and the Welsh National Eisteddfod sustains a bardic Gorsedd tradition.
Who it belongs to. The UK has deep living heritage and some community ownership, including Scottish community land buyouts such as the Isle of Eigg and continuing crofting. Tourism, though, is overwhelmingly commercial rather than community run, and there is no indigenous community tourism economy of the kind this index rewards.
Only here. Harris Tweed, the only cloth protected by its own Act of Parliament, hand woven in the Outer Hebrides.
Three futures for the United Kingdom, every one run forward from measured data.
Where the making actually happens
Named cultural and craft sites on the open map: Pip Wine Shop (Guildford), Sheffield Botanical Gardens (Sheffield), Fletcher Moss Botanical Garden (Manchester), Birmingham Botanical Gardens (Birmingham), Botanical Gardens (Bath). OpenStreetMap. Named craft workshops on the open map: Art Official, Barnet Gallery, Bay Wool & Crafts, Bead Solutions, Betws-y-Coed Pottery, Build Brighton.
Every measured trend on one line
Run forward at the pace already recorded.
+12%
Forest cover
1995: 11.8 % → 2023: 13.3 %
+1854%
Renewable electricity
1995: 2.1 % → 2021: 40.2 %
-55%
CO2 per person
1995: 9.45 t → 2024: 4.22 t
-53%
Tourist arrivals
1995: 23537 k → 2020: 11101 k
+1%
Protected land
2013: 28 % → 2025: 28.4 %
-63%
Farm workforce
1995: 2.29 % → 2025: 0.85 %
+721%
Protected sea
2013: 5.7 % → 2025: 46.8 %
-2%
Agricultural land
1995: 71.8 % → 2023: 70.3 %
+6%
Urban population
1995: 78.7 % → 2025: 83.3 %
-52%
Air pollution
1995: 19.8 µg/m³ → 2023: 9.5 µg/m³
-14%
Fresh water per person
1995: 2499.2 m³ → 2022: 2143.8 m³
+20%
Adult overweight
1995: 51.3 % → 2022: 61.4 %
+0%
Electricity access
1995: 100 % → 2024: 100 %
+148%
GDP per person
1995: 23253 → 2025: 57602
+20%
Population
1995: 58019 k → 2025: 69487 k
+1009%
Renewable energy use
1995: 1.1 % → 2021: 12.2 %
-45%
Energy per person
1995: 3730 kg → 2024: 2069 kg
+273%
Protected area, total
2013: 11.3 % → 2025: 42.1 %
+6%
Life expectancy
1995: 76.8 yrs → 2024: 81.4 yrs
+4%
Cereal yield
1995: 6873 ha → 2023: 7138 ha
-48%
Fertiliser use
1995: 369.1 ha → 2023: 191.4 ha
-22%
Rural population
1995: 21.3 % → 2025: 16.7 %
+143%
Water productivity
1995: 160.1 $/m3 → 2022: 388.9 $/m3
+56%
Health spending
2000: 7.2 % → 2024: 11.1 %
+12%
Forest area
1995: 28660 km2 → 2023: 32154 km2
-25%
Electric power use
1995: 5576 kWh → 2024: 4195 kWh
-24%
Emissions: Agriculture
1990: 66 e → 2023: 50.1 e
-27%
Emissions: Building
1990: 97.3 e → 2023: 71.4 e
-68%
Emissions: Electricity/Heat
1990: 248.9 e → 2023: 78.8 e
-47%
Emissions: Energy
1990: 570.9 e → 2023: 300.2 e
-68%
Emissions: Industrial Processes
1990: 56.7 e → 2023: 18 e
-63%
Emissions: Manufacturing/Construction
1990: 77.2 e → 2023: 28.9 e
World Bank open data, recorded series
How much forest is left?
Forest cover moved from 11.8% to 13.3% across 28 recorded years.
World Bank AG.LND.FRST.ZS
How clean is the grid?
Renewable electricity moved from 2.1% to 40.2% across 26 recorded years.
World Bank EG.ELC.RNEW.ZS
How much climate pollution per person?
CO2 per person moved from 9.5 t to 4.2 t across 29 recorded years.
World Bank EN.GHG.CO2.PC.CE.AR5
How many people visit?
Tourist arrivals moved from 23537k to 11101k across 25 recorded years.
World Bank ST.INT.ARVL
How much land is protected?
Protected land moved from 28.0% to 28.4% across 12 recorded years.
World Bank ER.LND.PTLD.ZS
How many people still farm?
Farm workforce moved from 2.3% to 0.9% across 30 recorded years.
World Bank SL.AGR.EMPL.ZS
How much sea is protected?
Protected sea moved from 5.7% to 46.8% across 12 recorded years.
World Bank ER.MRN.PTMR.ZS
How much land is farmed?
Agricultural land moved from 71.8% to 70.3% across 28 recorded years.
World Bank AG.LND.AGRI.ZS
How fast is it urbanising?
Urban population moved from 78.7% to 83.3% across 30 recorded years.
World Bank SP.URB.TOTL.IN.ZS
Is the air getting cleaner?
Air pollution moved from 19.8 µg/m³ to 9.5 µg/m³ across 28 recorded years.
World Bank EN.ATM.PM25.MC.M3
Is water getting scarcer?
Fresh water per person moved from 2499.2 m³ to 2143.8 m³ across 27 recorded years.
World Bank ER.H2O.INTR.PC
Is diet-related disease rising?
Adult overweight moved from 51.3% to 61.4% across 27 recorded years.
World Bank SH.STA.OWAD.ZS
Who has power?
Electricity access moved from 100.0% to 100.0% across 29 recorded years.
World Bank EG.ELC.ACCS.ZS
Is income rising?
GDP per person moved from 23253 to 57602 across 30 recorded years.
World Bank NY.GDP.PCAP.CD
How fast is it growing?
Population moved from 58019k to 69487k across 30 recorded years.
World Bank SP.POP.TOTL
What share of all energy is renewable?
Renewable energy use moved from 1.1% to 12.2% across 26 recorded years.
World Bank EG.FEC.RNEW.ZS
How much energy does one person use?
Energy per person moved from 3730 kg to 2069 kg across 29 recorded years.
World Bank EG.USE.PCAP.KG.OE
How much land and sea is protected together?
Protected area, total moved from 11.3% to 42.1% across 12 recorded years.
World Bank ER.PTD.TOTL.ZS
How long do people live?
Life expectancy moved from 76.84 yrs to 81.39 yrs across 29 recorded years.
World Bank SP.DYN.LE00.IN
How much does a hectare of cereal produce?
Cereal yield moved from 6873 kg/ha to 7138 kg/ha across 28 recorded years.
World Bank AG.YLD.CREL.KG
How much fertiliser goes on the land?
Fertiliser use moved from 369.1 kg/ha to 191.44 kg/ha across 28 recorded years.
World Bank AG.CON.FERT.ZS
How many people still live rurally?
Rural population moved from 21.34% to 16.68% across 30 recorded years.
World Bank SP.RUR.TOTL.ZS
How much value per cubic metre of water?
Water productivity moved from 160.1 $/m3 to 388.91 $/m3 across 27 recorded years.
World Bank ER.GDP.FWTL.M3.KD
How much goes on health?
Health spending moved from 7.15% to 11.13% across 24 recorded years.
World Bank SH.XPD.CHEX.GD.ZS
How much forest is there in total?
Forest area moved from 28660 km2 to 32154 km2 across 28 recorded years.
World Bank AG.LND.FRST.K2
How much electricity per person?
Electric power use moved from 5576 kWh to 4195 kWh across 29 recorded years.
World Bank EG.USE.ELEC.KH.PC
How have agriculture emissions moved?
Agriculture emissions moved from 66.02 to 50.09 MtCO2e across 33 recorded years.
Climate Watch (WRI), historical emissions
How have building emissions moved?
Building emissions moved from 97.33 to 71.39 MtCO2e across 33 recorded years.
Climate Watch (WRI), historical emissions
How have electricity/heat emissions moved?
Electricity/Heat emissions moved from 248.9 to 78.78 MtCO2e across 33 recorded years.
Climate Watch (WRI), historical emissions
How have energy emissions moved?
Energy emissions moved from 570.91 to 300.24 MtCO2e across 33 recorded years.
Climate Watch (WRI), historical emissions
How have industrial processes emissions moved?
Industrial Processes emissions moved from 56.73 to 17.96 MtCO2e across 33 recorded years.
Climate Watch (WRI), historical emissions
How have manufacturing/construction emissions moved?
Manufacturing/Construction emissions moved from 77.19 to 28.91 MtCO2e across 33 recorded years.
Climate Watch (WRI), historical emissions
Worst caseCurrent pathBest case
Worst case
Every measured decline continues at the pace already recorded. The weakest pillar, wildlife at 2/5, is the one that gives way first.
Computed from: recorded series extended with no policy change
Current path
Every line above is a recorded World Bank series for this country. The current path is simply those series continuing at the pace already measured.
Computed from: recorded series, no policy change assumed
Best case
The pledges are met on their own stated timetables and the weakest pillars are lifted to match the strongest. United Kingdom already shows it can do this: water scores 4/5.
Computed from: each published target delivered on its own date
What the best case actually asks for
Lift wildlife
It scores 2 out of 5 today, among the weakest parts of United Kingdom's record. The UK is one of the most nature depleted countries in the world, with heavily modified landscapes, low endemism and long term wildlife declines documented in the State of Nature 2023 report. The bright spot is rewilding: beaver reintroductions, the Knepp estate and white tailed eagle recovery are slowly rebuilding native wildlife. Lifting it toward the 4/5 the strongest pillars already reach is what the best case turns on.
measured each year
Costs: spending and enforcement, not new technology
Lift conservation
It scores 3 out of 5 today, among the weakest parts of United Kingdom's record. On paper the UK protects about 28.4% of its land and 47% of its seas (World Bank, 2025), which looks strong. In practice protection is weak: more than half of Sites of Special Scientific Interest are in unfavourable condition and many marine protected areas still permit bottom trawling, so several are effectively paper parks. Lifting it toward the 4/5 the strongest pillars already reach is what the best case turns on.
measured each year
Costs: spending and enforcement, not new technology
Lift culture
It scores 3 out of 5 today, among the weakest parts of United Kingdom's record. The UK has deep living heritage and some community ownership, including Scottish community land buyouts such as the Isle of Eigg and continuing crofting. Tourism, though, is overwhelmingly commercial rather than community run, and there is no indigenous community tourism economy of the kind this index rewards. Lifting it toward the 4/5 the strongest pillars already reach is what the best case turns on.
measured each year
Costs: spending and enforcement, not new technology
Government and Goals in the United Kingdom.
Who is in charge of United Kingdom now · Office-holders from the UN Protocol and Liaison Service public list of Heads of State and Heads of Government, 8 September 2026. Legislature and election dates from IFES ElectionGuide. Constitution dates from the Constitute Project. Governance scores from the World Bank Worldwide Governance Indicators 2024.
Andy Burnham
Prime Minister
Andy Burnham is the head of government of United Kingdom, in office since 20 July 2026. Every climate, protection and energy pledge on this page is delivered, or not, under this administration.
Public opinion, measured
Voice and accountability, the freedom to question government: 79.6 / 100. Among the strongest measured. World Bank WGI 2024
Control of corruption: 78.4 / 100. Among the strongest measured. World Bank WGI 2024
Political stability and absence of violence: 70.3 / 100. Above the halfway mark of governments measured. World Bank WGI 2024
Rule of law: 78.8 / 100. Among the strongest measured. World Bank WGI 2024
Regulatory quality: 78.7 / 100. Among the strongest measured. World Bank WGI 2024
Andy BurnhamPrime Minister
UK ParliamentLegislature, bicameral
Last election4 July 2024
Constitutionuncodified; statutes, common law and convention
Government typeparliamentary constitutional monarchy; a Commonwealth realm
United Kingdom national goals: climate commitments on record · as recorded by Climate Watch, World Resources Institute
2050
Net zero
In Law<br>In Policy Document
Net-zero target as recorded by Climate Watch. Status: In Law (6/26/2019) In Policy Document (1/30/2025, 10/19/2021, 12/11/2020) ↗
The questions people actually type, answered in full sentences from the sourced data above.
swipe →
Is United Kingdom sustainable?
United Kingdom scores 65 out of 100 on the Throne Eco Index, across twelve equally weighted pillars. A wealthy island nation with safe water, clean air and living wool traditions, yet ranked among the most nature depleted countries on Earth.
Is the water in United Kingdom safe and plentiful?
The UK relies on its own rainfall, upland reservoirs, rivers and aquifers, and 99.8% of people have safely managed drinking water (World Bank and JMP, 2024). Tap water is safe everywhere. The main weakness is the drier south east, which is officially water stressed and prone to hosepipe bans, alongside high leakage from ageing pipes.
Can United Kingdom feed itself?
The UK produced about 58% of the food it consumed in 2023, importing the remaining 42% (DEFRA, Agriculture in the United Kingdom 2023). It is a capable farming nation for cereals, dairy, lamb and root crops, but leans on imports for fruit, much fresh produce and out of season goods.
Is it easy to eat plant-based in United Kingdom?
Plant based eating is mainstream in the UK, which is where Veganuary began, and vegan and vegetarian options are standard in supermarkets, cafes and restaurants. The limitation is that much of this is processed meat substitute food rather than a whole food culture, and the traditional diet remains meat heavy.
How much of United Kingdom is actually protected?
On paper the UK protects about 28.4% of its land and 47% of its seas (World Bank, 2025), which looks strong. In practice protection is weak: more than half of Sites of Special Scientific Interest are in unfavourable condition and many marine protected areas still permit bottom trawling, so several are effectively paper parks.
What wildlife is left in United Kingdom?
The UK is one of the most nature depleted countries in the world, with heavily modified landscapes, low endemism and long term wildlife declines documented in the State of Nature 2023 report. The bright spot is rewilding: beaver reintroductions, the Knepp estate and white tailed eagle recovery are slowly rebuilding native wildlife.
Is United Kingdom on clean energy?
Renewables generated a record 50.4% of United Kingdom electricity in 2024, led by wind at about 29%, and the country closed its last coal-fired power station at Ratcliffe-on-Soar in September 2024, ending 142 years of coal power. Territorial CO2 emissions have fallen to about 4.53 tonnes per person (2024), near the world average. The United Kingdom has a legally binding target of net zero by 2050 under the Climate Change Act, supported by interim carbon budgets.
How polluted is United Kingdom?
Air is comparatively clean, with a PM2.5 annual mean around 9.5 micrograms per cubic metre (World Bank, 2023), and the UK has a carrier bag charge, a microbead ban and bans on single use plastic straws, stirrers, plates and cutlery. Litter and fly tipping remain persistent problems, which keeps this short of the top band.
Does recycling work in United Kingdom?
The UK recycles roughly 44% of household waste (DEFRA, UK statistics on waste), placing it in a solid mid to upper band. Rates have plateaued in recent years and vary widely between local authorities.
Is the farming in United Kingdom organic?
Organic farmland is about 2.7% of agricultural land (FiBL, 2020), supported by well established Soil Association certification and a sizeable organic retail market. The share is modest and has grown only slowly.
Are there natural materials and craft in United Kingdom?
The UK has genuinely living natural fibre traditions. Harris Tweed is hand woven from pure new wool in the Outer Hebrides and protected by its own Act of Parliament, and British wool, Fair Isle knitting and Irish linen all remain in production.
Is there living culture in United Kingdom?
The UK has deep living heritage and some community ownership, including Scottish community land buyouts such as the Isle of Eigg and continuing crofting. Tourism, though, is overwhelmingly commercial rather than community run, and there is no indigenous community tourism economy of the kind this index rewards.
What heritage does United Kingdom keep alive?
The United Kingdom keeps notable folk traditions, though society is largely secular and modernised. Morris dancing, Highland dancing, ceilidh, maypole and rapper sword dancing survive, alongside folk song, sea shanties, bagpipes, brass bands and Welsh male voice choirs. Living calendar customs include wassailing, well dressing, Padstow's Obby Oss and Shetland's Norse-rooted Up Helly Aa fire festival, and the Welsh National Eisteddfod sustains a bardic Gorsedd tradition.
So is the United Kingdom actually green? The measured answer
What is working: land protected at 28.4%, sea protected at 46.8%.
What is not: renewable electricity at 40.2% against a 100% mark.
United Kingdom sits 51 of 77 at 65/100. Every name links to its own destination page, built exactly like this one. The full ranking →
What is United Kingdom particularly good at?
✓Plant-based eating, scored 4/5. Plant based eating is mainstream in the UK, which is where Veganuary began, and vegan and vegetarian options are standard in supermarkets, cafes and restaurants. The limitation is that much of this is processed meat substitute food rather than a whole food culture, and the traditional diet remains meat heavy.
✓Pollution, scored 4/5. Air is comparatively clean, with a PM2.5 annual mean around 9.5 micrograms per cubic metre (World Bank, 2023), and the UK has a carrier bag charge, a microbead ban and bans on single use plastic straws, stirrers, plates and cutlery. Litter and fly tipping remain persistent problems, which keeps this short of the top band.
✓Recycling, scored 4/5. The UK recycles roughly 44% of household waste (DEFRA, UK statistics on waste), placing it in a solid mid to upper band. Rates have plateaued in recent years and vary widely between local authorities.
Where does United Kingdom score worst?
✕Natural fibres, scored 3/5. The UK has genuinely living natural fibre traditions. Harris Tweed is hand woven from pure new wool in the Outer Hebrides and protected by its own Act of Parliament, and British wool, Fair Isle knitting and Irish linen all remain in production.
✕Organic farming, scored 3/5. Organic farmland is about 2.7% of agricultural land (FiBL, 2020), supported by well established Soil Association certification and a sizeable organic retail market. The share is modest and has grown only slowly.
✕Wildlife, scored 2/5. The UK is one of the most nature depleted countries in the world, with heavily modified landscapes, low endemism and long term wildlife declines documented in the State of Nature 2023 report. The bright spot is rewilding: beaver reintroductions, the Knepp estate and white tailed eagle recovery are slowly rebuilding native wildlife.
Similar countries doing it better and worse
FranceScored on the same twelve pillars as United Kingdom.78
SwitzerlandScored on the same twelve pillars as United Kingdom.75
GermanyScored on the same twelve pillars as United Kingdom.75
IcelandScored on the same twelve pillars as United Kingdom.65
MontenegroScored on the same twelve pillars as United Kingdom.62
SerbiaScored on the same twelve pillars as United Kingdom.58
A note from the lens of mother natureswipe →
Energy, 3/5
Renewables generated a record 50.4% of United Kingdom electricity in 2024, led by wind at about 29%, and the country closed its last coal-fired power station at Ratcliffe-on-Soar in September 2024, ending 142 years of coal power. Territorial CO2 emissions have fallen to about 4.53 tonnes per person (2024), near the world average.
Food and farming, 3/5
The UK produced about 58% of the food it consumed in 2023, importing the remaining 42% (DEFRA, Agriculture in the United Kingdom 2023). It is a capable farming nation for cereals, dairy, lamb and root crops, but leans on imports for fruit, much fresh produce and out of season goods.
Heritage, 3/5
The United Kingdom keeps notable folk traditions, though society is largely secular and modernised. Morris dancing, Highland dancing, ceilidh, maypole and rapper sword dancing survive, alongside folk song, sea shanties, bagpipes, brass bands and Welsh male voice choirs.
The United Kingdom Directory.
Everything on Hold The Throne that sits in United Kingdom, checked and listed.
World Bank Worldwide Governance Indicators, 2024. Percentile among all governments measured.
Government effectiveness
74.4 / 100
World Bank Worldwide Governance Indicators, 2024. Percentile among all governments measured.
Rule of law
78.8 / 100
World Bank Worldwide Governance Indicators, 2024. Percentile among all governments measured.
Political stability
70.3 / 100
World Bank Worldwide Governance Indicators, 2024. Percentile among all governments measured.
Voice and accountability
79.6 / 100
World Bank Worldwide Governance Indicators, 2024. Percentile among all governments measured.
Environmental Performance Index
72.6 / 100 · 5 of 180
Yale Environmental Performance Index 2024, ranked 5 of 180 countries assessed.
Ecosystem vitality
72.8 / 100 · 11 of 180
Yale Environmental Performance Index 2024, ranked 11 of 180 countries assessed.
Biodiversity and habitat
71.5 / 100 · 16 of 180
Yale Environmental Performance Index 2024, ranked 16 of 180 countries assessed.
Air pollution
92.0 / 100 · 19 of 180
Yale Environmental Performance Index 2024, ranked 19 of 180 countries assessed.
Terrestrial biomes protected
87.9 / 100 · 29 of 180
Yale Environmental Performance Index 2024, ranked 29 of 180 countries assessed.
Marine protected areas
70.4 / 100 · 64 of 131
Yale Environmental Performance Index 2024, ranked 64 of 131 countries assessed.
How the United Kingdom Is Scored. The Throne Standard.
Every destination on the index is scored the same way, so a 4 in Barbados means exactly what a 4 means in Iceland. No self-declared data and no brochure claims are accepted. Every figure on this page carries its named source and year, and the history on each page names what empire took as plainly as it scores the present.
The 12 pillars every destination is scored on, equally weighted
01
Conservation
Land and sea actually protected, not pledged
02
Wildlife
What survives, what is endemic, what is lost
03
Water
Fresh water per person, and the ocean’s health
04
Food & farming
Whether the place can feed itself
05
Organic & clean
Certified land and pesticide reality
06
Climate & energy
Emissions per person, how the grid is powered
07
Waste
Where the rubbish goes, what comes back
08
Health
What people eat and die of
09
Heritage
Living culture, and what the law keeps standing
10
Ownership
Who owns the economy, how much of a dollar stays
11
Governance
Freedom, honesty, promises kept
12
Future
Measured trends run forward, pledges against pace
What each 0 to 5 pillar score means, in plain words
The institutions above are the ones cited on this page, ranked by how many of its figures they carry. This same sectioned page renders for all 77 scored destinations, each with its own researched history, comparison charts and three-way future. Read the full methodology
Every figure on this page, and where it came from: 81 sources across 30 institutions
GBIF occurrence search17 FIGURES
country GB, IUCN category Endangered, class Mammalia (taxonKey 359), Endangered on the IUCN Red List, and recorded in United Kingdom in GBIF occurrence data (mammal). check
country GB, IUCN category Endangered, class Mammalia (taxonKey 359) corroboration check
country GB, IUCN category Endangered, class Mammalia (taxonKey 359) corroboration check
country GB, IUCN category Endangered, class Mammalia (taxonKey 359) corroboration check
country GB, IUCN category Critically Endangered, class Aves (taxonKey 212), Critically Endangered on the IUCN Red List, and recorded in United Kingdom in GBIF occurrence data (bird). check
country GB, IUCN category Critically Endangered, class Aves (taxonKey 212) corroboration check
country GB, IUCN category Critically Endangered, class Testudines (taxonKey 11418114), Critically Endangered on the IUCN Red List, and recorded in United Kingdom in GBIF occurrence data (turtle). check
country GB, IUCN category Critically Endangered, class Testudines (taxonKey 11418114) corroboration check
country GB, IUCN category Critically Endangered, class Elasmobranchii (taxonKey 121), Critically Endangered on the IUCN Red List, and recorded in United Kingdom in GBIF occurrence data (shark or r check
country GB, IUCN category Critically Endangered, class Elasmobranchii (taxonKey 121) corroboration check
country GB, IUCN category Critically Endangered, class Elasmobranchii (taxonKey 121) corroboration check
country GB, IUCN category Critically Endangered, class Elasmobranchii (taxonKey 121) corroboration check
country GB, IUCN category Critically Endangered, kingdom Plantae (taxonKey 6), Critically Endangered on the IUCN Red List, and recorded in United Kingdom in GBIF occurrence data (plant). check
country GB, IUCN category Critically Endangered, all taxa, Critically Endangered on the IUCN Red List, and recorded in United Kingdom in GBIF occurrence data (species). check
country GB, IUCN category Endangered, all taxa, Endangered on the IUCN Red List, and recorded in United Kingdom in GBIF occurrence data (species). check
country GB, IUCN category Endangered, all taxa corroboration check
World Bank16 FIGURES
Forest area (% of land area) AG.LND.FRST.ZS, 2023 check
Terrestrial protected areas (% of land) ER.LND.PTLD.ZS, 2025 check
Marine protected areas (% of territorial waters) ER.MRN.PTMR.ZS, 2025 check
Renewable electricity output (% of total) EG.ELC.RNEW.ZS, 2021 check
PM2.5 mean annual exposure (micrograms per cubic metre) EN.ATM.PM25.MC.M3, 2023 check
CO2 emissions per capita EN.GHG.CO2.PC.CE.AR5, 2024 check
section 7, Definition of Harris Tweed, The National Archives, legislation.gov.uk, Harris Tweed, the only cloth protected by its own Act of Parliament, hand woven in the Outer Hebrides check
section 7, Definition of Harris Tweed, The National Archives, legislation.gov.uk corroboration check
section 7, Definition of Harris Tweed, The National Archives, legislation.gov.uk corroboration check
section 7, Definition of Harris Tweed, The National Archives, legislation.gov.uk corroboration check
UNESCO Institute for Statistics4 FIGURES
public data API, indicator XGDP.FSGOV, Government expenditure on education as a percentage of GDP, United Kingdom, Public spending on education runs at 5.9% of GDP and 11.8% of all government spending, and secondary enrolment check
public data API, indicator XGDP.FSGOV, Government expenditure on education as a percentage of GDP, United Kingdom corroboration check
public data API, indicator XGDP.FSGOV, Government expenditure on education as a percentage of GDP, United Kingdom corroboration check
public data API, indicator XGDP.FSGOV, Government expenditure on education as a percentage of GDP, United Kingdom corroboration check
BirdLife International, IUCN and UNEP-WCMC3 FIGURES
UN SDG Global Database, terrestrial Key Biodiversity Areas covered by protected areas (%) ER_PTD_TERR, United Kingdom, 2025 (86.8%), country-reported check
UN SDG Global Database, marine Key Biodiversity Areas covered by protected areas (%) ER_MRN_MPA, United Kingdom, 2025 (85.4%), country-reported check
UN SDG Global Database, freshwater Key Biodiversity Areas covered by protected areas (%) ER_PTD_FRHWTR, United Kingdom, 2025 (91.0%), country-reported check
DEFRA3 FIGURES
Agriculture in the United Kingdom 2023 (food security), 2024 check
UK statistics on waste (household recycling around 44%), 2024 check
UK statistics on waste (waste from households, 2023) check
FAO, Global Forest Resources Assessment3 FIGURES
UN SDG Global Database, forest area (% of land area) AG_LND_FRST, United Kingdom, 2025 (13.6%), country-reported check
UN SDG Global Database, forest area under a long-term management plan (%) AG_LND_FRSTMGT, United Kingdom, 2025 (60.7%), country-reported check
UN SDG Global Database, forest area inside legally established protected areas (%) AG_LND_FRSTPRCT, United Kingdom, 2025 (9.2%), country-reported check
Other published sources3 FIGURES
Not Evaluated (NE); Andrena bicolor has never been assessed globally, though 168 other Andrena species have check
Not Evaluated (NE); Gemmabryum dichotomum is absent from the IUCN Red List checklist published 28 July 2026 check
Dominant between 1640 and 1807; The National Archives estimates 3.1 million transported and 2.7 million arriving. The single-century superlative is not supported by any source I could open, and British dominance ended with abolition in 1807, not in 1866 check
UN Comtrade Database3 FIGURES
UN Department of Economic and Social Affairs Statistics Division, annual HS exports, reporter United Kingdom (826), 2023, The largest single export, machinery and mechanical appliances, is 16.6% of the total (2023, UN Comtrade). check
UN Department of Economic and Social Affairs Statistics Division, annual HS exports, reporter United Kingdom (826), 2023 corroboration check
UN Department of Economic and Social Affairs Statistics Division, annual HS exports, reporter United Kingdom (826), 2023 corroboration check
FAOSTAT2 FIGURES
Crops and livestock products (QCL), FAO, area United Kingdom of Great Britain and Northern Ireland (229), element Production, year 2024, By tonnage, the largest crops grown in United Kingdom are wheat, sugar beet, barley and potatoes (FAO, FAOSTAT check
Crops and livestock products (QCL), FAO, area United Kingdom of Great Britain and Northern Ireland (229), element Production, year 2024 corroboration check
Gallois2 FIGURES
R.W. (2007), 'The formation of the hot springs at Bath Spa, UK', Geological Magazine 144(4), Cambridge University Press, The thermal springs at Bath, the only natural hot springs in Britain check
R.W. (2007), 'The formation of the hot springs at Bath Spa, UK', Geological Magazine 144(4), Cambridge University Press corroboration check
IUCN Red List Categories and Criteria2 FIGURES
Version 3.1, Second edition, IUCN Species Survival Commission, IUCN Library System, Critically Endangered, the last IUCN category before Extinct in the Wild, and still recorded in United Kingdom check
Version 3.1, Second edition, IUCN Species Survival Commission, IUCN Library System corroboration check
WHO/UNICEF Joint Monitoring Programme2 FIGURES
UN SDG Global Database, population using safely managed drinking water (%) SH_H2O_SAFE, United Kingdom, 2024 (99.8%), modelled estimate check
UN SDG Global Database, population using safely managed sanitation (%) SH_SAN_SAFE, United Kingdom, 2024 (97.8%), modelled estimate check



 FranceScored on the same twelve pillars as United Kingdom.78
 SwitzerlandScored on the same twelve pillars as United Kingdom.75
 GermanyScored on the same twelve pillars as United Kingdom.75
 IcelandScored on the same twelve pillars as United Kingdom.65
 MontenegroScored on the same twelve pillars as United Kingdom.62
 SerbiaScored on the same twelve pillars as United Kingdom.58