Destinations › Central America · The Destination Index · universal template · every figure sourced
Panama.
Central America, bordering both the Caribbean Sea and the North Pacific Ocean, between Colombia and Costa Rica. 75,420 sq km and 4,571,189 people, 2,490 km of coastline, tropical maritime; hot, humid, cloudy; prolonged rainy season (May to January), short dry season (January to May).
Region · Central AmericaPopulation · ~4,571,189Languages · Spanish, Ngabere, Guna, Embera, Panamanian Creole EnglishEco Index · 77/100 · Good
The Eco Index across 12 pillars · scored 0 to 5 · World Bank, OWID, WHO/UNICEF JMP, FiBL, Protected Planet, IUCN, UNESCO (2023-24)
Conservation
Wildlife
Water
Food & farming
Organic & clean
Climate & energy
Waste
Health
Heritage
Ownership
Governance
Future
The History of Panama.
Panama holds vibrant living heritage across indigenous, Afro-Panamanian and mestizo communities. The tamborito is the national dance, and Afro-Panamanian Congo culture, with its dances, music and rituals, is inscribed on UNESCO's intangible heritage list, as are the dances and expressions associated with the Corpus Christi festivity, inscribed for Panama as a whole in 2021, in which performers stage the battle between St Michael the Archangel and the devils.
Where the name comes from
Usually given as an Indigenous word read as 'abundance of fish' or 'many butterflies'. Source: national and regional toponymic records.
The land itself: steep, rugged mountains through the interior with dissected upland plains, and rolling coastal plains on both sides. Its high point is Volcán Barú, 3,475 m. Source: national mapping and survey records.
Where it starts
Among the oldest pottery in the Americas
Monagrillo ware, made between about 3520 and 1300 BC, is the earliest pottery in Panama and among the oldest anywhere in the Americas, found in shell middens on the Azuero Peninsula and in rock shelters across the foothills and Caribbean slopes. At Sitio Conte in Cocle, a necropolis used between AD 450 and 900 held goldwork of extraordinary quality: embossed plaques, nose ornaments, gold-sheathed ear rods and pendants cast by the lost-wax method. Guna, Ngabe, Bugle, Embera and Wounaan peoples hold recognised territories in Panama today.
How it got here
A crossing point
Panama City was founded on the Pacific coast in 1519 and became the crossing point for silver moving from South America to Spain. Independence from Spain came in 1821, separation from Colombia in 1903, and full control of the canal passed to Panama on 31 December 1999.
The timeline
3800 to 1200 BC
Monagrillo, the first pottery.
Monagrillo ware is the earliest pottery in Panama and among the oldest in the Americas, found in shell middens on the Azuero Peninsula and in rock shelters across the foothills and Caribbean slopes. ↗
AD 450 to 900
Sitio Conte.
A necropolis in Cocle province near Parita Bay, and a defining example of a ranked chiefdom society, dated by its goldwork and polychrome ceramics. ↗
AD 700 to 1100
Goldwork.
Embossed plaques, nose ornaments, gold-sheathed ear rods, bells, beads and pendants cast by the lost-wax method were made and buried here. The site was excavated between 1930 and 1933. ↗
Before 1501
Guna, Ngabe and Embera.
Peoples across the isthmus held distinct territories and languages. Several, including the Guna, Ngabe, Bugle, Embera and Wounaan, hold recognised territories today. ↗
1501
European contact.
Rodrigo de Bastidas sails the Caribbean coast of the isthmus in 1501, among the first Europeans to reach it. Within a decade the isthmus became the crossing point between the Atlantic and the Pacific. ↗
1519
Panama City founded.
The city is founded on the Pacific coast and becomes the crossing point for silver moving from South America to Spain. ↗
1821
Independence from Spain.
The isthmus becomes independent from Spain and joins Gran Colombia. ↗
1903
Separation from Colombia.
Panama separates from Colombia, and canal construction follows. ↗
1999
The canal returns.
Full control of the Panama Canal passes to Panama on 31 December. ↗
Terrestrial protected areas cover about 31.4 percent of the land (World Bank, 2021), including the UNESCO listed Darien and La Amistad parks and Coiba National Park, a former penal island whose isolation preserved outstanding marine and forest life. Marine protection stood at about 26.8 percent in 2021, and Panama expanded it sharply in 2023 by enlarging the Cordillera de Coiba reserve, reporting more than 30 percent of its waters protected. Coverage is strong, though Darien faces logging and migration pressure.
Is wild Panama protected? 31.4% of the land is, already past the 30% target for 2030
How protected is nature in Panama?
Forest cover56.5%
Terrestrial protected area31.37%
Marine protected area26.3%
403 (mammals, birds, fish & plants) listed as threatened.
Critically Endangered, the last IUCN category before Extinct in the Wild, and still recorded in Panama. GBIF holds 19 verified occurrence records.
Hawksbill (Eretmochelys imbricata)
Critically Endangered, the last IUCN category before Extinct in the Wild, and still recorded in Panama. GBIF holds 187 verified occurrence records.
Lemur Leaf Frog (Agalychnis lemur)
Critically Endangered, the last IUCN category before Extinct in the Wild, and still recorded in Panama. GBIF holds 16 verified occurrence records.
Reef starlet coral (Siderastrea siderea)
Critically Endangered, the last IUCN category before Extinct in the Wild, and still recorded in Panama. GBIF holds 55 verified occurrence records.
Species named here are drawn from GBIF occurrence records for Panama filtered to the IUCN Red List threatened categories. Species are listed where GBIF holds occurrence records for them in this country. Record counts are not published here because the figure cannot be reproduced from a public GBIF query.
Nature reserve in Panamá Province, mapped and named in the open record for Panama. OpenStreetMap.
Water and Ocean in Panama.
High rainfall and the Panama Canal watershed, centred on Gatun and Alhajuela lakes, give Panama abundant freshwater, and Panama City is one of the few Latin American capitals where the tap water is generally safe to drink. Pressure is rising, though: record droughts in 2023 and 2024 lowered Canal reservoirs and rationed shipping, and rural and Guna Yala island communities face supply gaps. A national safely managed drinking water figure is not published, but at least basic water reaches about 96 percent of people.
Does Panama have enough fresh water? Yes, with headroom
Panama City tap water is drinkable; elsewhere stick to bottled.
Cleanest water: Coiba National Park; Guna Yala (San Blas); Bocas del Toro
How much fresh water does Panama have, per person?
31,040 m³
Panama
1,000 m³
the UN “water scarce” line
Panama withdraws about 1,211 million cubic metres of fresh water a year (2022). That is 0.9% of the fresh water actually available to it, which FAO counts as no water stress. Of what is taken, farming takes 37%, homes and towns 63%, industry 1%. Source: FAO AQUASTAT.
What are the rules on Panama beaches?
·Tap water: Varies.
✓Plastic rules: Yes, single use plastic bags banned under Law 1 of 2018.
✕Solo travel: rated take care on the record for this destination.
✕Marine protection: 26.84% of the sea is protected. The 30x30 pledge for 2030 is not met yet.
Named on the open map: Playa Bluff, Playa Candelaria, Playa El Rompio, Playa El Salado, Playa El Toro, Playa Grande, Playa La Honda, Playa Los Bajaderos de La Candelaria. That is 19 named beaches in the public record for Panama, each one a place you can look up before you go. OpenStreetMap.
How is the sea around Panama doing?
One cross-section, every answer measured.
Surface
What the coast carries
Dry Jan–Apr, wet May–Dec; Caribbean coast is wetter year-round.
Nearshore
Protected water
26.3% of territorial waters are protected, against the 30% pledged for 2030 under the Global Biodiversity Framework.
Cleanest
Where the water is cleanest
Coiba National Park; Guna Yala (San Blas); Bocas del Toro.
The record
Measured
High rainfall and the Panama Canal watershed, centred on Gatun and Alhajuela lakes, give Panama abundant freshwater, and Panama City is one of the few Latin American capitals where the tap water is generally safe to drink. Pressure is rising, though: record droughts in 2023 and 2024 lowered Canal reservoirs and rationed shipping, and rural and Guna Yala island communities face supply gaps.
Sea protected
26.84%
Against the 30% pledged for 2030 under the Global Biodiversity Framework.
Threatened species
403 (mammals, birds, fish & plants)
Mammals, birds, fish and higher plants on the IUCN list.
Cleanest water
here
Coiba National Park; Guna Yala (San Blas); Bocas del Toro.
How hard is the water supply being pushed?
Of every 10 buckets nature refills, 0 are already taken. Withdrawals run at 0.9% of what Panama renews internally each year (2022, World Bank / FAO AQUASTAT). That is inside the 25% mark generally treated as water stress, so the supply has headroom.
When is the best time to visit Panama? Tap your month.
Tap your month.
JanFebMarAprMayJunJulAugSepOctNovDec
.
How much fresh water does Panama actually have?
Nature renews about 31,040 cubic metres of fresh water per person per year here. That ranks Panama 190 of 208 countries measured, placing it among the 20 best-watered countries measured. The UN treats anything under 1,000 cubic metres as water scarce, and this is above that line. World Bank / FAO AQUASTAT.
Panama grows much of its own rice, plantain, maize, beef, coffee and seafood, but a service based, dollarised economy imports a substantial share of its food, especially processed goods and some staples. Farming remains important in Chiriqui and the interior. Self sufficiency in basics is moderate.
Where does the food in Panama come from?
18.7% imported
about US$4,825m a year
On the plate: Rice, beans, plantain, yuca, maize tortillas, patacones, sancocho
How often each food is on the plate
Share of people eating each one regularly. These overlap, so they do not add up to 100%.
Rice60%
Beans51%
Plantain42%
Yuca33%
Maize tortillas24%
Patacones15%
2 of 10
bites are imported
The island buys in more food energy than it eats. About US$4,825m a year leaves the country to pay for it. The green slice is roughly what still grows here.
About 18.7% of everything Panama buys in from abroad is food, roughly 2 in every 10 imported items on the dock (2024, World Bank). Farming itself is 2.6% of the economy and 29.5% of the land is agricultural, of which 7.6% is arable. The green slice is roughly what still grows here.
What is killing people in Panama? The imported diet.
Cause of death, and the diet behind it.
Non-communicable diseases, all combined66.7%
Diabetes11.1%
Adults living with overweight or obesity. 71.6%.
Can Panama feed itself?
7.6%
Arable land
29.5%
Agricultural land
366,924
Farmers
1,396,143
Arable acres
2.6%
Agriculture, share of GDP
Harvest: Coffee harvest December to March in Boquete; rice and maize through the rains
Feeding itself
Panama grows much of its own rice, plantain, maize, beef, coffee and seafood, but a service based, dollarised economy imports a substantial share of its food, especially processed goods and some staples. Farming remains important in Chiriqui and the interior.
Certification
FiBL records only about 0.3 percent of agricultural land as certified organic in 2020, roughly 5,900 hectares, mostly specialty coffee in the Boquete highlands. Certification is a small niche within otherwise conventional farming.
Water for crops
High rainfall and the Panama Canal watershed, centred on Gatun and Alhajuela lakes, give Panama abundant freshwater, and Panama City is one of the few Latin American capitals where the tap water is generally safe to drink. Pressure is rising, though: record droughts in 2023 and 2024 lowered Canal reservoirs and rationed shipping, and rural and Guna Yala island communities face supply gaps.
Why the organic number looks like that. Certified-organic farmland is not separately reported for Panama, and that is a certification gap rather than proof nothing is grown cleanly. What the official land record does show: 29.5% of the country is agricultural land and 7.6% is arable (2023, World Bank). Certification is paid for per farm per year by a foreign body, which prices out smallholders, so the organic number reads worse than the practice.
The plant-based kitchen here is not an import. By tonnage, the largest crops grown in Panama are sugarcane, bananas, rice, oil palm fruit and plantains and cooking bananas (FAO, FAOSTAT crop production, 2024). That is what the land itself puts on a plate.
Buy direct where residents buy: Farmers Market Panama Fresh, Mercado Agrícola, Mercado Municipal, Mercado Público, Mercado de Frutas. Each is a mapped, named marketplace, so the money stays with the seller rather than the importer. OpenStreetMap.
Panama is one of only three countries in the world, with Bhutan and Suriname, currently assessed as carbon negative, its extensive forests absorbing more carbon than the national economy emits. Renewables supplied roughly 73% of electricity in 2024, led by hydropower at about 60% with growing solar and wind, and fossil carbon dioxide emissions were a low 2.8 tonnes per person. The country helped form the carbon negative alliance at COP26 and keeps forest cover across around 65% of its territory. Remaining gas and oil generation in the grid is the main caveat to an otherwise leading position.
What powers Panama?
Renewable 68%Fossil 32%
Climate pollution per person
The safe amount, what the planet can absorb
2 tonnes
One person here
2.74 tonnes
The world average, for comparison
4.7 tonnes
The worst it ever got
3.11 tonnes
The grid
Panama is one of only three countries in the world, with Bhutan and Suriname, currently assessed as carbon negative, its extensive forests absorbing more carbon than the national economy emits. Renewables supplied roughly 73% of electricity in 2024, led by hydropower at about 60% with growing solar and wind, and fossil carbon dioxide emissions were a low 2.8 tonnes per person.
Pollution
Panama banned single use plastic shopping bags under Law 1 of 2018, with the ban on supermarkets, pharmacies and retailers taking effect from July 2019. Ambient PM2.5 averages around 11.4 micrograms per cubic metre (World Bank, 2017), relatively clean by regional standards though above the WHO guideline.
Water stress
High rainfall and the Panama Canal watershed, centred on Gatun and Alhajuela lakes, give Panama abundant freshwater, and Panama City is one of the few Latin American capitals where the tap water is generally safe to drink. Pressure is rising, though: record droughts in 2023 and 2024 lowered Canal reservoirs and rationed shipping, and rural and Guna Yala island communities face supply gaps.
What pollutes most here
1The gridThe share of electricity still generated from fossil fuel.38%
2IndustryLarge scale mining, notably the Cobre Panama copper mine ordered shut after 2023 protests and a Supreme Court ruling.named
3AirModelled annual mean against a WHO guideline of 5 µg/m³.11.4
4On the recordPanama banned single use plastic shopping bags under Law 1 of 2018, with the ban on supermarkets, pharmacies and retailers taking effect from July 2019.
What has Panama promised on climate?
Net zero, whole economyAlready achieved and commit to maintain
Electricity renewable today79.3% (2021)
Land protected, against a 30% target31.4% by 2025
Sea protected, against a 30% target26.3% by 2025
The net-zero target year on file with Climate Watch is Already achieved and commit to maintain, status: in policy document. Measured against it, 79.3% of electricity is already renewable (2021, World Bank), so 20.7% of the grid is still to be converted. The pledge on file is measured here against what has actually been delivered, not taken on its own (UNFCCC NDC Registry, CBD Kunming-Montreal Target 3).
The biggest line item
One return flight against a whole year of living.
A resident's entire year2.74 t CO2e
Safe-climate budget, per year2 t CO2e
Singapore return, economy3.39 t CO2e
Sydney return, economy2.55 t CO2e
Dubai return, economy2.49 t CO2e
Johannesburg return, economy2.2 t CO2e
Frankfurt return, economy1.64 t CO2e
How much CO2 does flying to Panama emit?
Tap where you would fly from. One return flight, economy.
Every prompt runs on a machine in a building on somebody’s grid. What that costs the planet depends less on the prompt than on what is burning to power it. Here is what would power one in Panama.
Data centres
9
Registered colocation and interconnection facilities, PeeringDB, 2026
Grid renewable
68.0 %
What a machine here runs on.
What powers a data centre in Panama?
A machine here runs mostly on renewables, but not entirely.
Renewable 68%Fossil 32%
Cooling water. Every one of those halls runs on the national grid, which is 79.3% renewable today (World Bank). A data centre is only as clean as the electricity behind it, so the same figure that decides this country's climate score also decides the footprint of the AI running inside it. Cooling water use is not separately published by facility, and no operator here reports it.
The rules. Panama has 9 colocation and interconnection facilities on the public PeeringDB register, concentrated in Panama (5), Panama City (2), Distrito de Panamá (1), alongside 2 internet exchanges (InteRed Panama, BGP.Exchange, Panama City). Named sites include KIO Panamá 1 (PAN1), Ufinet Panamá - Urbanización Obarrio, Navégalo Data Center Panama (PA1), Panama Business Park, Movistar.
Where the cables land. 7 landing points · Balboa, Colón, Cristóbal, Fort Amador
65% residents to 35% visitors across a year. 2,494,000 international arrivals in 2019 against 4,571,189 people who live here (2025, World Bank / UN Tourism).
Where a visitor dollar goes in Panama
647k
Visitors a year
0.1
Visitors per resident
How deep in debt is Panama?· for every $100 Panama earns in a year, it owes…
Pay to the order of: the creditorsmemo · the 1994 peak
$ 89The worst year on the IMF record. Panama owed $89 for every $100 it earned.
IMF World Economic Outlook, 1994signed, the creditors
Pay to the order of: the creditorsmemo · today
$ 58What is owed now, for every $100 of national income (2026).
IMF World Economic Outlook, 2026signed, the creditors
Pay to the order of: the creditorsmemo · projected 2031
$ 54The IMF's own forecast has this falling to $54 by 2031.
IMF World Economic Outlook projection, 2031signed, the forecast
For every $100 Panama earns in a year, it owes $58 (2026, IMF World Economic Outlook). The interest on that is paid before schools, clinics or coastline get their turn.
Where does a tourist dollar actually go in Panama?
Play one tourist dollar around the board. Every square is a measured fact from this page.
START!
1
GO: a visitor lands
$100 goes on the table. 2,494,000 international arrivals in 2019 against 4,571,189 residents, 0.5 visitors for every resident (World Bank / UN Tourism).
$100 in play
2
The bed
Who owns the largest places to stay in Panama is not published in the records we can check, so this square is left open rather than guessed. Where a listing names its owner, it is shown in the ownership table below.
not published
3
The plate
Food is 18.7% of everything Panama imports (2024, World Bank), so a large part of every restaurant bill is paid to a supplier abroad. Eating what the land here actually grows, sugarcane, rice, bananas, oranges, oil palm fruit, plantains, maize, pineapples, keeps that money with the grower.
sails in
4
The power
79.3% of the electricity is renewable (2021, World Bank), so the energy on the bill is mostly generated inside the country rather than shipped in.
made at home
5
What actually stays
On the parts that can be measured, the plate leaves and the power stays. It is genuinely a coin toss, decided by what you book.
split
6
Pay the bank first
Panama owes $58 for every $100 it earns (IMF World Economic Outlook, 2026 projection). The interest is paid before anything else on this board.
$58 per $100
7
No plan B
73.3% of everything Panama sells abroad is ores, slag and ash (2023, UN Comtrade). One market moving takes the whole board with it.
73.3% one export
8
Community chest
Tourism earns 9.3% of everything Panama makes from exports (2020, World Bank / UN Tourism). That is how much of the economy depends on the game continuing.
9.3% of exports
9
The flight
Getting here is usually the biggest single line on the bill. From Singapore a return economy seat is 3.39 t CO2, on the UK Government's published conversion factors. It is the one part of the trip this board cannot reduce.
3.39 t CO2
10
Back to GO
The economy turns over about US$95 billion a year (IMF World Economic Outlook, 2026 projection). Every lap of this board is a choice about how much of it stays.
US$95bn
GDPUS$90.5bn
Agriculture, share of GDP2.6%
Visitors a year647,000
Visitors per resident0.1
Residents~4,571,189
Agriculture
Farming is 2.6% of the economy. Panama grows much of its own rice, plantain, maize, beef, coffee and seafood, but a service based, dollarised economy imports a substantial share of its food, especially processed goods and some staples.
Natural materials
Panama has some of the Americas' most vivid living textile and fibre crafts: the reverse applique molas sewn by Guna women, chacara bags woven by the Ngabe Bugle, and baskets made by the Embera Wounaan from chunga palm and nawala fibre. These are worn and traded daily, not staged for tourists.
Energy
Panama is one of only three countries in the world, with Bhutan and Suriname, currently assessed as carbon negative, its extensive forests absorbing more carbon than the national economy emits. Renewables supplied roughly 73% of electricity in 2024, led by hydropower at about 60% with growing solar and wind, and fossil carbon dioxide emissions were a low 2.8 tonnes per person.
Who owns the biggest hotels in Panama?
By rooms · company records and press.
La Loma Jungle Lodge · ~5 roomsIndependentnot published
Isla Palenque · ~9 roomsIndependentnot published
Akwaba Lodge · ~8 roomsIndependentnot published
Casa Cayuco · ~8 roomsIndependentnot published
Mount Totumas · ~8 roomsIndependentnot published
Visitors, over time
20152,553k
20162,379k
20172,517k
20182,487k
20192,494k
2020647k
International tourism receipts run at about US$1.84 billion in 2020 (World Bank / UN Tourism). That is 9.3% of everything the country earns from exports.
How much of your money actually stays here?
Tap the holiday you are planning.
All-inclusive resortForeign-owned hotel and tourist restaurantsLocally owned stay and local restaurantsGuesthouse, markets and public transport
Resort guest, villa renter, family, nomad or backpacker. The honest playbook for each, from the same sourced numbers.
Already booked a resort? · the rescue list
Five swaps that move your money back on-island
1. Eat where the country eats Choose kitchens cooking what the land here grows, sugarcane, rice, bananas, oranges, oil palm fruit, plantains, maize and pineapples, over an imported menu. The checked list →
2. Book with a local operator Never the lobby desk. The margin on a tour is the part that stays. Eco tours →
3. Stay somewhere locally owned Ownership decides where the room rate books. Eco stays →
4. Use the transport residents use Panama City has the only metro in Central America, opened in 2014, alongside buses; boats and small domestic flights serve Bocas del Toro and Guna Yala; and a railway runs beside the Canal.
5. Buy the craft, not the souvenir Natural-materials work made here pays the maker directly; imported gifts pay a shipping line.
swipe →
First time here
Panama is a narrow isthmus joining two continents and two oceans, with high forest cover, some of the region's strongest protected areas and highly autonomous indigenous comarcas.
Best time: Dry season for both coasts and the highlands
Getting around
Panama City has the only metro in Central America, opened in 2014, alongside buses; boats and small domestic flights serve Bocas del Toro and Guna Yala; and a railway runs beside the Canal.
Transport is where the fare either stays or leaves.
Eating here
The everyday plate that actually grows here is sugarcane, rice, bananas, oranges, oil palm fruit, plantains, maize and pineapples. Ordering those keeps the money with the grower and cuts the imported share of the meal.
Eating what the country grows is the cheapest way to cut the import bill.
Good to know
USD is the currency; cards widely accepted. English on the islands.
Rate my hotel. Tap yours for the honest verdict.
Ownership from company records and press.
La Loma Jungle LodgeIsla PalenqueAkwaba LodgeCasa CayucoMount Totumas
.
Who owns the big hotels
La Loma Jungle LodgeIndependent · 5 rooms
Isla PalenqueIndependent · 9 rooms
Akwaba LodgeIndependent · 8 rooms
Casa CayucoIndependent · 8 rooms
Mount TotumasIndependent · 8 rooms
None of the 5 properties listed here publishes who ultimately owns it, so no claim is made either way. Ownership is what decides how much of a room rate stays in the country, which is why we show it when a listing states it.
Society and Governance in Panama.
How well is Panama actually run?
Governance, measured · World Bank WGI
Four measured answers, none of them opinion. Averaged across corruption control, delivery and accountability, Panama scores 52 out of 100 (2024, World Bank Worldwide Governance Indicators). That matters here because every pledge on this page is only as good as the machinery meant to deliver it.
How well is Panama run? · each scored out of 100, higher is better
Clean government, scored 37 of 100
Control of corruption scores 36.6 out of 100 (2024, World Bank Worldwide Governance Indicators). That is below the halfway mark of governments measured.
37
Freedom and rights, scored 65 of 100
Voice and accountability, which measures free expression, free media and the ability to choose a government, scores 64.6 out of 100 (2024, World Bank WGI). Citizens have some room to question their government.
65
Government effectiveness, scored 56 of 100
Government effectiveness, which measures the quality of public services and how well policy is actually delivered, scores 56.1 out of 100 (2024, World Bank WGI). Delivery is rated above average.
56
Income equality, scored 50 of 100
The Gini index of income inequality reads 49.7 (2024, World Bank). Zero is perfect equality and 100 is one person holding everything. Above 40 is the level usually treated as socially strained, and Panama sits above it.
50
LGBTQ+ status: MixedSolo female travel: Take care96.2% adult literacyIndustry to avoid: Large scale mining, notably the Cobre Panama copper mine ordered shut after 2023 protests and a Supreme Court ruling
What is daily life in Panama really like? Measured
Getting around, breathing, throwing away, learning. The honest checklist.
TransportAirWaterWastePower
✓How you get around Panama City has the only metro in Central America, opened in 2014, alongside buses; boats and small domestic flights serve Bocas del Toro and Guna Yala; and a railway runs beside the Canal.
✓Air quality, measured Modelled annual mean 11.4. The WHO guideline is 5 µg/m³.
✓Where the air is cleanest Chiriqui highlands around Boquete and Volcan
✓Tap water Varies
✓What to drink Panama City tap water is drinkable; elsewhere stick to bottled.
✓Plastic rules Yes, single use plastic bags banned under Law 1 of 2018
✓Sockets and voltage Type A/B, 120V
96.2%
literacy. Public spending on education runs at 2.5% of GDP and 16.3% of all government spending, and secondary enrolment stands at 76.6% gross (UNESCO Institute for Statistics, 2017 to 2024).
Made in Panama.
Panama has some of the Americas' most vivid living textile and fibre crafts: the reverse applique molas sewn by Guna women, chacara bags woven by the Ngabe Bugle, and baskets made by the Embera Wounaan from chunga palm and nawala fibre. These are worn and traded daily, not staged for tourists. Every step of processing done at home is value that stops leaving the country.
What Panama actually sells the world
The single biggest thing Panama sells the world is ores, slag and ash, 73.3% of all exports in 2023 (about US$2.47 billion, UN Comtrade). The next four are fruit and nuts at 5.1%, fish and seafood at 3.8%, animal and vegetable fats and oils at 2.8%, iron and steel at 1.7%.
Made now · natural materials
Fibre crafts: the reverse applique molas sewn by Guna women
Worked in Panama from local material, and still a working craft rather than a museum piece.
Made now · natural materials
Chacara bags woven by the Ngabe Bugle
Worked in Panama from local material, and still a working craft rather than a museum piece.
Made now · natural materials
Embera Wounaan chunga palm baskets
Worked in Panama from local material, and still a working craft rather than a museum piece.
Made now · natural materials
Traded daily
Worked in Panama from local material, and still a working craft rather than a museum piece.
Buys in · 20.1% of imports
Mineral fuels and oils
Panama imported US$2.92 billion of mineral fuels and oils in 2023, 20.1% of everything it bought abroad, and sells none of it back. Every point of that is a business that could be built at home rather than shipped in. UN Comtrade.
Buys in · 9.9% of imports
Machinery and mechanical appliances
Panama imported US$1.43 billion of machinery and mechanical appliances in 2023, 9.9% of everything it bought abroad, and sells none of it back. Every point of that is a business that could be built at home rather than shipped in. UN Comtrade.
Buys in · 8.1% of imports
Vehicles
Panama imported US$1.18 billion of vehicles in 2023, 8.1% of everything it bought abroad, and sells none of it back. Every point of that is a business that could be built at home rather than shipped in. UN Comtrade.
Buys in · 7.1% of imports
Electrical machinery and electronics
Panama imported US$1.03 billion of electrical machinery and electronics in 2023, 7.1% of everything it bought abroad, and sells none of it back. Every point of that is a business that could be built at home rather than shipped in. UN Comtrade.
The maths for an entrepreneur. Panama produces about US$90 billion a year, which is roughly US$19,790 per person (2025, World Bank). Farming is 2.6% of that, while food is 18.7% of everything the country imports. The country buys in more food than its own farms contribute to the economy, and every point of that gap is a business someone could build here rather than ship in. With 7.6% of the land arable, the raw material for that is already in the ground.
A living tradition of Panama, still practised rather than archived.
Cumbia panamena
A living tradition of Panama, still practised rather than archived.
Mejorana
A living tradition of Panama, still practised rather than archived.
Saloma
A living tradition of Panama, still practised rather than archived.
Afro-Panamanian Congo danceA living tradition of Panama, still practised rather than archived.
RitualA living tradition of Panama, still practised rather than archived.
Does Panama protect its heritage by law?
Partly, and the gaps say as much as the protections.
What is kept alive. Panama holds vibrant living heritage across indigenous, Afro-Panamanian and mestizo communities. The tamborito is the national dance, and Afro-Panamanian Congo culture, with its dances, music and rituals, is inscribed on UNESCO's intangible heritage list, as are the dances and expressions associated with the Corpus Christi festivity, inscribed for Panama as a whole in 2021, in which performers stage the battle between St Michael the Archangel and the devils. The Guna people sustain a self governed living culture in Guna Yala, famed for the reverse applique mola textiles, while the Embera, Wounaan and Ngabe-Bugle keep their own languages and ancestral practice.
Who it belongs to. Panama's indigenous peoples hold strong legal autonomy through comarcas: Guna Yala (San Blas), where the Guna run their own islands and community tourism, plus the Embera Wounaan, Ngabe Bugle and the recently recognised Naso Tjer Di. Village stays and Guna owned lodges keep tourism income with local communities. This is living self government, not heritage on display.
Only here. Guna Yala (San Blas), an autonomous indigenous archipelago of some 350 islands governed by the Guna.
Three futures for Panama, every one run forward from measured data.
Where the making actually happens
Named cultural and craft sites on the open map: Panama Canal Museum (Panama City), Panama History Museum (Panama City), Museum Belisario Porras (Las Tablas), Museum of Kuna Cultura (Gaigirgordub), Tanager Botanical Garden (Veraguas). OpenStreetMap. Named craft workshops on the open map: Artesanías Sam, Casa de la Artesanía y Folcklore, Grupo Friolin, La Casa del Montuno, Mercado de Artesanías.
Every measured trend on one line
Run forward at the pace already recorded.
-7%
Forest cover
1995: 60.9 % → 2023: 56.3 %
+15%
Renewable electricity
1995: 69.1 % → 2021: 79.3 %
+70%
CO2 per person
1995: 1.61 t → 2024: 2.74 t
+55%
Tourist arrivals
1995: 417 k → 2020: 647 k
+50%
Protected land
2013: 20.9 % → 2025: 31.4 %
-30%
Farm workforce
1995: 22.8 % → 2025: 16 %
+1447%
Protected sea
2013: 1.7 % → 2025: 26.3 %
+3%
Agricultural land
1995: 28.7 % → 2023: 29.5 %
+14%
Urban population
1995: 58.2 % → 2025: 66.2 %
-16%
Air pollution
1995: 18 µg/m³ → 2023: 15.1 µg/m³
-38%
Fresh water per person
1995: 50136.6 m³ → 2022: 31040 m³
+61%
Adult overweight
1995: 44.5 % → 2022: 71.6 %
+25%
Electricity access
1995: 76.7 % → 2024: 96 %
+463%
GDP per person
1995: 3514 → 2025: 19790
+68%
Population
1995: 2725 k → 2025: 4571 k
-20%
Renewable energy use
1995: 34.8 % → 2021: 28 %
+40%
Energy per person
1995: 728.2 kg → 2023: 1020 kg
+423%
Protected area, total
2013: 5.2 % → 2025: 27.2 %
+11%
Life expectancy
1995: 72 yrs → 2024: 79.8 yrs
+116%
Cereal yield
1995: 1957 ha → 2024: 4226 ha
+103%
Fertiliser use
1995: 55.4 ha → 2023: 112.6 ha
-19%
Rural population
1995: 41.8 % → 2025: 33.9 %
+55%
Water productivity
2010: 37.4 $/m3 → 2022: 58 $/m3
+19%
Health spending
2000: 6.98 % → 2023: 8.33 %
-8%
Forest area
1995: 45248 km2 → 2023: 41796 km2
+154%
Electric power use
1995: 1069 kWh → 2023: 2715 kWh
+14%
Emissions: Agriculture
1990: 3.28 e → 2023: 3.75 e
+68%
Emissions: Building
1990: 0.57 e → 2023: 0.96 e
+656%
Emissions: Electricity/Heat
1990: 0.55 e → 2023: 4.16 e
+378%
Emissions: Energy
1990: 3 e → 2023: 14.1 e
+1164%
Emissions: Industrial Processes
1990: 0.14 e → 2023: 1.77 e
+223%
Emissions: Manufacturing/Construction
1990: 0.52 e → 2023: 1.68 e
+337%
Emissions: Transportation
1990: 1.31 e → 2023: 5.73 e
World Bank open data, recorded series
How much forest is left?
Forest cover moved from 60.9% to 56.3% across 28 recorded years.
World Bank AG.LND.FRST.ZS
How clean is the grid?
Renewable electricity moved from 69.1% to 79.3% across 26 recorded years.
World Bank EG.ELC.RNEW.ZS
How much climate pollution per person?
CO2 per person moved from 1.6 t to 2.7 t across 29 recorded years.
World Bank EN.GHG.CO2.PC.CE.AR5
How many people visit?
Tourist arrivals moved from 417k to 647k across 25 recorded years.
World Bank ST.INT.ARVL
How much land is protected?
Protected land moved from 20.9% to 31.4% across 12 recorded years.
World Bank ER.LND.PTLD.ZS
How many people still farm?
Farm workforce moved from 22.8% to 16.0% across 30 recorded years.
World Bank SL.AGR.EMPL.ZS
How much sea is protected?
Protected sea moved from 1.7% to 26.3% across 12 recorded years.
World Bank ER.MRN.PTMR.ZS
How much land is farmed?
Agricultural land moved from 28.7% to 29.5% across 28 recorded years.
World Bank AG.LND.AGRI.ZS
How fast is it urbanising?
Urban population moved from 58.2% to 66.2% across 30 recorded years.
World Bank SP.URB.TOTL.IN.ZS
Is the air getting cleaner?
Air pollution moved from 18.0 µg/m³ to 15.1 µg/m³ across 28 recorded years.
World Bank EN.ATM.PM25.MC.M3
Is water getting scarcer?
Fresh water per person moved from 50136.6 m³ to 31040.0 m³ across 27 recorded years.
World Bank ER.H2O.INTR.PC
Is diet-related disease rising?
Adult overweight moved from 44.5% to 71.6% across 27 recorded years.
World Bank SH.STA.OWAD.ZS
Who has power?
Electricity access moved from 76.7% to 96.0% across 29 recorded years.
World Bank EG.ELC.ACCS.ZS
Is income rising?
GDP per person moved from 3514 to 19790 across 30 recorded years.
World Bank NY.GDP.PCAP.CD
How fast is it growing?
Population moved from 2725k to 4571k across 30 recorded years.
World Bank SP.POP.TOTL
What share of all energy is renewable?
Renewable energy use moved from 34.8% to 28% across 26 recorded years.
World Bank EG.FEC.RNEW.ZS
How much energy does one person use?
Energy per person moved from 728.19 kg to 1020 kg across 28 recorded years.
World Bank EG.USE.PCAP.KG.OE
How much land and sea is protected together?
Protected area, total moved from 5.2% to 27.2% across 12 recorded years.
World Bank ER.PTD.TOTL.ZS
How long do people live?
Life expectancy moved from 71.99 yrs to 79.78 yrs across 29 recorded years.
World Bank SP.DYN.LE00.IN
How much does a hectare of cereal produce?
Cereal yield moved from 1957 kg/ha to 4226 kg/ha across 29 recorded years.
World Bank AG.YLD.CREL.KG
How much fertiliser goes on the land?
Fertiliser use moved from 55.4 kg/ha to 112.58 kg/ha across 28 recorded years.
World Bank AG.CON.FERT.ZS
How many people still live rurally?
Rural population moved from 41.75% to 33.85% across 30 recorded years.
World Bank SP.RUR.TOTL.ZS
How much value per cubic metre of water?
Water productivity moved from 37.43 $/m3 to 57.97 $/m3 across 12 recorded years.
World Bank ER.GDP.FWTL.M3.KD
How much goes on health?
Health spending moved from 6.98% to 8.33% across 23 recorded years.
World Bank SH.XPD.CHEX.GD.ZS
How much forest is there in total?
Forest area moved from 45248 km2 to 41796 km2 across 28 recorded years.
World Bank AG.LND.FRST.K2
How much electricity per person?
Electric power use moved from 1069 kWh to 2715 kWh across 28 recorded years.
World Bank EG.USE.ELEC.KH.PC
How have agriculture emissions moved?
Agriculture emissions moved from 3.28 to 3.75 MtCO2e across 33 recorded years.
Climate Watch (WRI), historical emissions
How have building emissions moved?
Building emissions moved from 0.57 to 0.96 MtCO2e across 33 recorded years.
Climate Watch (WRI), historical emissions
How have electricity/heat emissions moved?
Electricity/Heat emissions moved from 0.55 to 4.16 MtCO2e across 33 recorded years.
Climate Watch (WRI), historical emissions
How have energy emissions moved?
Energy emissions moved from 2.95 to 14.09 MtCO2e across 33 recorded years.
Climate Watch (WRI), historical emissions
How have industrial processes emissions moved?
Industrial Processes emissions moved from 0.14 to 1.77 MtCO2e across 33 recorded years.
Climate Watch (WRI), historical emissions
How have manufacturing/construction emissions moved?
Manufacturing/Construction emissions moved from 0.52 to 1.68 MtCO2e across 33 recorded years.
Climate Watch (WRI), historical emissions
How have transportation emissions moved?
Transportation emissions moved from 1.31 to 5.73 MtCO2e across 33 recorded years.
Climate Watch (WRI), historical emissions
Worst caseCurrent pathBest case
Worst case
Every measured decline continues at the pace already recorded. The weakest pillar, organic farming at 2/5, is the one that gives way first.
Computed from: recorded series extended with no policy change
Current path
Every line above is a recorded World Bank series for this country. The current path is simply those series continuing at the pace already measured.
Computed from: recorded series, no policy change assumed
Best case
The pledges are met on their own stated timetables and the weakest pillars are lifted to match the strongest. Panama already shows it can do this: heritage scores 5/5.
Computed from: each published target delivered on its own date
What the best case actually asks for
Lift organic farming
It scores 2 out of 5 today, among the weakest parts of Panama's record. FiBL records only about 0.3 percent of agricultural land as certified organic in 2020, roughly 5,900 hectares, mostly specialty coffee in the Boquete highlands. Certification is a small niche within otherwise conventional farming. Lifting it toward the 5/5 the strongest pillars already reach is what the best case turns on.
measured each year
Costs: spending and enforcement, not new technology
Lift recycling
It scores 2 out of 5 today, among the weakest parts of Panama's record. Formal municipal recycling is limited and much of Panama's waste still goes to landfill, notably the Cerro Patacon site serving the capital. Recovery is small scale and often informal. Lifting it toward the 5/5 the strongest pillars already reach is what the best case turns on.
measured each year
Costs: spending and enforcement, not new technology
Lift food and farming
It scores 3 out of 5 today, among the weakest parts of Panama's record. Panama grows much of its own rice, plantain, maize, beef, coffee and seafood, but a service based, dollarised economy imports a substantial share of its food, especially processed goods and some staples. Farming remains important in Chiriqui and the interior. Self sufficiency in basics is moderate. Lifting it toward the 5/5 the strongest pillars already reach is what the best case turns on.
measured each year
Costs: spending and enforcement, not new technology
Government and Goals in Panama.
Who is in charge of Panama now · Office-holders from the UN Protocol and Liaison Service public list of Heads of State and Heads of Government, 8 September 2026. Legislature and election dates from IFES ElectionGuide. Constitution dates from the Constitute Project. Governance scores from the World Bank Worldwide Governance Indicators 2024.
José Raúl Mulino
President
José Raúl Mulino is the head of government of Panama, in office since 1 July 2024. Every climate, protection and energy pledge on this page is delivered, or not, under this administration.
Public opinion, measured
Voice and accountability, the freedom to question government: 64.6 / 100. Above the halfway mark of governments measured. World Bank WGI 2024
Control of corruption: 36.6 / 100. Below the halfway mark of governments measured. World Bank WGI 2024
Political stability and absence of violence: 70.4 / 100. Above the halfway mark of governments measured. World Bank WGI 2024
Rule of law: 52.4 / 100. Above the halfway mark of governments measured. World Bank WGI 2024
Regulatory quality: 53.7 / 100. Above the halfway mark of governments measured. World Bank WGI 2024
José Raúl MulinoPresident
National Assembly (Asamblea Nacional)Legislature, unicameral
Last election5 May 2024
Constitution1972, as revised to 2004
Government typepresidential republic
Panama national goals: climate commitments on record · as recorded by Climate Watch, World Resources Institute
Net zero
In Policy Document
Net-zero target as recorded by Climate Watch. Status: In Policy Document (6/18/2024, 12/27/2020) ↗
The questions people actually type, answered in full sentences from the sourced data above.
swipe →
Is Panama sustainable?
Panama scores 77 out of 100 on the Throne Eco Index, across twelve equally weighted pillars. Panama is a narrow isthmus joining two continents and two oceans, with high forest cover, some of the region's strongest protected areas and highly autonomous indigenous comarcas.
Is the water in Panama safe and plentiful?
High rainfall and the Panama Canal watershed, centred on Gatun and Alhajuela lakes, give Panama abundant freshwater, and Panama City is one of the few Latin American capitals where the tap water is generally safe to drink. Pressure is rising, though: record droughts in 2023 and 2024 lowered Canal reservoirs and rationed shipping, and rural and Guna Yala island communities face supply gaps. A national safely managed drinking water figure is not published, but at least basic water reaches about 96 percent of people.
Can Panama feed itself?
Panama grows much of its own rice, plantain, maize, beef, coffee and seafood, but a service based, dollarised economy imports a substantial share of its food, especially processed goods and some staples. Farming remains important in Chiriqui and the interior. Self sufficiency in basics is moderate.
Is it easy to eat plant-based in Panama?
Rice, beans, plantain, yuca, maize tortillas, patacones and tropical fruit are everyday staples, so unprocessed plant food is easy to find in markets and fondas. Cuisine leans on seafood and meat, but a plant based diet is straightforward, especially with Caribbean and interior produce.
How much of Panama is actually protected?
Terrestrial protected areas cover about 31.4 percent of the land (World Bank, 2021), including the UNESCO listed Darien and La Amistad parks and Coiba National Park, a former penal island whose isolation preserved outstanding marine and forest life. Marine protection stood at about 26.8 percent in 2021, and Panama expanded it sharply in 2023 by enlarging the Cordillera de Coiba reserve, reporting more than 30 percent of its waters protected. Coverage is strong, though Darien faces logging and migration pressure.
What wildlife is left in Panama?
As the land bridge between North and South America, Panama is extraordinarily biodiverse, with more than 1,000 bird species, the harpy eagle as national bird, and high endemism in Darien and the western highlands. Coiba shelters endemic subspecies, and the Panamanian golden frog is a national symbol. The World Bank and IUCN list about 18 threatened mammal and 19 threatened bird species (2022), but the story here is richness and endemism.
Is Panama on clean energy?
Panama is one of only three countries in the world, with Bhutan and Suriname, currently assessed as carbon negative, its extensive forests absorbing more carbon than the national economy emits. Renewables supplied roughly 73% of electricity in 2024, led by hydropower at about 60% with growing solar and wind, and fossil carbon dioxide emissions were a low 2.8 tonnes per person. The country helped form the carbon negative alliance at COP26 and keeps forest cover across around 65% of its territory.
How polluted is Panama?
Panama banned single use plastic shopping bags under Law 1 of 2018, with the ban on supermarkets, pharmacies and retailers taking effect from July 2019. Ambient PM2.5 averages around 11.4 micrograms per cubic metre (World Bank, 2017), relatively clean by regional standards though above the WHO guideline. Urban litter and waste handling remain works in progress.
Does recycling work in Panama?
Formal municipal recycling is limited and much of Panama's waste still goes to landfill, notably the Cerro Patacon site serving the capital. Recovery is small scale and often informal.
Is the farming in Panama organic?
FiBL records only about 0.3 percent of agricultural land as certified organic in 2020, roughly 5,900 hectares, mostly specialty coffee in the Boquete highlands. Certification is a small niche within otherwise conventional farming.
Are there natural materials and craft in Panama?
Panama has some of the Americas' most vivid living textile and fibre crafts: the reverse applique molas sewn by Guna women, chacara bags woven by the Ngabe Bugle, and baskets made by the Embera Wounaan from chunga palm and nawala fibre. These are worn and traded daily, not staged for tourists.
Is there living culture in Panama?
Panama's indigenous peoples hold strong legal autonomy through comarcas: Guna Yala (San Blas), where the Guna run their own islands and community tourism, plus the Embera Wounaan, Ngabe Bugle and the recently recognised Naso Tjer Di. Village stays and Guna owned lodges keep tourism income with local communities. This is living self government, not heritage on display.
What heritage does Panama keep alive?
Panama holds vibrant living heritage across indigenous, Afro-Panamanian and mestizo communities. The tamborito is the national dance, and Afro-Panamanian Congo culture, with its dances, music and rituals, is inscribed on UNESCO's intangible heritage list, as are the dances and expressions associated with the Corpus Christi festivity, inscribed for Panama as a whole in 2021, in which performers stage the battle between St Michael the Archangel and the devils. The Guna people sustain a self governed living culture in Guna Yala, famed for the reverse applique mola textiles, while the Embera, Wounaan and Ngabe-Bugle keep their own languages and ancestral practice.
So is Panama actually green? The measured answer
What is working: land protected at 31.4%, sea protected at 26.3%, renewable electricity at 79.3%.
What is not: the gaps are narrower here than in most of the directory, and each remaining one is named below.
Panama sits 5 of 77 at 77/100. Every name links to its own destination page, built exactly like this one. The full ranking →
What is Panama particularly good at?
✓Conservation, scored 5/5. Terrestrial protected areas cover about 31.4 percent of the land (World Bank, 2021), including the UNESCO listed Darien and La Amistad parks and Coiba National Park, a former penal island whose isolation preserved outstanding marine and forest life. Marine protection stood at about 26.8 percent in 2021, and Panama expanded it sharply in 2023 by enlarging the Cordillera de Coiba reserve, reporting more than 30 percent of its waters protected. Coverage is strong, though Darien faces logging and migration pressure.
✓Culture, scored 5/5. Panama's indigenous peoples hold strong legal autonomy through comarcas: Guna Yala (San Blas), where the Guna run their own islands and community tourism, plus the Embera Wounaan, Ngabe Bugle and the recently recognised Naso Tjer Di. Village stays and Guna owned lodges keep tourism income with local communities. This is living self government, not heritage on display.
✓Energy, scored 5/5. Panama is one of only three countries in the world, with Bhutan and Suriname, currently assessed as carbon negative, its extensive forests absorbing more carbon than the national economy emits. Renewables supplied roughly 73% of electricity in 2024, led by hydropower at about 60% with growing solar and wind, and fossil carbon dioxide emissions were a low 2.8 tonnes per person. The country helped form the carbon negative alliance at COP26 and keeps forest cover across around 65% of its territory. Remaining gas and oil generation in the grid is the main caveat to an otherwise leading position.
Where does Panama score worst?
✕Natural fibres, scored 3/5. Panama has some of the Americas' most vivid living textile and fibre crafts: the reverse applique molas sewn by Guna women, chacara bags woven by the Ngabe Bugle, and baskets made by the Embera Wounaan from chunga palm and nawala fibre. These are worn and traded daily, not staged for tourists.
✕Organic farming, scored 2/5. FiBL records only about 0.3 percent of agricultural land as certified organic in 2020, roughly 5,900 hectares, mostly specialty coffee in the Boquete highlands. Certification is a small niche within otherwise conventional farming.
✕Recycling, scored 2/5. Formal municipal recycling is limited and much of Panama's waste still goes to landfill, notably the Cerro Patacon site serving the capital. Recovery is small scale and often informal.
Similar countries doing it better and worse
GuatemalaScored on the same twelve pillars as Panama.72
Costa RicaScored on the same twelve pillars as Panama.72
NicaraguaScored on the same twelve pillars as Panama.67
HondurasScored on the same twelve pillars as Panama.68
A note from the lens of mother natureswipe →
Energy, 5/5
Panama is one of only three countries in the world, with Bhutan and Suriname, currently assessed as carbon negative, its extensive forests absorbing more carbon than the national economy emits. Renewables supplied roughly 73% of electricity in 2024, led by hydropower at about 60% with growing solar and wind, and fossil carbon dioxide emissions were a low 2.8 tonnes per person.
Food and farming, 3/5
Panama grows much of its own rice, plantain, maize, beef, coffee and seafood, but a service based, dollarised economy imports a substantial share of its food, especially processed goods and some staples. Farming remains important in Chiriqui and the interior.
Heritage, 5/5
Panama holds vibrant living heritage across indigenous, Afro-Panamanian and mestizo communities. The tamborito is the national dance, and Afro-Panamanian Congo culture, with its dances, music and rituals, is inscribed on UNESCO's intangible heritage list, as are the dances and expressions associated with the Corpus Christi festivity, inscribed for Panama as a whole in 2021, in which performers stage the battle between St Michael the Archangel and the devils.
The Panama Directory.
Everything on Hold The Throne that sits in Panama, checked and listed.
World Bank Worldwide Governance Indicators, 2024. Percentile among all governments measured.
Government effectiveness
56.1 / 100
World Bank Worldwide Governance Indicators, 2024. Percentile among all governments measured.
Rule of law
52.4 / 100
World Bank Worldwide Governance Indicators, 2024. Percentile among all governments measured.
Political stability
70.4 / 100
World Bank Worldwide Governance Indicators, 2024. Percentile among all governments measured.
Voice and accountability
64.6 / 100
World Bank Worldwide Governance Indicators, 2024. Percentile among all governments measured.
Environmental Performance Index
52.9 / 100 · 49 of 180
Yale Environmental Performance Index 2024, ranked 49 of 180 countries assessed.
Ecosystem vitality
59.1 / 100 · 49 of 180
Yale Environmental Performance Index 2024, ranked 49 of 180 countries assessed.
Biodiversity and habitat
56.6 / 100 · 58 of 180
Yale Environmental Performance Index 2024, ranked 58 of 180 countries assessed.
Air pollution
80.9 / 100 · 62 of 180
Yale Environmental Performance Index 2024, ranked 62 of 180 countries assessed.
Terrestrial biomes protected
93.4 / 100 · 24 of 180
Yale Environmental Performance Index 2024, ranked 24 of 180 countries assessed.
Marine protected areas
88.1 / 100 · 50 of 131
Yale Environmental Performance Index 2024, ranked 50 of 131 countries assessed.
How Panama Is Scored. The Throne Standard.
Every destination on the index is scored the same way, so a 4 in Barbados means exactly what a 4 means in Iceland. No self-declared data and no brochure claims are accepted. Every figure on this page carries its named source and year, and the history on each page names what empire took as plainly as it scores the present.
The 12 pillars every destination is scored on, equally weighted
01
Conservation
Land and sea actually protected, not pledged
02
Wildlife
What survives, what is endemic, what is lost
03
Water
Fresh water per person, and the ocean’s health
04
Food & farming
Whether the place can feed itself
05
Organic & clean
Certified land and pesticide reality
06
Climate & energy
Emissions per person, how the grid is powered
07
Waste
Where the rubbish goes, what comes back
08
Health
What people eat and die of
09
Heritage
Living culture, and what the law keeps standing
10
Ownership
Who owns the economy, how much of a dollar stays
11
Governance
Freedom, honesty, promises kept
12
Future
Measured trends run forward, pledges against pace
What each 0 to 5 pillar score means, in plain words
The institutions above are the ones cited on this page, ranked by how many of its figures they carry. This same sectioned page renders for all 77 scored destinations, each with its own researched history, comparison charts and three-way future. Read the full methodology
Every figure on this page, and where it came from: 78 sources across 31 institutions
World Bank22 FIGURES
Terrestrial protected areas (percent of total land area) ER.LND.PTLD.ZS, 2021. check
Marine protected areas (% of territorial waters) ER.MRN.PTMR.ZS, 2025 check
PM2.5 air pollution, mean annual exposure (micrograms per cubic metre) EN.ATM.PM25.MC.M3, 2017. check
Threatened species (mammals EN.MAM.THRD.NO, birds EN.BIR.THRD.NO, fish EN.FSH.THRD.NO, higher plants EN.HPT.THRD.NO), 2022 check
Renewable electricity output (% of total) EG.ELC.RNEW.ZS, 2021 check
CO2 emissions per capita EN.GHG.CO2.PC.CE.AR5, 2024 check
Terrestrial protected areas (% of total land area), Panama, Terrestrial protected areas cover about 31.4 percent of the land (World Bank, 2021), including the UNESCO list check
Terrestrial protected areas (% of total land area), Panama corroboration check
Terrestrial protected areas (% of total land area), Panama corroboration check
Terrestrial protected areas (% of total land area), Panama corroboration check
Terrestrial protected areas (% of total land area), Panama corroboration check
Terrestrial protected areas (% of total land area), Panama corroboration check
Panama, IUCN Red List category Critically Endangered, class Aves, Critically Endangered on the IUCN Red List, and recorded in Panama in GBIF occurrence data (bird). check
Panama, IUCN Red List category Critically Endangered, class Aves corroboration check
Panama, IUCN Red List category Critically Endangered, class Aves corroboration check
Panama, IUCN Red List category Critically Endangered, class Aves corroboration check
Panama, IUCN Red List category Critically Endangered, Testudines, Critically Endangered on the IUCN Red List, and recorded in Panama in GBIF occurrence data (turtle). check
Panama, IUCN Red List category Critically Endangered, Testudines corroboration check
Panama, IUCN Red List category Critically Endangered, Testudines corroboration check
Panama, IUCN Red List category Critically Endangered, class Amphibia, Critically Endangered on the IUCN Red List, and recorded in Panama in GBIF occurrence data (amphibian). check
Panama, IUCN Red List category Critically Endangered, class Amphibia corroboration check
Panama, IUCN Red List category Critically Endangered, class Amphibia corroboration check
Panama, IUCN Red List category Critically Endangered, class Anthozoa, Critically Endangered on the IUCN Red List, and recorded in Panama in GBIF occurrence data (coral). check
Panama, IUCN Red List category Critically Endangered, class Anthozoa corroboration check
Panama, IUCN Red List category Critically Endangered, class Anthozoa corroboration check
Panama, IUCN Red List category Critically Endangered, all taxa, Critically Endangered on the IUCN Red List, and recorded in Panama in GBIF occurrence data (species). check
UNESCO Institute for Statistics4 FIGURES
public data API, Panama, Public spending on education runs at 2.5% of GDP and 16.3% of all government spending, and secondary enrolment check
BirdLife International, IUCN and UNEP-WCMC3 FIGURES
UN SDG Global Database, terrestrial Key Biodiversity Areas covered by protected areas (%) ER_PTD_TERR, Panama, 2025 (54.1%), country-reported check
UN SDG Global Database, marine Key Biodiversity Areas covered by protected areas (%) ER_MRN_MPA, Panama, 2025 (40.3%), country-reported check
UN SDG Global Database, freshwater Key Biodiversity Areas covered by protected areas (%) ER_PTD_FRHWTR, Panama, 2025 (78.5%), country-reported check
Iizuka3 FIGURES
F., 'The earliest Panamanian pottery: Reconstructing production and distribution of Monagrillo ceramics through petrographic provenance analysis', Geoarchaeology, 2017, Monagrillo ware is the earliest pottery in Panama and among the oldest in the Americas, found in shell middens check
F., 'The earliest Panamanian pottery: Reconstructing production and distribution of Monagrillo ceramics through petrographic provenance analysis', Geoarchaeology, 2017 corroboration check
F., 'The earliest Panamanian pottery: Reconstructing production and distribution of Monagrillo ceramics through petrographic provenance analysis', Geoarchaeology, 2017 corroboration check
IUCN Red List of Threatened Species checklist (IUCN)3 FIGURES
record for Dalbergia retusa, Critically Endangered on the IUCN Red List, and recorded in Panama in GBIF occurrence data (plant). check
COP15 Decision 15/4, Kunming-Montreal Global Biodiversity Framework, Target 3, The 30x30 target is 30% by 2030, so 3.7 percentage points are still to be designated. check
FAOSTAT, Crops and livestock products (QCL), Panama, Production, 2024, By tonnage, the largest crops grown in Panama are sugarcane, bananas, rice, oil palm fruit and plantains and c check
UN SDG Global Database, forest area (% of land area) AG_LND_FRST, Panama, 2025 (62.2%), country-reported check
UN SDG Global Database, forest area inside legally established protected areas (%) AG_LND_FRSTPRCT, Panama, 2025 (46.7%), country-reported check
Ley 1 de 19 de enero de 20182 FIGURES
Gaceta Oficial Digital No. 28448-B, Republica de Panama, Yes, single use plastic bags banned under Law 1 of 2018 check
Gaceta Oficial Digital No. 28448-B, Republica de Panama corroboration check
About 3520 to 1300 cal BC1 FIGURE
the calibrated range published by Iizuka, Cooke, Frame and Vandiver (2014); Iizuka's 2017 Geoarchaeology paper gives ca. 4500 to 3200 radiocarbon years BP for the same ware check
BNamericas1 FIGURE
Panama renewable electricity generation, 2024 check
The IUCN Red List of Threatened Species (conservation tool page), Critically Endangered, the last IUCN category before Extinct in the Wild, and still recorded in Panama. check
Low Carbon Power (data from Ember1 FIGURE
IEA and World Bank), Panama electricity mix, 2023. check
Ministerio de Cultura de Panama (MiCultura)1 FIGURE
The tamborito is the national dance, and Afro-Panamanian Congo culture, with its dances, music and rituals, is check
Ministerio de Cultura de Panama (MiCultura) corroboration1 FIGUREcheck
Other published sources1 FIGURE
The inscribed element is Dances and expressions associated with the Corpus Christi Festivity, listed in 2021 for Panama with no restriction to Los Santos; Panama's Ministry of Culture records the festivity as celebrated across the country, with La Villa de Los Santos one centre among several check

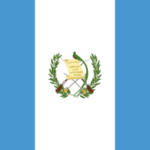 GuatemalaScored on the same twelve pillars as Panama.72
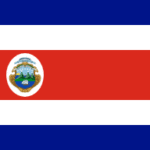 Costa RicaScored on the same twelve pillars as Panama.72
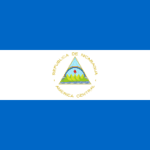 NicaraguaScored on the same twelve pillars as Panama.67
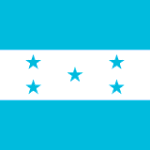 HondurasScored on the same twelve pillars as Panama.68