Destinations › Asia · The Destination Index · universal template · every figure sourced
Sri Lanka.
Southern Asia, island in the Indian Ocean, south of India. 65,610 sq km and 21,756,000 people, 1,340 km of coastline, tropical monsoon; northeast monsoon (December to March); southwest monsoon (June to October).
Region · AsiaPopulation · ~21,756,000Languages · Sinhala and Tamil (both official), English widely usedEco Index · 75/100 · Good
The Eco Index across 12 pillars · scored 0 to 5 · World Bank, OWID, WHO/UNICEF JMP, FiBL, Protected Planet, IUCN, UNESCO (2023-24)
Conservation
Wildlife
Water
Food & farming
Organic & clean
Climate & energy
Waste
Health
Heritage
Ownership
Governance
Future
The History of Sri Lanka.
Sri Lanka carries a deep and widely practised living heritage. Kandyan dance with its ves costume and thundering geta bera drumming, Low Country and Sabaragamuwa dance forms, and the healing mask rituals of the Sanni Yakuma are performed to this day, alongside Bharatanatyam among the Tamil community.
Where the name comes from
Śrī Laṅkā in Sinhala and Ilaṅkai in Tamil, from Lanka, the island's name in Sanskrit epic. It was Ceylon under British rule and took its own name back in 1972. Source: UK Permanent Committee on Geographical Names toponymic factfile.
The land itself: low, flat to rolling plain, with mountains through the south-central interior. Its high point is Pidurutalagala, 2,524 m. Source: UK Permanent Committee on Geographical Names toponymic factfile.
Where it starts
Bows in the rainforest
Over a hundred bone arrow points from Fa Hien Lena, a rainforest cave, are around 48,000 years old and are the earliest evidence of bow and arrow technology anywhere outside Africa. Batadomba-lena adds microliths, bone tools and beads from around 36,000 years ago. Together they show sustained human life inside tropical rainforest, an environment long assumed too difficult to occupy. Anuradhapura grew from around 900 BC into one of the longest continuously inhabited cities in South Asia.
How it got here
Water engineering, then three empires
Buddhism was established around 300 BC and the Pali canon was later written down here. Reservoirs and canals were built across the dry zone from the same period, some still in use, including the bisokotuwa, an open well set in the tank bund that colonial engineers read as the world's first valve pit, an attribution later scholarship treats as a nineteenth-century interpretation rather than an established fact. The rock fortress and water garden at Sigiriya were built around 477. Portuguese, Dutch and then British rule followed from 1505, with plantation labour brought from South India. Sri Lanka became independent in 1948, and twenty-six years of civil war ended in 2009.
The timeline
c. 48,000 years ago
Fa Hien Lena.
Over a hundred bone arrow points from a rainforest cave are the earliest evidence of bow and arrow technology outside Africa. ↗
c. 36,000 years ago
Batadomba-lena.
Microliths, bone tools and beads show long-term human life inside tropical rainforest, once thought too difficult to occupy. ↗
c. 900 BC
Anuradhapura.
An urban settlement grows into one of the longest continuously inhabited cities in South Asia. ↗
c. 300 BC
Buddhism arrives.
Buddhism is established and the Pali canon is later written down here. ↗
c. 300 BC to AD 1200
Irrigation engineering.
Reservoirs and canals, some still in use, are built across the dry zone, including the bisokotuwa, an open well in the tank bund whose reading as the world's first valve pit comes from colonial-era engineers and is disputed in later scholarship. ↗
c. 477
Sigiriya.
A rock fortress and water garden are built with frescoes and a mirror wall. ↗
1505 to 1948
Three colonisers.
Portuguese, Dutch and then British rule, with plantation labour brought from South India. ↗
1948
Independence.
The Dominion of Ceylon comes into being on 4 February 1948, with its own parliament. ↗
1983 to 2009
Civil war.
A civil war between the government and the Tamil Tigers runs from 1983 to 2009. Religion and ethnicity were central to it, and it ended militarily rather than by settlement. ↗
Roughly 31% of Sri Lanka's land is protected (World Bank, 2025), including the Sinharaja rainforest World Heritage Site and major national parks such as Yala and Wilpattu. Marine protection is negligible at about 0.3%, and parks face encroachment and human-elephant conflict.
Is wild Sri Lanka protected? 30.8% of the land is, already past the 30% target for 2030
How protected is nature in Sri Lanka?
Forest cover34%
Terrestrial protected area30.8%
Marine protected area0.3%
478 (mammals, birds, fish & plants) listed as threatened.
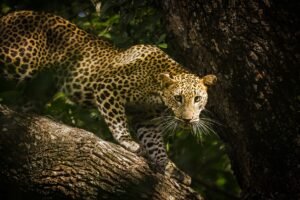
Found only here. Sri Lankan leopard, purple-faced langur, dozens of endemic birds such as the Sri Lanka blue magpie, and many endemic amphibians.
The watchlist
ThreatenedHawksbill (Eretmochelys imbricata)Critically Endangered on the IUCN Red List, and recorded in Sri Lanka in GBIF occurrence data (turtle).
ThreatenedDumbara Agama (Cophotis dumbara)Critically Endangered on the IUCN Red List, and recorded in Sri Lanka in GBIF occurrence data (reptile).
ThreatenedStuart's Shrub Frog (Pseudophilautus stuarti)Critically Endangered on the IUCN Red List, and recorded in Sri Lanka in GBIF occurrence data (amphibian).
ThreatenedAneuretus simoniCritically Endangered on the IUCN Red List, and recorded in Sri Lanka in GBIF occurrence data (insect).
ThreatenedCrudia zeylanicaCritically Endangered on the IUCN Red List, and recorded in Sri Lanka in GBIF occurrence data (plant).
ThreatenedCeylonthelphusa sanguineaCritically Endangered on the IUCN Red List, and recorded in Sri Lanka in GBIF occurrence data (species).
ThreatenedErdelen's Horned Lizard (Ceratophora erdeleni)Critically Endangered on the IUCN Red List, and recorded in Sri Lanka in GBIF occurrence data (reptile).
ThreatenedAspidura ravanaiCritically Endangered on the IUCN Red List, and recorded in Sri Lanka in GBIF occurrence data (reptile).
Critically Endangered, the last IUCN category before Extinct in the Wild, and still recorded in Sri Lanka. GBIF holds 41 verified occurrence records.
Dumbara Agama (Cophotis dumbara)
Critically Endangered, the last IUCN category before Extinct in the Wild, and still recorded in Sri Lanka. GBIF holds 32 verified occurrence records.
Stuart's Shrub Frog (Pseudophilautus stuarti)
Critically Endangered, the last IUCN category before Extinct in the Wild, and still recorded in Sri Lanka. GBIF holds 59 verified occurrence records.
Aneuretus simoni
Critically Endangered, the last IUCN category before Extinct in the Wild, and still recorded in Sri Lanka. GBIF holds 12 verified occurrence records.
Species named here are drawn from GBIF occurrence records for Sri Lanka filtered to the IUCN Red List threatened categories. Species are listed where GBIF holds occurrence records for them in this country. Record counts are not published here because the figure cannot be reproduced from a public GBIF query.
National park in Uva Province, mapped and named in the open record for Sri Lanka. OpenStreetMap.
Water and Ocean in Sri Lanka.
Sri Lanka is watered by two monsoons and stores rain in a 2,000-year-old network of tanks (wewa) and reservoirs fed by rivers such as the Mahaweli, so raw supply is abundant. Even so, only about 47% of people have safely managed drinking water (World Bank, 2024), and the dry-zone farming belt suffers a serious chronic kidney disease (CKDu) problem linked to water quality. Basic access is widespread but safe, on-premises water is not universal.
Does Sri Lanka have enough fresh water? Yes, with headroom
46.9% of people here have safely managed drinking water at home (2024, WHO/UNICEF JMP). Coverage is well short of universal, so a visitor should not assume the tap is safe.
Cleanest water: Hill-country streams in Horton Plains and the Knuckles range.
How much fresh water does Sri Lanka have, per person?
2,380 m³
Sri Lanka
1,000 m³
the UN “water scarce” line
Sri Lanka withdraws about 12,946 million cubic metres of fresh water a year (2022). That is 90.8% of the fresh water actually available to it, which FAO counts as critical water stress. Of what is taken, farming takes 87%, homes and towns 6%, industry 6%. Source: FAO AQUASTAT.
What are the rules on Sri Lanka beaches?
✕Tap water: Not drinkable.
✓Plastic rules: Partial: polystyrene and several single-use plastic items banned since 2017..
✕Solo travel: rated take care on the record for this destination.
✕Marine protection: 0.3% of the sea is protected. The 30x30 pledge for 2030 is not met yet.
Named on the open map: Ahangama Beach, Ahangama Secret Beach, Awesome Beach and Dunes, Dehiwala Beach, Kirinde Beach, Marakolliya Beach, Midigama Beach, Panama Beach. That is 11 named beaches in the public record for Sri Lanka, each one a place you can look up before you go. OpenStreetMap.
How is the sea around Sri Lanka doing?
One cross-section, every answer measured.
Surface
What the coast carries
Two monsoon windows, SW May–Sep, NE Nov–Feb; the south coast is best Nov–Apr.
Nearshore
Protected water
0.3% of territorial waters are protected, against the 30% pledged for 2030 under the Global Biodiversity Framework.
Cleanest
Where the water is cleanest
Hill-country streams in Horton Plains and the Knuckles range..
The record
Measured
Sri Lanka is watered by two monsoons and stores rain in a 2,000-year-old network of tanks (wewa) and reservoirs fed by rivers such as the Mahaweli, so raw supply is abundant. Even so, only about 47% of people have safely managed drinking water (World Bank, 2024), and the dry-zone farming belt suffers a serious chronic kidney disease (CKDu) problem linked to water quality.
Sea protected
0.3%
Against the 30% pledged for 2030 under the Global Biodiversity Framework.
Threatened species
478 (mammals, birds, fish & plants)
Mammals, birds, fish and higher plants on the IUCN list.
Cleanest water
here
Hill-country streams in Horton Plains and the Knuckles range..
Is the tap water safe in Sri Lanka?
46.9% of people have safely managed drinking water at home (2024, WHO/UNICEF JMP). Renewable fresh water works out at about 2,380 cubic metres per person a year (World Bank).
How hard is the water supply being pushed?
Of every 10 buckets nature refills, 9 are already taken. Withdrawals run at 90.8% of what Sri Lanka renews internally each year (2022, World Bank / FAO AQUASTAT). That is past the 25% mark generally treated as water stress, so the supply is being pushed towards its limit.
When is the best time to visit Sri Lanka? Tap your month.
Tap your month.
JanFebMarAprMayJunJulAugSepOctNovDec
.
How much fresh water does Sri Lanka actually have?
Nature renews about 2,380 cubic metres of fresh water per person per year here. That ranks Sri Lanka 93 of 208 countries measured, putting it in the drier half of the world. The UN treats anything under 1,000 cubic metres as water scarce, and this is above that line. World Bank / FAO AQUASTAT.
Agriculture is central to Sri Lanka, which is largely self-sufficient in its staple rice and a major grower of tea, coconut, rubber and spices. No verified import figure was found, and wheat, sugar, dairy and pulses are imported, but the farm sector is large and food culture is deeply local.
Where does the food in Sri Lanka come from?
15.3% imported
about US$3,285m a year
On the plate: Rice and curry, dhal, coconut (sambol), jackfruit, string hoppers and spices.
How often each food is on the plate
Share of people eating each one regularly. These overlap, so they do not add up to 100%.
Rice60%
Curry51%
Dhal42%
Jackfruit15%
2 of 10
bites are imported
The island buys in more food energy than it eats. About US$3,285m a year leaves the country to pay for it. The green slice is roughly what still grows here.
About 15.3% of everything Sri Lanka buys in from abroad is food, roughly 2 in every 10 imported items on the dock (2024, World Bank). Farming itself is 8.4% of the economy and 48.6% of the land is agricultural, of which 22.2% is arable. The green slice is roughly what still grows here.
What is killing people in Sri Lanka? The imported diet.
Cause of death, and the diet behind it.
Non-communicable diseases, all combined74.8%
Diabetes10.2%
Adults living with overweight or obesity. 38.8%.
Can Sri Lanka feed itself?
22.2%
Arable land
48.6%
Agricultural land
2,136,999
Farmers
3,390,281
Arable acres
8.4%
Agriculture, share of GDP
Harvest: Rice Maha harvest around February to March and Yala harvest around August to September; tea year-round.
Feeding itself
Agriculture is central to Sri Lanka, which is largely self-sufficient in its staple rice and a major grower of tea, coconut, rubber and spices. No verified import figure was found, and wheat, sugar, dairy and pulses are imported, but the farm sector is large and food culture is deeply local.
Certification
About 2.6% of agricultural land is certified organic (FiBL, 2020 data), helped by organic tea, spice and coconut estates aimed at export markets. A 2021 nationwide chemical-fertiliser ban was abrupt, damaged harvests and was reversed.
Water for crops
Sri Lanka is watered by two monsoons and stores rain in a 2,000-year-old network of tanks (wewa) and reservoirs fed by rivers such as the Mahaweli, so raw supply is abundant. Even so, only about 47% of people have safely managed drinking water (World Bank, 2024), and the dry-zone farming belt suffers a serious chronic kidney disease (CKDu) problem linked to water quality.
Why the organic number looks like that. Certified-organic farmland is not separately reported for Sri Lanka, and that is a certification gap rather than proof nothing is grown cleanly. What the official land record does show: 48.6% of the country is agricultural land and 22.2% is arable (2023, World Bank). Certification is paid for per farm per year by a foreign body, which prices out smallholders, so the organic number reads worse than the practice.
The plant-based kitchen here is not an import. By tonnage, the largest crops grown in Sri Lanka are rice, coconuts, tea leaves, plantains and cooking bananas and sugarcane (FAO, FAOSTAT crop production, 2024). That is what the land itself puts on a plate.
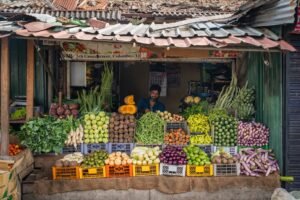
Buy direct where residents buy: Baddegama General Market Place, Boralesgamuwa Public Market, Denipitiya Market, Dompe Weekly Market, Fish Market, Kalviyankadu Market. Each is a mapped, named marketplace, so the money stays with the seller rather than the importer. OpenStreetMap.
Sri Lanka is a very low per-capita emitter at roughly 0.93 tonnes of CO2 per person, far below the global average, reflecting modest industrialisation and heavy reliance on public transport and biomass. Renewable sources supplied about 49% of electricity in 2023, led by hydropower at 36% with solar and wind adding a further 11%, while the balance came from fuel oil and the Norochcholai coal plant. The government has committed to a 100% renewable electricity target and net-zero by 2050, and renewable output has since climbed towards 70% in favourable rainfall years. Coal and imported fuel oil, together with fuel-supply crises, still expose the grid, which holds the score below the top band despite the country's genuinely low emissions.
What powers Sri Lanka?
Renewable 61.6%Fossil 38.4%
Climate pollution per person
The safe amount, what the planet can absorb
2 tonnes
One person here
1.06 tonnes
The world average, for comparison
4.7 tonnes
The worst it ever got
1.06 tonnes
The grid
Sri Lanka is a very low per-capita emitter at roughly 1.06 tonnes of CO2 per person, far below the global average, reflecting modest industrialisation and heavy reliance on public transport and biomass. Renewable sources supplied about 49% of electricity in 2023, led by hydropower at 36% with solar and wind adding a further 11%, while the balance came from fuel oil and the Norochcholai coal plant.
Pollution
Fine-particle pollution is moderate at about 19 micrograms per cubic metre (AQLI, 2022). Sri Lanka's 2017 order on polystyrene and single-use plastics was revoked and replaced by a wider ban under Gazette Extraordinary 2341/30, in force since 1 October 2023, covering single-use straws, stirrers, cutlery, plates, cups, expanded polystyrene meal boxes, garlands and string hopper trays, but litter and plastic leakage remain visible, especially around towns and waterways.
Water stress
Sri Lanka is watered by two monsoons and stores rain in a 2,000-year-old network of tanks (wewa) and reservoirs fed by rivers such as the Mahaweli, so raw supply is abundant. Even so, only about 47% of people have safely managed drinking water (World Bank, 2024), and the dry-zone farming belt suffers a serious chronic kidney disease (CKDu) problem linked to water quality.
What pollutes most here
1The gridThe share of electricity still generated from fossil fuel.50.8%
2IndustryCoastal prawn farming that clears mangroves, and river sand mining..named
3AirModelled annual mean against a WHO guideline of 5 µg/m³.19.1
4On the recordFine-particle pollution is moderate at about 19 micrograms per cubic metre (AQLI, 2022).
What has Sri Lanka promised on climate?
Net zero, whole economy2050 (per LTS); 2060 (per NDC)
Electricity renewable today49.2% (2021)
Land protected, against a 30% target30.8% by 2025
Sea protected, against a 30% target0.3% by 2025
The net-zero target year on file with Climate Watch is 2050 (per LTS); 2060 (per NDC), status: in policy document. Measured against it, 49.2% of electricity is already renewable (2021, World Bank), so 50.8% of the grid is still to be converted. The pledge on file is measured here against what has actually been delivered, not taken on its own (UNFCCC NDC Registry, CBD Kunming-Montreal Target 3).
The biggest line item
One return flight against a whole year of living.
A resident's entire year1.06 t CO2e
Safe-climate budget, per year2 t CO2e
Los Angeles return, economy2.72 t CO2e
New York return, economy2.54 t CO2e
Sydney return, economy1.58 t CO2e
London return, economy1.57 t CO2e
Paris return, economy1.53 t CO2e
How much CO2 does flying to Sri Lanka emit?
Tap where you would fly from. One return flight, economy.
Every prompt runs on a machine in a building on somebody’s grid. What that costs the planet depends less on the prompt than on what is burning to power it. Here is what would power one in Sri Lanka.
Data centres
1
Registered colocation and interconnection facilities, PeeringDB, 2026
Grid renewable
61.6 %
What a machine here runs on.
What powers a data centre in Sri Lanka?
A machine here runs mostly on renewables, but not entirely.
Renewable 61.6%Fossil 38.4%
Cooling water. Every one of those halls runs on the national grid, which is 49.2% renewable today (World Bank). A data centre is only as clean as the electricity behind it, so the same figure that decides this country's climate score also decides the footprint of the AI running inside it. Cooling water use is not separately published by facility, and no operator here reports it.
The rules. Sri Lanka has 1 colocation and interconnection facilities on the public PeeringDB register, concentrated in Colombo (1), alongside 1 internet exchange (Colocix Internet Exchange). Named sites include Lanka Bell Limited.
Where the cables land. 4 landing points · Colombo, Matara, Mt. Lavinia, Ratmalana
91% residents to 9% visitors across a year. 2,027,000 international arrivals in 2019 against 21,756,000 people who live here (2025, World Bank / UN Tourism).
Where a visitor dollar goes in Sri Lanka
540k
Visitors a year
0.0
Visitors per resident
How deep in debt is Sri Lanka?· for every $100 Sri Lanka earns in a year, it owes…
Pay to the order of: the creditorsmemo · the 2022 peak
$ 116The worst year on the IMF record. Sri Lanka owed $116 for every $100 it earned.
IMF World Economic Outlook, 2022signed, the creditors
Pay to the order of: the creditorsmemo · today
$ 101What is owed now, for every $100 of national income (2024).
IMF World Economic Outlook, 2024signed, the creditors
For every $100 Sri Lanka earns in a year, it owes $101 (2024, IMF World Economic Outlook). That is more than a full year of national income, and the interest is paid before anything else.
Where does a tourist dollar actually go in Sri Lanka?
Play one tourist dollar around the board. Every square is a measured fact from this page.
START!
1
GO: a visitor lands
$100 goes on the table. 2,027,000 international arrivals in 2019 against 21,756,000 residents, one visitor a year for every 11 residents (World Bank / UN Tourism).
$100 in play
2
The bed
Who owns the largest places to stay in Sri Lanka is not published in the records we can check, so this square is left open rather than guessed. Where a listing names its owner, it is shown in the ownership table below.
not published
3
The plate
Food is 15.3% of everything Sri Lanka imports (2024, World Bank), so a large part of every restaurant bill is paid to a supplier abroad. Eating what the land here actually grows, rice, coconuts, tea, sugarcane, plantains, fiber crops, cassava, pumpkins/squash, keeps that money with the grower.
sails in
4
The power
49.2% of the electricity is renewable (2021, World Bank), so the energy on the bill is mostly generated inside the country rather than shipped in.
made at home
5
What actually stays
On the parts that can be measured, the plate leaves and the power stays. It is genuinely a coin toss, decided by what you book.
split
6
Pay the bank first
Sri Lanka owes $101 for every $100 it earns (2024, IMF World Economic Outlook). The interest is paid before anything else on this board.
$101 per $100
7
A spread hand
The largest single export, knitted clothing, is 22.6% of the total (2023, UN Comtrade). No one shock can take the whole board.
top export 22.6%
8
Community chest
Tourism earns 8.2% of everything Sri Lanka makes from exports (2020, World Bank / UN Tourism). That is how much of the economy depends on the game continuing.
8.2% of exports
9
The flight
Getting here is usually the biggest single line on the bill. From Los Angeles a return economy seat is 2.72 t CO2, on the UK Government's published conversion factors. It is the one part of the trip this board cannot reduce.
2.72 t CO2
10
Back to GO
The economy turns over about US$99 billion a year (2024, IMF). Every lap of this board is a choice about how much of it stays.
US$99bn
GDPUS$108.8bn
Agriculture, share of GDP8.4%
Visitors a year540,000
Visitors per resident0
Residents~21,756,000
Agriculture
Farming is 8.4% of the economy. Agriculture is central to Sri Lanka, which is largely self-sufficient in its staple rice and a major grower of tea, coconut, rubber and spices.
Natural materials
Sri Lanka is a leading world producer of coir, the fibre from coconut husks, and keeps living handloom cotton, reed and palm weaving (including Dumbara mats) and batik traditions. These remain everyday crafts and export industries.
Energy
Sri Lanka is a very low per-capita emitter at roughly 1.06 tonnes of CO2 per person, far below the global average, reflecting modest industrialisation and heavy reliance on public transport and biomass. Renewable sources supplied about 49% of electricity in 2023, led by hydropower at 36% with solar and wind adding a further 11%, while the balance came from fuel oil and the Norochcholai coal plant.
Who owns the biggest hotels in Sri Lanka?
By rooms · company records and press.
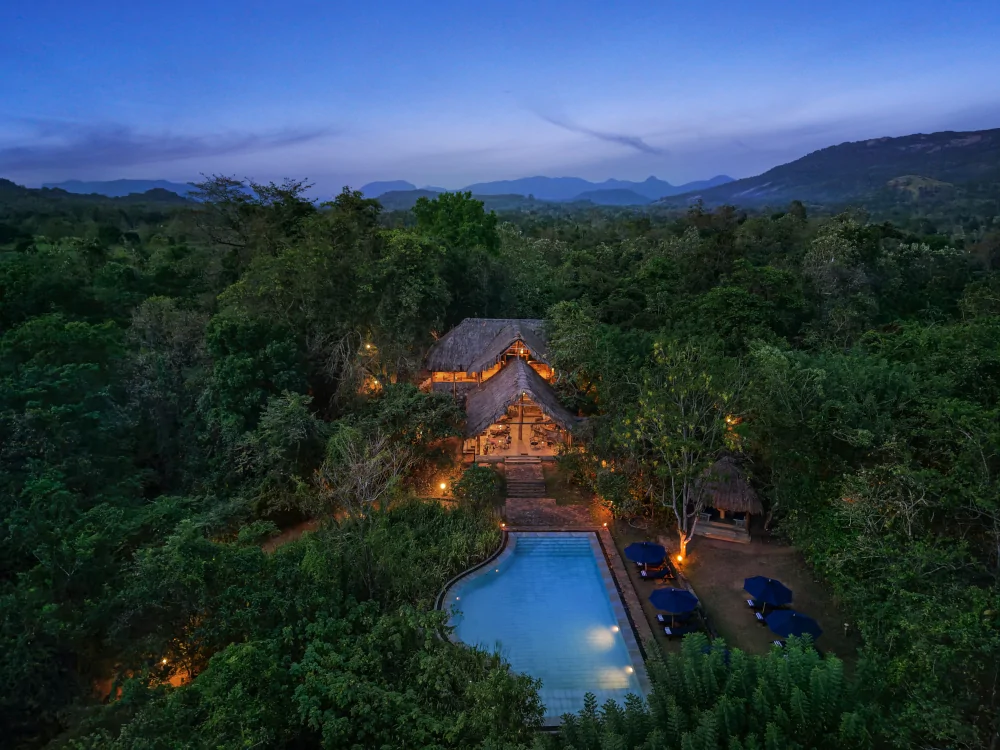
Gal Oya Lodge · ~10 roomsIndependentnot published
Visitors, over time
20151,993k
20162,168k
20172,248k
20182,521k
20192,027k
2020540k
International tourism receipts run at about US$1.08 billion in 2020 (World Bank / UN Tourism). That is 8.2% of everything the country earns from exports.
How much of your money actually stays here?
Tap the holiday you are planning.
All-inclusive resortForeign-owned hotel and tourist restaurantsLocally owned stay and local restaurantsGuesthouse, markets and public transport
Resort guest, villa renter, family, nomad or backpacker. The honest playbook for each, from the same sourced numbers.
Already booked a resort? · the rescue list
Five swaps that move your money back on-island
1. Eat where the country eats Choose kitchens cooking what the land here grows, rice, coconuts, tea, sugarcane, plantains, fiber crops, cassava and pumpkins/squash, over an imported menu. The checked list →
2. Book with a local operator Never the lobby desk. The margin on a tour is the part that stays. Eco tours →
3. Stay somewhere locally owned Ownership decides where the room rate books. Eco stays →
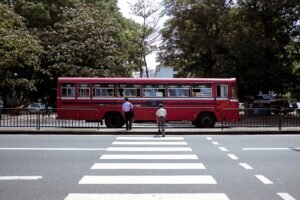
4. Use the transport residents use Scenic hill-country trains, buses and tuk-tuks; many visitors hire a car with a driver.
5. Buy the craft, not the souvenir Natural-materials work made here pays the maker directly; imported gifts pay a shipping line.
swipe →
First time here
A compact tropical island of exceptional endemism, ancient tank irrigation and deeply plant-based food, held back by water-safety and waste gaps.
Best time: December to March for the west and south coasts and the hill country; May to September for the east coast.
Getting around
Scenic hill-country trains, buses and tuk-tuks; many visitors hire a car with a driver.
Transport is where the fare either stays or leaves.
Eating here
The everyday plate that actually grows here is rice, coconuts, tea, sugarcane, plantains, fiber crops, cassava and pumpkins/squash. Ordering those keeps the money with the grower and cuts the imported share of the meal.
Eating what the country grows is the cheapest way to cut the import bill.
Good to know
Cash in the provinces; LKR. Tuk-tuks are the negotiation sport; dress modestly at temples.
Rate my hotel. Tap yours for the honest verdict.
Ownership from company records and press.
Gal Oya Lodge
.
Who owns the place to stay
Gal Oya LodgeIndependent · 10 rooms
The one property listed here does not publish who ultimately owns it, so no claim is made either way. Ownership is what decides how much of a room rate stays in the country, which is why we show it when a listing states it.
Society and Governance in Sri Lanka.
How well is Sri Lanka actually run?
Governance, measured · World Bank WGI
Four measured answers, none of them opinion. Averaged across corruption control, delivery and accountability, Sri Lanka scores 47 out of 100 (2024, World Bank Worldwide Governance Indicators). That matters here because every pledge on this page is only as good as the machinery meant to deliver it.
How well is Sri Lanka run? · each scored out of 100, higher is better
Clean government, scored 40 of 100
Control of corruption scores 40.1 out of 100 (2024, World Bank Worldwide Governance Indicators). That is below the halfway mark of governments measured.
40
Freedom and rights, scored 55 of 100
Voice and accountability, which measures free expression, free media and the ability to choose a government, scores 54.6 out of 100 (2024, World Bank WGI). Citizens have some room to question their government.
55
Government effectiveness, scored 46 of 100
Government effectiveness, which measures the quality of public services and how well policy is actually delivered, scores 46 out of 100 (2024, World Bank WGI). Delivery is rated below average, so a pledge on paper is not the same as a pledge kept.
46
Income equality, scored 38 of 100
The Gini index of income inequality reads 37.7 (2019, World Bank). Zero is perfect equality and 100 is one person holding everything. Below 40 is the level usually treated as manageable, and Sri Lanka sits inside it.
38
LGBTQ+ status: LowSolo female travel: Take care92.7% adult literacyIndustry to avoid: Coastal prawn farming that clears mangroves, and river sand mining.
What is daily life in Sri Lanka really like? Measured
Getting around, breathing, throwing away, learning. The honest checklist.
TransportAirWaterWastePower
✓How you get around Scenic hill-country trains, buses and tuk-tuks; many visitors hire a car with a driver.
✓Air quality, measured Modelled annual mean 19.1. The WHO guideline is 5 µg/m³.
✓Where the air is cleanest The central highlands around Nuwara Eliya and Horton Plains.
·Tap water Not drinkable
✓What to drink Bottled water; tea-country springs are clean but still best bottled or treated.
✓Plastic rules Partial: polystyrene and several single-use plastic items banned since 2017.
✓Sockets and voltage Type C/F, 230V
92.7%
literacy. Public spending on education runs at 1.8% of GDP and 7.2% of all government spending, and secondary enrolment stands at 88.0% gross (UNESCO Institute for Statistics, 2023 to 2024).
Made in Sri Lanka.
Sri Lanka is a leading world producer of coir, the fibre from coconut husks, and keeps living handloom cotton, reed and palm weaving (including Dumbara mats) and batik traditions. These remain everyday crafts and export industries. Every step of processing done at home is value that stops leaving the country.
What Sri Lanka actually sells the world
The single biggest thing Sri Lanka sells the world is knitted clothing, 22.6% of all exports in 2023 (about US$2.73 billion, UN Comtrade). The next four are woven clothing at 14.6%, coffee, tea and spices at 13.8%, rubber at 7.8%, pearls, gemstones and precious metals at 3.6%.
Sells now · 22.6% of exports
Knitted clothing
Knitted clothing is 22.6% of everything Sri Lanka sold abroad in 2023, worth about US$2.73 billion. UN Comtrade.
Sells now · 14.6% of exports
Woven clothing
Woven clothing is 14.6% of everything Sri Lanka sold abroad in 2023, worth about US$1.75 billion. UN Comtrade.
Sells now · 13.8% of exports
Coffee, tea and spices
Coffee, tea and spices is 13.8% of everything Sri Lanka sold abroad in 2023, worth about US$1.67 billion. UN Comtrade.
Sells now · 7.8% of exports
Rubber
Rubber is 7.8% of everything Sri Lanka sold abroad in 2023, worth about US$0.94 billion. UN Comtrade.
Sells now · 3.6% of exports
Pearls, gemstones and precious metals
Pearls, gemstones and precious metals is 3.6% of everything Sri Lanka sold abroad in 2023, worth about US$0.43 billion. UN Comtrade.
Could make · grown here already
Rice
Grown in Sri Lanka and mostly sold raw. Processing it here would keep the margin here.
Could make · grown here already
Curry
Grown in Sri Lanka and mostly sold raw. Processing it here would keep the margin here.
Could make · grown here already
Dhal
Grown in Sri Lanka and mostly sold raw. Processing it here would keep the margin here.
The maths for an entrepreneur. Sri Lanka produces about US$109 billion a year, which is roughly US$5,002 per person (2025, World Bank). Farming is 8.4% of that, while food is 15.3% of everything the country imports. The country buys in more food than its own farms contribute to the economy, and every point of that gap is a business someone could build here rather than ship in. With 22.2% of the land arable, the raw material for that is already in the ground.
A living tradition of Sri Lanka, still practised rather than archived.
Low Country
A living tradition of Sri Lanka, still practised rather than archived.
Sabaragamuwa dance with geta bera drumming
A living tradition of Sri Lanka, still practised rather than archived.
Sanni Yakuma healing mask rituals
A living tradition of Sri Lanka, still practised rather than archived.
BharatanatyamA living tradition of Sri Lanka, still practised rather than archived.
Baila musicA living tradition of Sri Lanka, still practised rather than archived.
Does Sri Lanka protect its heritage by law?
Partly, and the gaps say as much as the protections.
What is kept alive. Sri Lanka carries a deep and widely practised living heritage. Kandyan dance with its ves costume and thundering geta bera drumming, Low Country and Sabaragamuwa dance forms, and the healing mask rituals of the Sanni Yakuma are performed to this day, alongside Bharatanatyam among the Tamil community. The annual Kandy Esala Perahera parades caparisoned elephants, dancers and drummers in honour of the Sacred Tooth Relic, one of Asia's grandest living processions.
Who it belongs to. Living Sinhalese, Tamil and Muslim communities and the small indigenous Vedda people sustain strong village, temple and craft traditions, and community homestay and village tourism are growing. A large resort and package sector sits alongside this, so how much money reaches locals varies.
Only here. True Ceylon cinnamon (Cinnamomum verum), of which Sri Lanka grows the large majority of the world's supply..
Three futures for Sri Lanka, every one run forward from measured data.
Where the making actually happens
Named cultural and craft sites on the open map: Triangle (Central Province), Henarathgoda Botanical Garden (Gampaha), Hakgala Botanical Garden (Central Province), Dry Zone Botanical Garden (Hambantota), Seethawaka Wet Zone Botanical Garden (Western Province). OpenStreetMap. Named craft workshops on the open map: Amali Brassware, Crafts Gallery, Kumara Brass Carving, Nuwan Brassware.
Every measured trend on one line
Run forward at the pace already recorded.
-6%
Forest cover
1995: 36 % → 2023: 34 %
-47%
Renewable electricity
1995: 92.7 % → 2021: 49.2 %
+200%
CO2 per person
1995: 0.36 t → 2024: 1.07 t
+30%
Tourist arrivals
1995: 414 k → 2020: 540 k
+40%
Protected land
2013: 22 % → 2025: 30.8 %
-27%
Farm workforce
1995: 35.3 % → 2025: 25.9 %
+200%
Protected sea
2013: 0.1 % → 2025: 0.3 %
+31%
Agricultural land
1995: 37.1 % → 2023: 48.6 %
+29%
Urban population
1995: 15.9 % → 2025: 20.5 %
-27%
Air pollution
1995: 31.1 µg/m³ → 2023: 22.7 µg/m³
-21%
Fresh water per person
1995: 3006.1 m³ → 2022: 2380.4 m³
+227%
Adult overweight
1995: 11.9 % → 2022: 38.8 %
+42%
Electricity access
2000: 70.3 % → 2024: 100 %
+574%
GDP per person
1995: 742 → 2025: 5002
+24%
Population
1995: 17564 k → 2025: 21756 k
-30%
Renewable energy use
1995: 69.9 % → 2021: 48.8 %
+36%
Energy per person
1995: 342 kg → 2023: 466.7 kg
+48%
Protected area, total
2013: 2.5 % → 2025: 3.7 %
+11%
Life expectancy
1995: 69.8 yrs → 2024: 77.7 yrs
+25%
Cereal yield
1995: 3053 ha → 2023: 3804 ha
-34%
Fertiliser use
1995: 232.2 ha → 2023: 153.9 ha
-5%
Rural population
1995: 84.1 % → 2025: 79.6 %
+167%
Water productivity
1995: 2.59 $/m3 → 2022: 6.91 $/m3
-10%
Health spending
2000: 4.11 % → 2023: 3.68 %
-7%
Forest area
1995: 22584 km2 → 2023: 21035 km2
+188%
Electric power use
1995: 224.1 kWh → 2023: 644.5 kWh
-7%
Emissions: Agriculture
1990: 7.3 e → 2023: 6.8 e
-21%
Emissions: Building
1990: 3.71 e → 2023: 2.94 e
+4933%
Emissions: Electricity/Heat
1990: 0.15 e → 2023: 7.55 e
+161%
Emissions: Energy
1990: 7.4 e → 2023: 19.3 e
+429%
Emissions: Industrial Processes
1990: 0.17 e → 2023: 0.9 e
+102%
Emissions: Manufacturing/Construction
1990: 0.45 e → 2023: 0.91 e
+202%
Emissions: Transportation
1990: 2.55 e → 2023: 7.7 e
World Bank open data, recorded series
How much forest is left?
Forest cover moved from 36.0% to 34.0% across 28 recorded years.
World Bank AG.LND.FRST.ZS
How clean is the grid?
Renewable electricity moved from 92.7% to 49.2% across 26 recorded years.
World Bank EG.ELC.RNEW.ZS
How much climate pollution per person?
CO2 per person moved from 0.4 t to 1.1 t across 29 recorded years.
World Bank EN.GHG.CO2.PC.CE.AR5
How many people visit?
Tourist arrivals moved from 414k to 540k across 25 recorded years.
World Bank ST.INT.ARVL
How much land is protected?
Protected land moved from 22.0% to 30.8% across 12 recorded years.
World Bank ER.LND.PTLD.ZS
How many people still farm?
Farm workforce moved from 35.3% to 25.9% across 30 recorded years.
World Bank SL.AGR.EMPL.ZS
How much sea is protected?
Protected sea moved from 0.1% to 0.3% across 12 recorded years.
World Bank ER.MRN.PTMR.ZS
How much land is farmed?
Agricultural land moved from 37.1% to 48.6% across 28 recorded years.
World Bank AG.LND.AGRI.ZS
How fast is it urbanising?
Urban population moved from 15.9% to 20.4% across 30 recorded years.
World Bank SP.URB.TOTL.IN.ZS
Is the air getting cleaner?
Air pollution moved from 31.1 µg/m³ to 22.7 µg/m³ across 28 recorded years.
World Bank EN.ATM.PM25.MC.M3
Is water getting scarcer?
Fresh water per person moved from 3006.1 m³ to 2380.4 m³ across 27 recorded years.
World Bank ER.H2O.INTR.PC
Is diet-related disease rising?
Adult overweight moved from 11.9% to 38.8% across 27 recorded years.
World Bank SH.STA.OWAD.ZS
Who has power?
Electricity access moved from 70.3% to 100.0% across 24 recorded years.
World Bank EG.ELC.ACCS.ZS
Is income rising?
GDP per person moved from 742 to 5002 across 30 recorded years.
World Bank NY.GDP.PCAP.CD
How fast is it growing?
Population moved from 17564k to 21756k across 30 recorded years.
World Bank SP.POP.TOTL
What share of all energy is renewable?
Renewable energy use moved from 69.9% to 48.8% across 26 recorded years.
World Bank EG.FEC.RNEW.ZS
How much energy does one person use?
Energy per person moved from 341.96 kg to 466.72 kg across 28 recorded years.
World Bank EG.USE.PCAP.KG.OE
How much land and sea is protected together?
Protected area, total moved from 2.5% to 3.7% across 12 recorded years.
World Bank ER.PTD.TOTL.ZS
How long do people live?
Life expectancy moved from 69.75 yrs to 77.67 yrs across 29 recorded years.
World Bank SP.DYN.LE00.IN
How much does a hectare of cereal produce?
Cereal yield moved from 3053 kg/ha to 3804 kg/ha across 28 recorded years.
World Bank AG.YLD.CREL.KG
How much fertiliser goes on the land?
Fertiliser use moved from 232.16 kg/ha to 153.94 kg/ha across 28 recorded years.
World Bank AG.CON.FERT.ZS
How many people still live rurally?
Rural population moved from 84.13% to 79.55% across 30 recorded years.
World Bank SP.RUR.TOTL.ZS
How much value per cubic metre of water?
Water productivity moved from 2.59 $/m3 to 6.91 $/m3 across 27 recorded years.
World Bank ER.GDP.FWTL.M3.KD
How much goes on health?
Health spending moved from 4.11% to 3.68% across 23 recorded years.
World Bank SH.XPD.CHEX.GD.ZS
How much forest is there in total?
Forest area moved from 22584 km2 to 21035 km2 across 28 recorded years.
World Bank AG.LND.FRST.K2
How much electricity per person?
Electric power use moved from 224.09 kWh to 644.46 kWh across 28 recorded years.
World Bank EG.USE.ELEC.KH.PC
How have agriculture emissions moved?
Agriculture emissions moved from 7.3 to 6.8 MtCO2e across 33 recorded years.
Climate Watch (WRI), historical emissions
How have building emissions moved?
Building emissions moved from 3.71 to 2.94 MtCO2e across 33 recorded years.
Climate Watch (WRI), historical emissions
How have electricity/heat emissions moved?
Electricity/Heat emissions moved from 0.15 to 7.55 MtCO2e across 33 recorded years.
Climate Watch (WRI), historical emissions
How have energy emissions moved?
Energy emissions moved from 7.4 to 19.3 MtCO2e across 33 recorded years.
Climate Watch (WRI), historical emissions
How have industrial processes emissions moved?
Industrial Processes emissions moved from 0.17 to 0.9 MtCO2e across 33 recorded years.
Climate Watch (WRI), historical emissions
How have manufacturing/construction emissions moved?
Manufacturing/Construction emissions moved from 0.45 to 0.91 MtCO2e across 33 recorded years.
Climate Watch (WRI), historical emissions
How have transportation emissions moved?
Transportation emissions moved from 2.55 to 7.7 MtCO2e across 33 recorded years.
Climate Watch (WRI), historical emissions
Worst caseCurrent pathBest case
Worst case
Every measured decline continues at the pace already recorded. The weakest pillar, recycling at 2/5, is the one that gives way first.
Computed from: recorded series extended with no policy change
Current path
Every line above is a recorded World Bank series for this country. The current path is simply those series continuing at the pace already measured.
Computed from: recorded series, no policy change assumed
Best case
The pledges are met on their own stated timetables and the weakest pillars are lifted to match the strongest. Sri Lanka already shows it can do this: plant-based eating scores 5/5.
Computed from: each published target delivered on its own date
What the best case actually asks for
Lift recycling
It scores 2 out of 5 today, among the weakest parts of Sri Lanka's record. Formal municipal recycling is very low and most waste is landfilled or open-dumped, a risk underlined by the fatal 2017 Meethotamulla dump collapse in Colombo. An informal sector recovers some PET and metal. Lifting it toward the 5/5 the strongest pillars already reach is what the best case turns on.
measured each year
Costs: spending and enforcement, not new technology
Lift organic farming
It scores 3 out of 5 today, among the weakest parts of Sri Lanka's record. About 2.6% of agricultural land is certified organic (FiBL, 2020 data), helped by organic tea, spice and coconut estates aimed at export markets. A 2021 nationwide chemical-fertiliser ban was abrupt, damaged harvests and was reversed. Lifting it toward the 5/5 the strongest pillars already reach is what the best case turns on.
measured each year
Costs: spending and enforcement, not new technology
Lift pollution
It scores 3 out of 5 today, among the weakest parts of Sri Lanka's record. Fine-particle pollution is moderate at about 19 micrograms per cubic metre (AQLI, 2022). Sri Lanka's 2017 order on polystyrene and single-use plastics was revoked and replaced by a wider ban under Gazette Extraordinary 2341/30, in force since 1 October 2023, covering single-use straws, stirrers, cutlery, plates, cups, expanded polystyrene meal boxes, garlands and string hopper trays, but litter and plastic leakage remain visible, especially around towns and waterways. Lifting it toward the 5/5 the strongest pillars already reach is what the best case turns on.
measured each year
Costs: spending and enforcement, not new technology
Government and Goals in Sri Lanka.
Who is in charge of Sri Lanka now · Office-holders from the UN Protocol and Liaison Service public list of Heads of State and Heads of Government, 8 September 2026. Legislature and election dates from IFES ElectionGuide. Constitution dates from the Constitute Project. Governance scores from the World Bank Worldwide Governance Indicators 2024.
Anura Kumara Dissanayake
President
Anura Kumara Dissanayake is the head of government of Sri Lanka, in office since 23 September 2024. Every climate, protection and energy pledge on this page is delivered, or not, under this administration.
Public opinion, measured
Voice and accountability, the freedom to question government: 54.6 / 100. Above the halfway mark of governments measured. World Bank WGI 2024
Control of corruption: 40.1 / 100. Below the halfway mark of governments measured. World Bank WGI 2024
Political stability and absence of violence: 59.9 / 100. Above the halfway mark of governments measured. World Bank WGI 2024
Rule of law: 52.5 / 100. Above the halfway mark of governments measured. World Bank WGI 2024
Regulatory quality: 50.1 / 100. Above the halfway mark of governments measured. World Bank WGI 2024
Anura Kumara DissanayakePresident
ParliamentLegislature, unicameral
Last election14 November 2024
Constitution1978, as revised to 2015
Government typepresidential republic
Sri Lanka national goals: climate commitments on record · as recorded by Climate Watch, World Resources Institute
2050
Net zero
In Policy Document
Net-zero target as recorded by Climate Watch. Status: In Policy Document (6/5/2023, 7/30/2021) ↗
The questions people actually type, answered in full sentences from the sourced data above.
swipe →
Is Sri Lanka sustainable?
Sri Lanka scores 75 out of 100 on the Throne Eco Index, across twelve equally weighted pillars. A compact tropical island of exceptional endemism, ancient tank irrigation and deeply plant-based food, held back by water-safety and waste gaps.
Is the water in Sri Lanka safe and plentiful?
Sri Lanka is watered by two monsoons and stores rain in a 2,000-year-old network of tanks (wewa) and reservoirs fed by rivers such as the Mahaweli, so raw supply is abundant. Even so, only about 47% of people have safely managed drinking water (World Bank, 2024), and the dry-zone farming belt suffers a serious chronic kidney disease (CKDu) problem linked to water quality. Basic access is widespread but safe, on-premises water is not universal.
Can Sri Lanka feed itself?
Agriculture is central to Sri Lanka, which is largely self-sufficient in its staple rice and a major grower of tea, coconut, rubber and spices. No verified import figure was found, and wheat, sugar, dairy and pulses are imported, but the farm sector is large and food culture is deeply local.
Is it easy to eat plant-based in Sri Lanka?
Everyday food is rice and curry, a spread of vegetable, dhal, jackfruit, greens and coconut dishes with sambols, and strong Buddhist and Hindu vegetarian traditions make meat-free eating the easy default. Fresh produce and unprocessed plant staples are cheap and everywhere.
How much of Sri Lanka is actually protected?
Roughly 31% of Sri Lanka's land is protected (World Bank, 2025), including the Sinharaja rainforest World Heritage Site and major national parks such as Yala and Wilpattu. Marine protection is negligible at about 0.3%, and parks face encroachment and human-elephant conflict.
What wildlife is left in Sri Lanka?
Sri Lanka is a global biodiversity hotspot with exceptional endemism, including dozens of endemic birds such as the Sri Lanka blue magpie, many endemic amphibians, the purple-faced langur and the endemic Sri Lankan leopard. Yala holds one of the world's highest leopard densities and Minneriya sees the largest seasonal gathering of wild Asian elephants.
Is Sri Lanka on clean energy?
Sri Lanka is a very low per-capita emitter at roughly 1.06 tonnes of CO2 per person, far below the global average, reflecting modest industrialisation and heavy reliance on public transport and biomass. Renewable sources supplied about 49% of electricity in 2023, led by hydropower at 36% with solar and wind adding a further 11%, while the balance came from fuel oil and the Norochcholai coal plant. The government has committed to a 100% renewable electricity target and net-zero by 2050, and renewable output has since climbed towards 70% in favourable rainfall years.
How polluted is Sri Lanka?
Fine-particle pollution is moderate at about 19 micrograms per cubic metre (AQLI, 2022). Sri Lanka's 2017 order on polystyrene and single-use plastics was revoked and replaced by a wider ban under Gazette Extraordinary 2341/30, in force since 1 October 2023, covering single-use straws, stirrers, cutlery, plates, cups, expanded polystyrene meal boxes, garlands and string hopper trays, but litter and plastic leakage remain visible, especially around towns and waterways.
Does recycling work in Sri Lanka?
Formal municipal recycling is very low and most waste is landfilled or open-dumped, a risk underlined by the fatal 2017 Meethotamulla dump collapse in Colombo. An informal sector recovers some PET and metal.
Is the farming in Sri Lanka organic?
About 2.6% of agricultural land is certified organic (FiBL, 2020 data), helped by organic tea, spice and coconut estates aimed at export markets. A 2021 nationwide chemical-fertiliser ban was abrupt, damaged harvests and was reversed.
Are there natural materials and craft in Sri Lanka?
Sri Lanka is a leading world producer of coir, the fibre from coconut husks, and keeps living handloom cotton, reed and palm weaving (including Dumbara mats) and batik traditions. These remain everyday crafts and export industries.
Is there living culture in Sri Lanka?
Living Sinhalese, Tamil and Muslim communities and the small indigenous Vedda people sustain strong village, temple and craft traditions, and community homestay and village tourism are growing. A large resort and package sector sits alongside this, so how much money reaches locals varies.
What heritage does Sri Lanka keep alive?
Sri Lanka carries a deep and widely practised living heritage. Kandyan dance with its ves costume and thundering geta bera drumming, Low Country and Sabaragamuwa dance forms, and the healing mask rituals of the Sanni Yakuma are performed to this day, alongside Bharatanatyam among the Tamil community. The annual Kandy Esala Perahera parades caparisoned elephants, dancers and drummers in honour of the Sacred Tooth Relic, one of Asia's grandest living processions.
So is Sri Lanka actually green? The measured answer
What is working: land protected at 30.8%.
What is not: sea protected at 0.3% against a 30% mark, renewable electricity at 49.2% against a 100% mark.
Sri Lanka sits 6 of 77 at 75/100. Every name links to its own destination page, built exactly like this one. The full ranking →
What is Sri Lanka particularly good at?
✓Heritage, scored 5/5. Sri Lanka carries a deep and widely practised living heritage. Kandyan dance with its ves costume and thundering geta bera drumming, Low Country and Sabaragamuwa dance forms, and the healing mask rituals of the Sanni Yakuma are performed to this day, alongside Bharatanatyam among the Tamil community. The annual Kandy Esala Perahera parades caparisoned elephants, dancers and drummers in honour of the Sacred Tooth Relic, one of Asia's grandest living processions. Theravada Buddhism and Tamil Hindu devotion remain central to daily life, ancestral deity veneration and Ayurvedic knowledge endure, and the indigenous Vedda people maintain their own language and forest traditions.
✓Plant-based eating, scored 5/5. Everyday food is rice and curry, a spread of vegetable, dhal, jackfruit, greens and coconut dishes with sambols, and strong Buddhist and Hindu vegetarian traditions make meat-free eating the easy default. Fresh produce and unprocessed plant staples are cheap and everywhere.
✓Conservation, scored 4/5. Roughly 31% of Sri Lanka's land is protected (World Bank, 2025), including the Sinharaja rainforest World Heritage Site and major national parks such as Yala and Wilpattu. Marine protection is negligible at about 0.3%, and parks face encroachment and human-elephant conflict.
Where does Sri Lanka score worst?
✕Pollution, scored 3/5. Fine-particle pollution is moderate at about 19 micrograms per cubic metre (AQLI, 2022). Sri Lanka's 2017 order on polystyrene and single-use plastics was revoked and replaced by a wider ban under Gazette Extraordinary 2341/30, in force since 1 October 2023, covering single-use straws, stirrers, cutlery, plates, cups, expanded polystyrene meal boxes, garlands and string hopper trays, but litter and plastic leakage remain visible, especially around towns and waterways.
✕Water, scored 3/5. Sri Lanka is watered by two monsoons and stores rain in a 2,000-year-old network of tanks (wewa) and reservoirs fed by rivers such as the Mahaweli, so raw supply is abundant. Even so, only about 47% of people have safely managed drinking water (World Bank, 2024), and the dry-zone farming belt suffers a serious chronic kidney disease (CKDu) problem linked to water quality. Basic access is widespread but safe, on-premises water is not universal.
✕Recycling, scored 2/5. Formal municipal recycling is very low and most waste is landfilled or open-dumped, a risk underlined by the fatal 2017 Meethotamulla dump collapse in Colombo. An informal sector recovers some PET and metal.
Similar countries doing it better and worse
IndiaScored on the same twelve pillars as Sri Lanka.72
ThailandScored on the same twelve pillars as Sri Lanka.67
LaosScored on the same twelve pillars as Sri Lanka.67
MongoliaScored on the same twelve pillars as Sri Lanka.58
JordanScored on the same twelve pillars as Sri Lanka.50
MaldivesScored on the same twelve pillars as Sri Lanka.42
A note from the lens of mother natureswipe →
Energy, 4/5
Sri Lanka is a very low per-capita emitter at roughly 1.06 tonnes of CO2 per person, far below the global average, reflecting modest industrialisation and heavy reliance on public transport and biomass. Renewable sources supplied about 49% of electricity in 2023, led by hydropower at 36% with solar and wind adding a further 11%, while the balance came from fuel oil and the Norochcholai coal plant.
Food and farming, 4/5
Agriculture is central to Sri Lanka, which is largely self-sufficient in its staple rice and a major grower of tea, coconut, rubber and spices. No verified import figure was found, and wheat, sugar, dairy and pulses are imported, but the farm sector is large and food culture is deeply local.
Heritage, 5/5
Sri Lanka carries a deep and widely practised living heritage. Kandyan dance with its ves costume and thundering geta bera drumming, Low Country and Sabaragamuwa dance forms, and the healing mask rituals of the Sanni Yakuma are performed to this day, alongside Bharatanatyam among the Tamil community.
The Sri Lanka Directory.
Everything on Hold The Throne that sits in Sri Lanka, checked and listed.
World Bank Worldwide Governance Indicators, 2024. Percentile among all governments measured.
Government effectiveness
46 / 100
World Bank Worldwide Governance Indicators, 2024. Percentile among all governments measured.
Rule of law
52.5 / 100
World Bank Worldwide Governance Indicators, 2024. Percentile among all governments measured.
Political stability
59.9 / 100
World Bank Worldwide Governance Indicators, 2024. Percentile among all governments measured.
Voice and accountability
54.6 / 100
World Bank Worldwide Governance Indicators, 2024. Percentile among all governments measured.
Environmental Performance Index
38.8 / 100 · 134 of 180
Yale Environmental Performance Index 2024, ranked 134 of 180 countries assessed.
Ecosystem vitality
39.7 / 100 · 142 of 180
Yale Environmental Performance Index 2024, ranked 142 of 180 countries assessed.
Biodiversity and habitat
32.9 / 100 · 138 of 180
Yale Environmental Performance Index 2024, ranked 138 of 180 countries assessed.
Air pollution
49.1 / 100 · 144 of 180
Yale Environmental Performance Index 2024, ranked 144 of 180 countries assessed.
Terrestrial biomes protected
82.8 / 100 · 40 of 180
Yale Environmental Performance Index 2024, ranked 40 of 180 countries assessed.
Marine protected areas
44.8 / 100 · 108 of 131
Yale Environmental Performance Index 2024, ranked 108 of 131 countries assessed.
How Sri Lanka Is Scored. The Throne Standard.
Every destination on the index is scored the same way, so a 4 in Barbados means exactly what a 4 means in Iceland. No self-declared data and no brochure claims are accepted. Every figure on this page carries its named source and year, and the history on each page names what empire took as plainly as it scores the present.
The 12 pillars every destination is scored on, equally weighted
01
Conservation
Land and sea actually protected, not pledged
02
Wildlife
What survives, what is endemic, what is lost
03
Water
Fresh water per person, and the ocean’s health
04
Food & farming
Whether the place can feed itself
05
Organic & clean
Certified land and pesticide reality
06
Climate & energy
Emissions per person, how the grid is powered
07
Waste
Where the rubbish goes, what comes back
08
Health
What people eat and die of
09
Heritage
Living culture, and what the law keeps standing
10
Ownership
Who owns the economy, how much of a dollar stays
11
Governance
Freedom, honesty, promises kept
12
Future
Measured trends run forward, pledges against pace
What each 0 to 5 pillar score means, in plain words
The institutions above are the ones cited on this page, ranked by how many of its figures they carry. This same sectioned page renders for all 77 scored destinations, each with its own researched history, comparison charts and three-way future. Read the full methodology
Every figure on this page, and where it came from: 90 sources across 31 institutions
World Bank21 FIGURES
Forest area (% of land area) AG.LND.FRST.ZS, 2023 check
Terrestrial protected areas (% of land) ER.LND.PTLD.ZS, 2025 check
Marine protected areas (% of territorial waters) ER.MRN.PTMR.ZS, 2025 check
Renewable electricity output (% of total) EG.ELC.RNEW.ZS, 2021 check
People using safely managed drinking water (% of population) SH.H2O.SMDW.ZS, 2024 check
Threatened species (mammals EN.MAM.THRD.NO, birds EN.BIR.THRD.NO, fish EN.FSH.THRD.NO, higher plants EN.HPT.THRD.NO), 2022 check
CO2 emissions per capita EN.GHG.CO2.PC.CE.AR5, 2024 check
Terrestrial protected areas (% of total land area), Sri Lanka, Roughly 31% of Sri Lanka's land is protected (World Bank, 2025), including the Sinharaja rainforest World Heri check
Terrestrial protected areas (% of total land area), Sri Lanka corroboration check
Terrestrial protected areas (% of total land area), Sri Lanka corroboration check
Eretmochelys imbricata (Hawksbill Turtle), Critically Endangered on the IUCN Red List, and recorded in Sri Lanka in GBIF occurrence data (turtle). check
Pseudophilautus stuarti (Stuart's Shrub Frog), Critically Endangered on the IUCN Red List, and recorded in Sri Lanka in GBIF occurrence data (amphibian). check
Aneuretus simoni (Sri Lankan Relict Ant), Critically Endangered on the IUCN Red List, and recorded in Sri Lanka in GBIF occurrence data (insect). check
government expenditure on education as a percentage of GDP, Sri Lanka, Public spending on education runs at 1.8% of GDP and 7.2% of all government spending, and secondary enrolment check
government expenditure on education as a percentage of GDP, Sri Lanka corroboration check
government expenditure on education as a percentage of GDP, Sri Lanka corroboration check
government expenditure on education as a percentage of GDP, Sri Lanka corroboration check
BirdLife International, IUCN and UNEP-WCMC3 FIGURES
UN SDG Global Database, terrestrial Key Biodiversity Areas covered by protected areas (%) ER_PTD_TERR, Sri Lanka, 2025 (45.2%), country-reported check
UN SDG Global Database, marine Key Biodiversity Areas covered by protected areas (%) ER_MRN_MPA, Sri Lanka, 2025 (58.0%), country-reported check
UN SDG Global Database, freshwater Key Biodiversity Areas covered by protected areas (%) ER_PTD_FRHWTR, Sri Lanka, 2025 (43.9%), country-reported check
Central Environmental Authority of Sri Lanka3 FIGURES
Regulations on Polythene and Plastic Management 2017, Partial: polystyrene and several single-use plastic items banned since 2017. check
Regulations on Polythene and Plastic Management 2017 corroboration check
Regulations on Polythene and Plastic Management 2017 corroboration check
FAO FAOSTAT3 FIGURES
Production: Crops and livestock products (QCL), Sri Lanka, 2024, By tonnage, the largest crops grown in Sri Lanka are rice, coconuts, tea leaves, plantains and cooking bananas check
Production: Crops and livestock products (QCL), Sri Lanka, 2024 corroboration check
Production: Crops and livestock products (QCL), Sri Lanka, 2024 corroboration check
PLOS ONE3 FIGURES
Barcode high-resolution melting analysis to authenticate true cinnamon (Cinnamomum verum), 2025, True Ceylon cinnamon (Cinnamomum verum), of which Sri Lanka grows the large majority of the world's supply. check
Sri Lanka exports 2023, HS chapter 61 against total, The largest single export, knitted clothing, is 22.6% of the total (2023, UN Comtrade). check
Sri Lanka exports 2023, HS chapter 61 against total corroboration check
Sri Lanka exports 2023, HS chapter 61 against total corroboration check
Wilderness and Wildlife Conservation Trust (Sri Lanka)3 FIGURES
The Sri Lankan Leopard in Yala National Park: a research summary (Kittle and Watson), Yala holds one of the world's highest leopard densities and Minneriya sees the largest seasonal gathering of w check
The Sri Lankan Leopard in Yala National Park: a research summary (Kittle and Watson) corroboration check
The Sri Lankan Leopard in Yala National Park: a research summary (Kittle and Watson) corroboration check
Convention on Biological Diversity2 FIGURES
Kunming-Montreal Global Biodiversity Framework, Target 3, The 30x30 target is 30% by 2030, so 29.7 percentage points are still to be designated. check
Kunming-Montreal Global Biodiversity Framework, Target 3 corroboration check
FAO, Global Forest Resources Assessment2 FIGURES
UN SDG Global Database, forest area (% of land area) AG_LND_FRST, Sri Lanka, 2025 (34.3%), country-reported check
UN SDG Global Database, forest area inside legally established protected areas (%) AG_LND_FRSTPRCT, Sri Lanka, 2025 (69.5%), country-reported check
IUCN Red List Categories and Criteria2 FIGURES
Version 3.1, second edition (IUCN Species Survival Commission, 2012), Critically Endangered, the last IUCN category before Extinct in the Wild, and still recorded in Sri Lanka. check
Version 3.1, second edition (IUCN Species Survival Commission, 2012) corroboration check

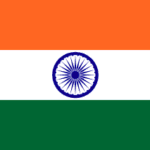 IndiaScored on the same twelve pillars as Sri Lanka.72
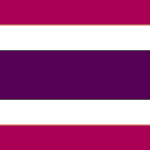 ThailandScored on the same twelve pillars as Sri Lanka.67
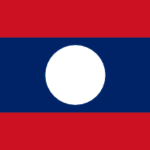 LaosScored on the same twelve pillars as Sri Lanka.67
 MongoliaScored on the same twelve pillars as Sri Lanka.58
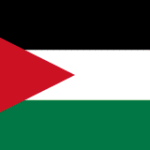 JordanScored on the same twelve pillars as Sri Lanka.50
 MaldivesScored on the same twelve pillars as Sri Lanka.42