Destinations › Europe · The Destination Index · recorded destination information · verify source dates and scope

Croatia.

Southeastern Europe, bordering the Adriatic Sea, between Bosnia and Herzegovina and Slovenia. 56,594 sq km and 3,876,200 people, 5,835 km of coastline, Mediterranean and continental; continental climate predominant with hot summers and cold winters; mild winters, dry summers along coast.
Region · Europe Population · ~3,876,200 Languages · Croatian, with Serbian, Italian and Hungarian minorities Eco Index · 67/100 · Passable · ranked 31 of 77
60,021,000 visitors a year · 3,876,200 residents
Header photo · DeLuca G

Every figure below carries its named source and year. The Eco Index scores twelve pillars on the same scale everywhere; seven are measured from published data with fixed thresholds, five are assessed from the named sources.

Croatia at a Glance.

The score, and the four numbers that set the tone. 12 equally-weighted pillars, every pillar sourced.
Compare with:
Eco IndexPassable
67/100
12 pillars, all sourced, scored below All 77 ranked
Renewable power
76%
of electricity
Food imported
14%
of merchandise imports · ~US$7,248m a year
The Eco Index across 12 pillars · scored 0 to 5 · World Bank, OWID, WHO/UNICEF JMP, FiBL, Protected Planet, IUCN, UNESCO (2023-24)
Water
Food & farming
Plant-based
Organic
Conservation
Wildlife
Materials
Pollution
Recycling
Energy
Culture
Heritage

Facts That Surprise People About Croatia.

The numbers and firsts that change how you see Croatia, the sobering and the remarkable. Every one is dated and linked to its source.
SoberingHealth
Most overweight men in the EU
In 2022, 69.4% of men in Croatia were overweight, the joint highest share in the EU with Malta and Slovakia. One in five Croatian men (20.8%) was obese.
SoberingHealth
Heavy smoking is the norm
Croatia is the only EU country where heavy smokers, on 20 or more cigarettes a day, made up the majority of daily smokers in 2019. Its share of women who smoke heavily, 8.1%, was the highest in the EU.
SoberingHealth
Second hand smoke is common
In 2019, 34.7% of people in Croatia were exposed to tobacco smoke indoors every day, the highest share among EU countries.
SoberingHealth
Air pollution deaths
The European Environment Agency attributes 2,886 deaths in Croatia in 2023 to fine particulate pollution (PM2.5).
RemarkableCulture
23 entries on UNESCO's heritage lists
Croatia has 23 elements on UNESCO's intangible cultural heritage lists, from lacemaking and gingerbread craft to Ojkanje singing, which is listed as in need of urgent safeguarding.
RemarkableFood
Part of the Mediterranean diet listing
Croatia shares the Mediterranean diet's UNESCO intangible heritage status, inscribed in 2013, with Cyprus, Greece, Italy, Morocco, Portugal and Spain.
RemarkableCulture
Klapa, Dalmatia's harmony singing
Klapa, an unaccompanied multipart singing tradition from Dalmatia, was added to UNESCO's intangible heritage list in 2012. Groups of amateur singers often sing without written music.
RemarkableCulture
A knights' tournament since the 1700s
Each year in Sinj, riders gallop along the main street aiming lances at an iron ring, the alka, as they have since the 18th century. UNESCO listed it in 2010.

The History of Croatia.

Croatia has 23 elements on UNESCO's intangible heritage lists. Klapa, the a cappella harmony singing of Dalmatia, and tamburica string music are still performed, alongside the kolo circle dance and the Ojkanje and ganga singing styles.
Where the name comes from
Hrvatska in Croatian, from the early medieval Hrvati, whose own origin is debated among Slavic and Iranian derivations. Source: UK Permanent Committee on Geographical Names toponymic factfile.
The land itself: flat plains along the Hungarian border, low mountains and highlands toward the Adriatic and its islands. Its high point is Dinara, 1,831 m. Source: UK Permanent Committee on Geographical Names toponymic factfile.
Where it starts
Krapina, and ceramic art
Around 900 Neanderthal bones and more than a thousand stone tools were excavated at Krapina from 1899, the largest collection of Neanderthal remains gathered at a single site. On the island of Korčula, Vela Spila produced fired ceramic figures around 17,500 to 15,000 years old, the first evidence of ceramic figurative art in late Upper Palaeolithic Europe. Early Neolithic communities making Impressed Ware pottery lived in Northern Dalmatia from about 6000 BC, and the Vučedol culture near Vukovar cast copper in the late fourth and third millennia BC.
How it got here
Illyrians to independence
Illyrian peoples held the coast and interior, Greeks founded Issa on Vis, and Rome conquered the region between 156 BC and AD 9, ruling it as the province of Dalmatia. Tomislav was addressed as king of the Croats in 925. From 1102 Croatia was joined to Hungary, and in 1527 it chose a Habsburg king. It was part of successive Yugoslav states from 1918. Independence was declared in 1991 and followed by four years of war.
The timeline
c. 125,000 years ago
Krapina.
Around 900 Neanderthal bones and more than a thousand stone tools, the largest collection of Neanderthal remains found in one place. Source
c. 17,500 to 15,000 years ago
Vela Spila.
Fired ceramic figures from a cave on Korcula are the first evidence of ceramic figurative art in late Upper Palaeolithic Europe. Source
c. 6000 to 5400 BC
The Neolithic arrives.
Early Neolithic communities making Impressed Ware pottery live in Northern Dalmatia, the most fertile region of the eastern Adriatic. Source
Late 4th and 3rd millennium BC
Vucedol.
The Vučedol culture, whose most intense life at Vučedol near Vukovar falls in the late 4th and 3rd millennia BC, casts copper and leaves behind the famous Vučedol dove, found during excavations in 1938. Source
c. 400 BC to AD 9
Illyrians, Greeks and Rome.
Greeks found Issa on Vis in the 4th century BC, and Rome conquers the Illyrian lands between 156 BC and AD 9, ruling them as the province of Dalmatia. Source
925
A Croatian kingdom.
Papal letters sent for the church council at Split in 925 address Tomislav as king of the Croats, the first Croatian ruler known to use that title. Source
1102 to 1918
Unions and empires.
Croatia is joined to Hungary in 1102, chooses a Habsburg king in 1527 to defend it against the Ottomans, and its parliament ends the tie with Austria-Hungary in 1918. Source
1918 to 1991
Yugoslavia.
Croatia joins the new South Slav state in 1918, later the Kingdom of Yugoslavia, and after 1945 is a republic of socialist Yugoslavia. Leaving in 1991 led to a war that ran until 1995. Source
1991 to 1995
Independence and war.
Independence is declared in 1991 and followed by four years of war. Source
Croatian Natural History Museum, Zagreb, Geological-Palaeontological Department (Krapina collection) · Krapina Neanderthal Museum, the Krapina site · Vucedol Culture Museum, Vukovar · PLOS ONE, First Epigravettian ceramic figurines from Europe (Vela Spila, Croatia) · Documenta Praehistorica, Impressed Ware blade production of Northern Dalmatia · Ministry of Culture and Media, the Vucedol Culture Museum and archaeological site · Archaeological Museum in Split, Roman provincial collection · Archaeological Museum in Split, Issa collection and site · Croatian Encyclopedia (Miroslav Krleza Institute of Lexicography), Tomislav · Croatian Parliament, decisions of the Sabor in the history of the Croatian people · Croatian Homeland War Memorial and Documentation Centre, chronology of the Homeland War · CIA World Factbook, Croatia background, archived data

Nature and Biodiversity in Croatia.

On paper Croatia protects a lot of land, about 38.5% (World Bank, 2025), but most of that is the EU Natura 2000 network, which is a multi-use conservation designation rather than strict reserve, so the headline overstates on-the-ground protection. The strictly protected core, eight national parks including Plitvice Lakes and Krka and twelve nature parks, is well managed and much smaller. Marine protection is comparatively modest at about 9.3% of territorial waters, and coastal development and tourism add pressure.
Is wild Croatia protected? 38.4% of the land is, already past the 30% target for 2030
Found only here. The olm (Proteus anguinus), a blind cave salamander of the Dinaric karst, plus endemic karst fish such as species of Telestes and numerous cave-dwelling invertebrates.
The watchlist
ThreatenedCommon Hamster (Cricetus cricetus) Critically Endangered on the IUCN Red List, and recorded in Croatia in GBIF occurrence data (mammal).
ThreatenedCommon eagle ray (Myliobatis aquila) Critically Endangered on the IUCN Red List, and recorded in Croatia in GBIF occurrence data (shark or ray).
ThreatenedCroatian Toothed Grasshopper (Stenobothrus croaticus) Critically Endangered on the IUCN Red List, and recorded in Croatia in GBIF occurrence data (insect).
ThreatenedPen Shell (Pinna nobilis) Critically Endangered on the IUCN Red List, and recorded in Croatia in GBIF occurrence data (species).
ThreatenedAnguilla anguilla Critically Endangered on the IUCN Red List, and recorded in Croatia in GBIF occurrence data (species).
ThreatenedMicrocondylaea bonellii Critically Endangered on the IUCN Red List, and recorded in Croatia in GBIF occurrence data (species).
ThreatenedBull ray (Aetomylaeus bovinus) Critically Endangered on the IUCN Red List, and recorded in Croatia in GBIF occurrence data (shark or ray).
What is still here, and what is gone?
Tap a species for the honest status.
Closest to being lost, by name
Common Hamster (Cricetus cricetus)
Critically Endangered, the last IUCN category before Extinct in the Wild, and still recorded in Croatia. GBIF holds 8 verified occurrence records.
Common eagle ray (Myliobatis aquila)
Critically Endangered, the last IUCN category before Extinct in the Wild, and still recorded in Croatia. GBIF holds 58 verified occurrence records.
Croatian Toothed Grasshopper (Stenobothrus croaticus)
Critically Endangered, the last IUCN category before Extinct in the Wild, and still recorded in Croatia. GBIF holds 6 verified occurrence records.
Species named here are drawn from GBIF occurrence records for Croatia filtered to the IUCN Red List threatened categories. Species are listed where GBIF holds occurrence records for them in this country. Record counts are not published here because the figure cannot be reproduced from a public GBIF query.
Who is putting it back
Gastro Glamping Resort Fešta eco stay
National park in Lika-Senj County, mapped and named in the open record for Croatia. OpenStreetMap.
Heritage Boutique Hotel Adriatic eco stay
National park in Zadar County, mapped and named in the open record for Croatia. OpenStreetMap.
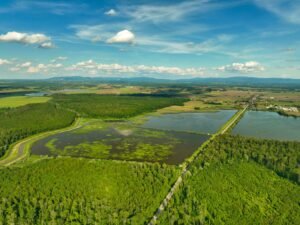
Aerial shot of lush green wetlands and forests under a clear blue sky in Garešnica, Croatia.
National park in Šibenik-Knin County, mapped and named in the open record for Croatia. OpenStreetMap.
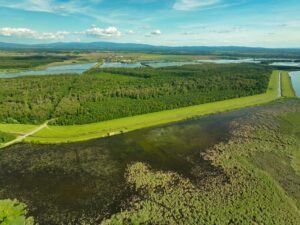
Aerial view showcasing vibrant landscapes and waterways in Garešnica, Croatia, under a clear blue sky.
National park in Šibenik-Knin County, mapped and named in the open record for Croatia. OpenStreetMap.
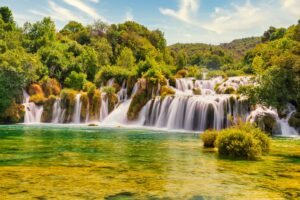
Explore the stunning cascades and lush greenery of Krka National Park's waterfalls in Croatia.
National park in Lika-Senj County, mapped and named in the open record for Croatia. OpenStreetMap.
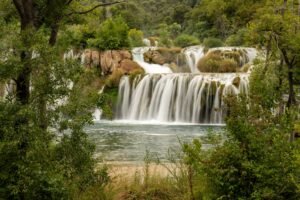
Stunning natural cascades in Krka National Park, showcasing lush greenery and tranquil waters.
National park in Primorje-Gorski Kotar County, mapped and named in the open record for Croatia. OpenStreetMap.

Water and Ocean in Croatia.

Croatia is comfortably water-rich, drained by major rivers such as the Sava, Drava and Danube in the interior and threaded with clean karst rivers and springs in the Dinaric interior, home to the terraced lakes of Plitvice and the waterfalls of Krka. Tap water is potable across the country. The WHO/UNICEF JMP safely managed figure stands at about 87.1% (World Bank, 2022), and the Adriatic islands can face summer water stress that is met by mainland pipelines and tankering.
Does Croatia have enough fresh water? Yes, with headroom
87.3% of people here have safely managed drinking water at home (2024, WHO/UNICEF JMP). Most homes have a safe supply, but coverage is not universal, so check locally before drinking from the tap.
Cleanest water: The karst rivers of Plitvice and Krka and the clear outer-island Adriatic waters, among the cleaner seas of the Mediterranean.
How much fresh water does Croatia have, per person?
9,778 m³
Croatia
1,000 m³
the UN “water scarce” line
Croatia withdraws about 679 million cubic metres of fresh water a year (2022). That is 1.5% of the fresh water actually available to it, which FAO counts as no water stress. Of what is taken, farming takes 7%, homes and towns 46%, industry 47%. Source: FAO AQUASTAT.
What are the rules on Croatia beaches?
·Tap water: Varies.
✓Plastic rules: Yes. As an EU member Croatia applies the Single-Use Plastics Directive, banning plastic straws, cutlery, plates, cotton buds and expanded-polystyrene food containers since 2021, plus plastic-bag charges..
✓Solo travel: rated easy on the record for this destination.
✕Marine protection: 9% of the sea is protected. The 30x30 pledge for 2030 is not met yet.
Named on the open map: Bribirska beach, Cava Beach, Emily Beach, Gradska Plaža, Klanac beach, Lanterna beach. They are a handful of the many named beaches in the public record for Croatia, each one a place you can look up before you go. OpenStreetMap.
Where does the sewage go?
74.7%
of people have safely managed sanitation
74.7% of people here use a safely managed sanitation service, meaning waste is contained, emptied and treated rather than reaching the ground or the sea untreated (2021, World Bank / WHO-UNICEF JMP, SDG 6.2.1). The rest is what the rivers and the coast receive.
How is the sea around Croatia doing?
One cross-section, every answer measured.
Surface
What the coast carries
Mediterranean summers with afternoon bora wind on the coast; the mountains can be cold.
Nearshore
Protected water
9.3% of territorial waters are protected, against the 30% pledged for 2030 under the Global Biodiversity Framework.
Cleanest
Where the water is cleanest
The karst rivers of Plitvice and Krka and the clear outer-island Adriatic waters, among the cleaner seas of the Mediterranean..
The record
Measured
Croatia is comfortably water-rich, drained by major rivers such as the Sava, Drava and Danube in the interior and threaded with clean karst rivers and springs in the Dinaric interior, home to the terraced lakes of Plitvice and the waterfalls of Krka. Tap water is potable across the country.
Croatia scored 69 out of 100 on the Ocean Health Index in its 2025 assessment, below the global average of 72, and ranked 142nd of 220 coastal regions. The index team says it is no longer updating scores, so the 2025 figures may be the last.
Sea protected
9.3%
Against the 30% pledged for 2030 under the Global Biodiversity Framework.
Threatened species
117
Mammals, birds, fish and higher plants on the IUCN list.
Is the tap water safe in Croatia?
87.3% of people have safely managed drinking water at home (2024, WHO/UNICEF JMP). Renewable fresh water works out at about 9,778 cubic metres per person a year (World Bank).
How hard is the water supply being pushed?
Of every 10 buckets nature refills, 0 are already taken. Withdrawals run at 1.5% of what Croatia renews internally each year (2022, World Bank / FAO AQUASTAT). That is inside the 25% mark generally treated as water stress, so the supply has headroom.
When is the best time to visit Croatia? Tap your month.
Tap your month.
How much fresh water does Croatia actually have?
Nature renews about 9,778 cubic metres of fresh water per person per year here. That ranks Croatia 159 of 208 countries measured, putting it in the wetter half of the world. The UN treats anything under 1,000 cubic metres as water scarce, and this is above that line. World Bank / FAO AQUASTAT.

Food and Drink in Croatia.

Croatian farming rests on small family holdings, more than 134,000 farms in all. About 68% of the farmed land is arable and 26% is mostly permanent grassland and meadows.
Where does the food in Croatia come from?
14.3% imported
about US$7,248m a year
On the plate: Bread and cereals, maize (polenta), potatoes, Swiss chard (blitva) and other vegetables, olive oil, Istrian truffles, wine.
1 of 10
bites are imported
The island buys in more food energy than it eats. About US$7,248m a year leaves the country to pay for it. The green slice is roughly what still grows here.
About 14.3% of everything Croatia buys in from abroad is food, roughly 1 in every 10 imported items on the dock (2024, World Bank). Farming itself is 2.8% of the economy and 26.6% of the land is agricultural, of which 15.5% is arable. The green slice is roughly what still grows here.
What is killing people in Croatia? The imported diet.
Cause of death, and the diet behind it.
Non-communicable diseases, all combined80.5%
Diabetes10.5%
Adults living with overweight or obesity. 64.2%.
Can Croatia feed itself?
15.2%
Arable land
26.6%
Agricultural land
75,485
Farmers
2,144,871
Arable acres
2.8%
Agriculture, share of GDP
Harvest: Grape and olive harvest runs September to October, truffle season is mainly autumn, and Mediterranean vegetables and fruit peak through summer.
Feeding itself
Croatia has solid domestic farming, from wheat, maize and sugar beet on the Pannonian plain to olive oil, wine, vegetables and Adriatic fish and shellfish along the coast, plus prized Istrian truffles and Pag cheese. It is, however, a net food importer and does not fully cover its own consumption.
Certification
Organic farming has grown strongly and now covers around 9% of Croatia's utilised agricultural area (Eurostat), close to the EU average and well ahead of most of the Americas. The sector spans olive oil, wine, honey and field crops, supported by EU rural-development funding.
Water for crops
Croatia is comfortably water-rich, drained by major rivers such as the Sava, Drava and Danube in the interior and threaded with clean karst rivers and springs in the Dinaric interior, home to the terraced lakes of Plitvice and the waterfalls of Krka. Tap water is potable across the country.
Why the organic number looks like that. Certification covers only part of what is grown cleanly, so a small certified share is a gap in the paperwork rather than proof that nothing is. What the official land record does show: 26.6% of the country is agricultural land and 15.5% is arable (2023, World Bank). Certification is paid for per farm per year by a foreign body, which prices out smallholders, so the organic number reads worse than the practice.
What actually grows here
MaizeWheatSugar beetsBarleySoybeansSunflower seedsPotatoesGrapes
The food that already fits
The plant-based kitchen here is not an import. By tonnage, the largest crops grown in Croatia are maize, green corn, wheat, sugar beet and barley (FAO, FAOSTAT crop production, 2024). That is what the land itself puts on a plate.
Buy direct where residents buy: Dolac Market in Zagreb, just north of Ban Jelačić Square, is the city's biggest farmers' market, with fruit, vegetables, cheesemongers, bakeries and fresh pasta stands. It opens Monday to Saturday 7:00 to 15:00 and Sunday 7:00 to 13:00, and the tourist board advises going before 13:00. The board says every Zagreb neighbourhood has its own farmers' market. We have not checked these ourselves.
Not yet checked by us. Plant based kitchens listed publicly: Vegehop, vegan restaurant in Zagreb: daily menus, salads, raw and gluten free dishes, fully vegan since 2020; Zrno Bio Bistro, vegan bistro in Zagreb: organic macrobiotic meals, many from its own farm; BioMania Bistro, vegan bistro in Zagreb: breakfast, lunch and dinner including Croatian dishes; Oaza Joyful Kitchen, vegan kitchen in Zagreb: falafel, wraps and vegan cakes; Kuća tete Ane, vegetarian lunch spot in Zagreb: a daily vegetable stew and one other dish, usually vegan, on weekdays. Tell us how they are.
Is this grown in Croatia?
Tap a food for the honest answer.
BreadCerealsPotatoesOther vegetablesOlive oil

Climate and Energy in Croatia.

Croatia draws about 54% of its electricity from low-carbon sources, with hydropower near 28%, wind around 15% and solar close to 6%, while fossil fuels supply roughly 17% and imports cover more than a quarter of demand (Low Carbon Power, 2025). Emissions sit in the mid-range at about 4.76 tonnes of CO2 per person in 2024 (Our World in Data). As an EU member state, Croatia is bound by the European Climate Law, its 2050 climate-neutrality target and the Fit for 55 package (European Commission). Progress is steady but the grid still leans on fossil generation and imported power.
What powers Croatia?
Renewable 76.3%Fossil 23.8%
Croatia's high voltage network is owned and run by HOPS, the country's sole transmission system operator, licensed to transmit electricity as a regulated public service. HOPS sits inside the HEP group, whose parent company is Hrvatska elektroprivreda (HEP d.d.), but it has been unbundled from the group under the independent transmission operator model and works independently of its parent. Distribution is run by another HEP subsidiary, HEP Operator distribucijskog sustava (HEP ODS), and the group keeps its regulated transmission and distribution businesses separate from generation and supply. Energy activities are regulated by the Croatian Energy Regulatory Agency (HERA).
Climate pollution per person
The safe amount, what the planet can absorb
2 tonnes
One person here
4.83 tonnes
The world average, for comparison
4.7 tonnes
The worst it ever got
7.03 tonnes
The grid
Croatia draws about 54% of its electricity from low-carbon sources, with hydropower near 28%, wind around 15% and solar close to 6%, while fossil fuels supply roughly 17% and imports cover more than a quarter of demand (Low Carbon Power, 2025). Emissions sit in the mid-range at about 4.83 tonnes of CO2 per person in 2024 (Our World in Data).
Pollution
As an EU member Croatia applies the EU Single-Use Plastics Directive, banning items such as plastic straws, cutlery, plates, cotton buds and expanded-polystyrene food containers since 2021, alongside charges on plastic bags. Air quality is moderate, with a national mean PM2.5 of about 15.8 micrograms per cubic metre in 2023 (World Bank), improving over the past decade though still above the WHO guideline, with winter wood and solid-fuel heating a factor inland.
Water stress
Croatia is comfortably water-rich, drained by major rivers such as the Sava, Drava and Danube in the interior and threaded with clean karst rivers and springs in the Dinaric interior, home to the terraced lakes of Plitvice and the waterfalls of Krka. Tap water is potable across the country.
What pollutes most here
1The grid The share of electricity still generated from fossil fuel.30.1%
2Industry Coastal overdevelopment and mass cruise tourism that strain water, waste and heritage sites, plus concreting of the shoreline for resorts and marinas..named
3Air Modelled annual mean against a WHO guideline of 5 µg/m³.15.8
4On the record As an EU member Croatia applies the EU Single-Use Plastics Directive, banning items such as plastic straws, cutlery, plates, cotton buds and expanded-polystyrene food containers since 2021, alongside charges on plastic bags.
What has Croatia promised on climate?
Net zero, whole economy2050
Electricity renewable today69.9% (2021)
Land protected, against a 30% target38.4% by 2025
Sea protected, against a 30% target9.3% by 2025
The net-zero target year on file with Climate Watch is 2050, status: in policy document. Measured against it, 69.9% of electricity is already renewable (2021, World Bank), so 30.1% of the grid is still to be converted. The pledge on file is measured here against what has actually been delivered, not taken on its own (UNFCCC NDC Registry, CBD Kunming-Montreal Target 3).
The biggest line item
One return flight against a whole year of living.
A resident's entire year4.83 t CO2e
Safe-climate budget, per year2 t CO2e
Sydney return, economy2.89 t CO2e
Los Angeles return, economy1.81 t CO2e
Singapore return, economy1.76 t CO2e
Johannesburg return, economy1.46 t CO2e
New York return, economy1.24 t CO2e
How much CO2 does flying to Croatia emit?
Tap where you would fly from. One return flight, economy.
Firsts on climate finance. Croatia's largest source of climate money is its EU recovery and resilience plan, approved by the Council on 28 July 2021 and revised on 8 December 2023 to add a REPowerEU chapter. The plan is worth about 10 billion euros including national funds, made up of 5.8 billion euros in grants and 4.2 billion euros in loans, and 39 per cent of it supports climate objectives. The REPowerEU chapter is worth 2.9 billion euros, including a 269 million euro REPowerEU grant. On 17 March 2026 the Commission authorised the eighth grant instalment and fourth loan instalment.

AI and Data Centres in Croatia.

Every prompt runs on a machine in a building on somebody’s grid. What that costs the planet depends less on the prompt than on what is burning to power it. Here is what would power one in Croatia.
Data centres
12
Registered colocation and interconnection facilities, PeeringDB, 2026
Grid renewable
76.3 %
What a machine here runs on.
What powers a data centre in Croatia?
A machine here runs mostly on renewables, but not entirely.
Renewable 76.3%Fossil 23.7%
Cooling water. Every one of those halls runs on the national grid, which is 69.9% renewable today (World Bank). A data centre is only as clean as the electricity behind it, so the same figure that decides this country's climate score also decides the footprint of the AI running inside it. Cooling water use is not separately published by facility, and no operator here reports it.
The rules. Croatia has 12 colocation and interconnection facilities on the public PeeringDB register, concentrated in Zagreb (6), Sisak (1), Dubovac (1), alongside 2 internet exchanges (CIX, ADRIA-IX). Named sites include A1 Hrvatska Zagreb, SRCE Zagreb, Digital Realty Zagreb (ZAG1), Vipnet d.o.o. Hrvatska.
Where the cables land. 2 landing points · Dubrovnik, Umag

Economy and Tourism in Croatia.

6% residents to 94% visitors across a year. 60,021,000 international arrivals in 2019 against 3,876,200 people who live here (2025, World Bank / UN Tourism).
Where a visitor dollar goes in Croatia
21,608k
Visitors a year
5.6
Visitors per resident
How deep in debt is Croatia?· for every $100 Croatia earns in a year, it owes…
Pay to the order of: the creditorsmemo · the 2020 peak
$ 86The worst year on the IMF record. Croatia owed $86 for every $100 it earned.
IMF World Economic Outlook, 2020signed, the creditors
Pay to the order of: the creditorsmemo · today
$ 56What is owed now, for every $100 of national income (2026).
IMF World Economic Outlook, 2026signed, the creditors
Pay to the order of: the creditorsmemo · projected 2031
$ 59The IMF's own forecast has this rising to $59 by 2031.
IMF World Economic Outlook projection, 2031signed, the forecast
For every $100 Croatia earns in a year, it owes $56 (2026, IMF World Economic Outlook). The interest on that is paid before schools, clinics or coastline get their turn.
$Where does a tourist dollar actually go in Croatia?
Play one tourist dollar around the board. Every square is a measured fact from this page.
START!
1
GO: a visitor lands
$100 goes on the table. 60,021,000 international arrivals in 2019 against 3,876,200 residents, 15.5 visitors for every resident (World Bank / UN Tourism).
$100 in play
2
The bed
Who owns the largest places to stay in Croatia is not published in the records we can check, so this square is left open rather than guessed. Where a listing names its owner, it is shown in the ownership table below.
not published
3
The plate
Food is only 14.3% of everything Croatia imports (2024, World Bank), so most of a meal is bought from producers inside the country. Eating what the land here actually grows, maize, wheat, sugar beets, barley, soybeans, sunflower seeds, potatoes, grapes, keeps that money with the grower.
mostly home-grown
4
The power
69.9% of the electricity is renewable (2021, World Bank), so the energy on the bill is mostly generated inside the country rather than shipped in.
made at home
5
What actually stays
Of the two parts of a visitor's bill that can be measured here, the plate and the power stay inside Croatia. This is not an economy where a visitor's money drains away, and the board is shorter for it.
most of it
6
Pay the bank first
Croatia owes $56 for every $100 it earns (IMF World Economic Outlook, 2026 projection). The interest is paid before anything else on this board.
$56 per $100
7
A spread hand
The largest single export, mineral fuels and oils, is 12.0% of the total (2023, UN Comtrade). No one shock can take the whole board.
top export 12.0%
8
Community chest
Tourism earns 23.4% of everything Croatia makes from exports (2020, World Bank / UN Tourism). That is how much of the economy depends on the game continuing.
23.4% of exports
9
The flight
Getting here is usually the biggest single line on the bill. From Sydney a return economy seat is 2.89 t CO2, on the UK Government's published conversion factors. It is the one part of the trip this board cannot reduce.
2.89 t CO2
10
Back to GO
The economy turns over about US$117 billion a year (IMF World Economic Outlook, 2026 projection). Every lap of this board is a choice about how much of it stays.
US$117bn
GDPUS$105.1bn
Agriculture, share of GDP2.8%
Visitors a year21,608,000
Visitors per resident5.6
Residents~3,876,200
Agriculture
Farming is 2.8% of the economy. Croatia has solid domestic farming, from wheat, maize and sugar beet on the Pannonian plain to olive oil, wine, vegetables and Adriatic fish and shellfish along the coast, plus prized Istrian truffles and Pag cheese.
Natural materials
Croatia keeps living natural-materials traditions, above all its lacemaking, with the needlepoint lace of Pag and the bobbin lace of Lepoglava inscribed on the UNESCO intangible cultural heritage list and still hand-made. Traditional wool and linen folk textiles and Pag island sheep-wool crafts persist, and the necktie itself derives from the 17th-century Croatian cravat.
Energy
Croatia draws about 54% of its electricity from low-carbon sources, with hydropower near 28%, wind around 15% and solar close to 6%, while fossil fuels supply roughly 17% and imports cover more than a quarter of demand (Low Carbon Power, 2025). Emissions sit in the mid-range at about 4.83 tonnes of CO2 per person in 2024 (Our World in Data).
Who owns the biggest hotels in Croatia?
By rooms · company records and press.
Gastro Glamping Resort Fešta · ~5 roomsIndependentnot published
Heritage Boutique Hotel Adriatic · ~19 roomsIndependentnot published
Hotel Sveti Križ · ~40 roomsIndependentnot published
Estate under the Paintbrush · ~2 roomsIndependentnot published
Rose Hip Hill Holiday House · ~2 roomsIndependentnot published
Villa Dol · ~4 roomsIndependentnot published
Abeille Maison Glamping Resort Brač · ~8 roomsIndependentnot published
Visitors, over time
201555,858k
201657,587k
201759,238k
201857,668k
201960,021k
202021,608k
International tourism receipts run at about US$5.63 billion in 2020 (World Bank / UN Tourism). That is 23.4% of everything the country earns from exports.
How much of your money actually stays here?
Tap the holiday you are planning.

Visiting Croatia, whoever you are.

Resort guest, villa renter, family, nomad or backpacker. The honest playbook for each, from the same sourced numbers.
Already booked a resort? · the rescue list
Five swaps that move your money back on-island
1. Eat where the country eats Choose kitchens cooking what the land here grows, maize, wheat, sugar beets, barley, soybeans, sunflower seeds, potatoes and grapes, over an imported menu. The checked list
2. Book with a local operator Never the lobby desk. The margin on a tour is the part that stays.
3. Stay somewhere locally owned Ownership decides where the room rate books. Eco stays
4. Use the transport residents use A car suits Istria and the interior; the Jadrolinija ferry network links the islands, coastal buses are frequent and reliable, and the rail network is limited. The bora wind can occasionally disrupt ferries and bridges.
5. Buy the craft, not the souvenir Natural-materials work made here pays the maker directly; imported gifts pay a shipping line.
Swipe
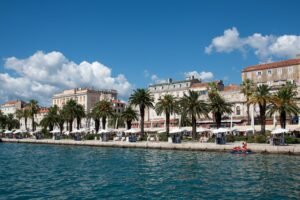
Captivating view of Split's waterfront promenade with palm trees and historic buildings.
First time here
A forested, water-rich Adriatic country where about 38% of the land carries protected status and organic farming and recycling are climbing, though mass coastal tourism and modest marine protection weigh against it.
Best time: Late spring and early autumn.
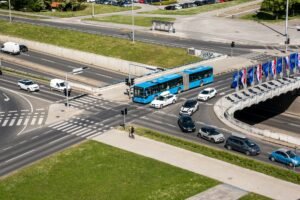
Aerial shot of a bustling traffic intersection with cars and a bus in Zagreb, Croatia.
Getting around
A car suits Istria and the interior; the Jadrolinija ferry network links the islands, coastal buses are frequent and reliable, and the rail network is limited. The bora wind can occasionally disrupt ferries and bridges.
Transport is where the fare either stays or leaves.
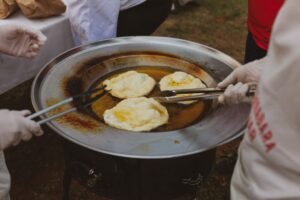
People cooking traditional fried dough outdoors in Croatia.
Eating here
The everyday plate that actually grows here is maize, wheat, sugar beets, barley, soybeans, sunflower seeds, potatoes and grapes. Ordering those keeps the money with the grower and cuts the imported share of the meal.
Eating what the country grows is the cheapest way to cut the import bill.
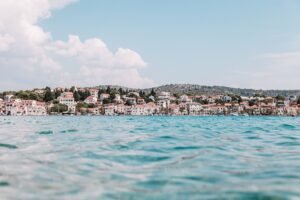
Stunning panoramic view of a coastal town in Croatia, showcasing vibrant rooftops against a calm sea.
Good to know
EUR since 2023; cards everywhere on the coast.
Rate my hotel. Tap yours for the honest verdict.
Ownership from company records and press.
Who owns the big hotels
Gastro Glamping Resort FeštaIndependent · 5 rooms
Heritage Boutique Hotel AdriaticIndependent · 19 rooms
Hotel Sveti KrižIndependent · 40 rooms
Estate under the PaintbrushIndependent · 2 rooms
Rose Hip Hill Holiday HouseIndependent · 2 rooms
Villa DolIndependent · 4 rooms
None of the 7 properties listed here publishes who ultimately owns it, so no claim is made either way. Ownership is what decides how much of a room rate stays in the country, which is why we show it when a listing states it.

Society and Governance in Croatia.

How well is Croatia actually run?
Governance, measured · World Bank WGI
Four measured answers, none of them opinion. Averaged across corruption control, delivery and accountability, Croatia scores 61 out of 100 (2024, World Bank Worldwide Governance Indicators). That is a state that generally does what it says it will do, which is what makes a climate pledge worth reading.
What is daily life in Croatia really like? Measured
Getting around, breathing, throwing away, learning. The honest checklist.
TransportAirWaterWastePower
✓How you get around A car suits Istria and the interior; the Jadrolinija ferry network links the islands, coastal buses are frequent and reliable, and the rail network is limited. The bora wind can occasionally disrupt ferries and bridges.
98.2%
literacy. Public spending on education runs at 4.1% of GDP and 8.5% of all government spending, and secondary enrolment stands at 105.0% gross (UNESCO Institute for Statistics, 2021 to 2023).

Made in Croatia.

Croatia keeps living natural-materials traditions, above all its lacemaking, with the needlepoint lace of Pag and the bobbin lace of Lepoglava inscribed on the UNESCO intangible cultural heritage list and still hand-made. Traditional wool and linen folk textiles and Pag island sheep-wool crafts persist, and the necktie itself derives from the 17th-century Croatian cravat. Every step of processing done at home is value that stops leaving the country.
What Croatia actually sells the world
The single biggest thing Croatia sells the world is mineral fuels and oils, 12.0% of all exports in 2023 (about US$2.96 billion, UN Comtrade). The next four are electrical machinery and electronics at 9.6%, machinery and mechanical appliances at 8.1%, wood and wood articles at 4.9%, pharmaceuticals at 4.7%.
Made now · natural materials
Above all its lacemaking
Worked in Croatia from local material, and still a working craft rather than a museum piece.
Made now · natural materials
Bobbin lace of Lepoglava inscribed on the UNESCO intangible cultural heritage list
Worked in Croatia from local material, and still a working craft rather than a museum piece.
Made now · natural materials
Still hand-made. Traditional wool
Worked in Croatia from local material, and still a working craft rather than a museum piece.
Made now · natural materials
Linen folk textiles
Worked in Croatia from local material, and still a working craft rather than a museum piece.
Made now · natural materials
Pag island sheep-wool crafts persist
Worked in Croatia from local material, and still a working craft rather than a museum piece.
Could make · grown here already
Bread
Grown in Croatia and mostly sold raw. Processing it here would keep the margin here.
Could make · grown here already
Cereals
Grown in Croatia and mostly sold raw. Processing it here would keep the margin here.
Could make · grown here already
Maize (polenta)
Grown in Croatia and mostly sold raw. Processing it here would keep the margin here.
The maths for an entrepreneur. Croatia produces about US$105 billion a year, which is roughly US$27,104 per person (2025, World Bank). Farming is 2.8% of that, while food is 14.3% of everything the country imports. The country buys in more food than its own farms contribute to the economy, and every point of that gap is a business someone could build here rather than ship in. With 15.5% of the land arable, the raw material for that is already in the ground.
See the verified makers

Culture in Croatia.

Klapa a cappella singing
Unaccompanied multipart singing from Dalmatia, led by a first tenor, with the group standing in a tight semicircle. Most singers are skilled amateurs who learn by ear.
14th to 15th century
Tamburica string music
The tambura is a plucked string instrument brought to south-east Europe by the Ottomans in the 14th and 15th centuries. It is played above all in Slavonia, usually in bands that also accompany Becarac singing.
Kolo circle dance
A folk group dance whose basic shape is a circle, danced to singing, to instruments such as the tambura or bagpipes, or in silence, as in the Nijemo Kolo of the Dalmatian hinterland.
Ojkanje
Two-part singing from the Dalmatian hinterland, sung with a distinctive voice-shaking technique, each song lasting as long as the lead singer can hold their breath. UNESCO lists it as in need of urgent safeguarding.
Ganga singingMultipart singing on a single breath from the Imotski and Vrgorac areas of Dalmatia, added to Croatia's national list of intangible cultural heritage in 2009.
18th centurySinjska Alka knights' tournamentA yearly tournament in Sinj where knights gallop along the main street aiming lances at an iron ring, the alka. Its rules were written down in 1833.
Does Croatia protect its heritage by law?
Partly, and the gaps say as much as the protections.
What is kept alive. Croatia holds one of Europe's densest living folk repertoires. Klapa, the a cappella harmony singing of Dalmatia, and the driving tamburica string music remain widely performed, alongside the kolo circle dance and the older Ojkanje and ganga singing styles. The Sinjska Alka, a knights' tournament held since the eighteenth century, continues each year, as does the becarac verse-singing of Slavonia.
Who it belongs to. Croatia has deep, living cultural heritage, from the UNESCO-listed old towns of Dubrovnik, Split and Trogir to folk music, lacemaking and Mediterranean farming traditions, and inland Istria has a genuine family-run agritourism scene built on wine, olive oil and truffles. The dominant coastal tourism model is large-scale and seasonal, with cruise-ship crowding and overtourism straining Dubrovnik and other honeypots, so a good deal of tourism revenue is extractive rather than community-rooted.
Only here. Plitvice Lakes National Park, sixteen terraced lakes linked by waterfalls over travertine barriers that the flowing water is still building, Croatia's oldest national park and a UNESCO World Heritage site..

The Future of Croatia.

Three futures for Croatia, every one run forward from measured data.
Where the making actually happens
Named craft workshops on the open map: Art materijal, Chypka, HOBBY&HOBBY, Hobby Art Centar Chemaco, Isabel, Juriček.
Every measured trend on one line
Run forward at the pace already recorded.
+4%
Forest cover
1995: 33.4% to 2024: 34.8%
1995202434.8%
+14%
Renewable electricity
1995: 61.4% to 2021: 69.9%
1995202169.9%
+35%
CO2 per person
1995: 3.57 t to 2024: 4.83 t
199520244.8 t
+34%
Tourist arrivals
1995: 16,100k to 2020: 21,608k
1995202021,608k
+178%
Protected land
2013: 13.8% to 2025: 38.4%
2013202538.4%
-79%
Farm workforce
1995: 20.4% to 2025: 4.33%
199520254.3%
+365%
Protected sea
2013: 2% to 2025: 9.3%
201320259.3%
-37%
Agricultural land
1995: 41.7% to 2024: 26.2%
1995202426.2%
+5%
Urban population
1995: 55.2% to 2025: 57.8%
1995202557.8%
-40%
Air pollution
1995: 26.1 µg/m³ to 2023: 15.8 µg/m³
1995202315.8 µg/m³
+20%
Fresh water per person
1995: 8,160 m³ to 2022: 9,778 m³
199520229,777.9 m³
+35%
Adult overweight
1995: 47.7% to 2022: 64.2%
1995202264.2%
+0%
Electricity access
1995: 100% to 2024: 100%
19952024100%
+450%
GDP per person
1995: 4,929 to 2025: 27,104
1995202527,103.9
-16%
Population
1995: 4,620k to 2025: 3,876k
199520253,876.2k
+13%
Renewable energy use
1995: 30.3% to 2021: 34.1%
1995202134.1%
+36%
Energy per person
1995: 1,637 kg to 2024: 2,233 kg
199520242,233.2 kg
+201%
Protected area, total
2013: 8% to 2025: 24.1%
2013202524.1%
+9%
Life expectancy
1995: 72.1 yrs to 2024: 78.9 yrs
1995202478.9 yrs
+51%
Cereal yield
1995: 4,366 kg/ha to 2024: 6,570 kg/ha
199520246,570.5 kg/ha
+12%
Fertiliser use
1995: 162 kg/ha to 2024: 182 kg/ha
19952024181.8 kg/ha
-6%
Rural population
1995: 44.8% to 2025: 42.2%
1995202542.2%
+25%
Water productivity
2002: 75.5 $/m3 to 2022: 94.4 $/m3
2002202294.4 $/m3
-7%
Health spending
2000: 7.65% to 2023: 7.15%
200020237.1%
+4%
Forest area
1995: 18,675 km2 to 2025: 19,462 km2
1995202519,462 km2
+100%
Electric power use
1995: 2,315 kWh to 2024: 4,630 kWh
199520244,630.4 kWh
-47%
Emissions: Agriculture
1990: 4.33 MtCO2e to 2023: 2.29 MtCO2e
199020232.3 MtCO2e
-14%
Emissions: Building
1990: 2.65 MtCO2e to 2023: 2.28 MtCO2e
199020232.3 MtCO2e
-49%
Emissions: Electricity/Heat
1990: 7.9 MtCO2e to 2023: 4.03 MtCO2e
199020234 MtCO2e
-19%
Emissions: Energy
1990: 21.4 MtCO2e to 2023: 17.3 MtCO2e
1990202317.3 MtCO2e
+1%
Emissions: Industrial Processes
1990: 2.94 MtCO2e to 2023: 2.96 MtCO2e
199020233 MtCO2e
-55%
Emissions: Manufacturing/Construction
1990: 5.39 MtCO2e to 2023: 2.45 MtCO2e
199020232.5 MtCO2e
+108%
Emissions: Transportation
1990: 3.67 MtCO2e to 2023: 7.63 MtCO2e
199020237.6 MtCO2e
World Bank open data, recorded series
How much forest is left?
1995202434.8%
Forest cover moved from 33.4% to 34.8% across 29 recorded years.
How clean is the grid?
1995202169.9%
Renewable electricity moved from 61.4% to 69.9% across 26 recorded years.
How much climate pollution per person?
199520244.8 t
CO2 per person moved from 3.57 t to 4.83 t across 29 recorded years.
How many people visit?
1995202021,608k
Tourist arrivals moved from 16,100k to 21,608k across 25 recorded years.
How much land is protected?
2013202538.4%
Protected land moved from 13.8% to 38.4% across 12 recorded years.
How many people still farm?
199520254.3%
Farm workforce moved from 20.4% to 4.33% across 30 recorded years.
How much sea is protected?
201320259.3%
Protected sea moved from 2% to 9.3% across 12 recorded years.
How much land is farmed?
1995202426.2%
Agricultural land moved from 41.7% to 26.2% across 29 recorded years.
How fast is it urbanising?
1995202557.8%
Urban population moved from 55.2% to 57.8% across 30 recorded years.
Is the air getting cleaner?
1995202315.8 µg/m³
Air pollution moved from 26.1 µg/m³ to 15.8 µg/m³ across 28 recorded years.
Is water getting scarcer?
199520229,777.9 m³
Fresh water per person moved from 8,160 m³ to 9,778 m³ across 27 recorded years.
Is diet-related disease rising?
1995202264.2%
Adult overweight moved from 47.7% to 64.2% across 27 recorded years.
Who has power?
19952024100%
Electricity access moved from 100% to 100% across 29 recorded years.
Is income rising?
1995202527,103.9
GDP per person moved from 4,929 to 27,104 across 30 recorded years.
How fast is it growing?
199520253,876.2k
Population moved from 4,620k to 3,876k across 30 recorded years.
What share of all energy is renewable?
1995202134.1%
Renewable energy use moved from 30.3% to 34.1% across 26 recorded years.
How much energy does one person use?
199520242,233.2 kg
Energy per person moved from 1,637 kg to 2,233 kg across 29 recorded years.
How much land and sea is protected together?
2013202524.1%
Protected area, total moved from 8% to 24.1% across 12 recorded years.
How long do people live?
1995202478.9 yrs
Life expectancy moved from 72.1 yrs to 78.9 yrs across 29 recorded years.
How much does a hectare of cereal produce?
199520246,570.5 kg/ha
Cereal yield moved from 4,366 kg/ha to 6,570 kg/ha across 29 recorded years.
How much fertiliser goes on the land?
19952024181.8 kg/ha
Fertiliser use moved from 162 kg/ha to 182 kg/ha across 29 recorded years.
How many people still live rurally?
1995202542.2%
Rural population moved from 44.8% to 42.2% across 30 recorded years.
How much value per cubic metre of water?
2002202294.4 $/m3
Water productivity moved from 75.5 $/m3 to 94.4 $/m3 across 20 recorded years.
How much goes on health?
200020237.1%
Health spending moved from 7.65% to 7.15% across 23 recorded years.
How much forest is there in total?
1995202519,462 km2
Forest area moved from 18,675 km2 to 19,462 km2 across 30 recorded years.
How much electricity per person?
199520244,630.4 kWh
Electric power use moved from 2,315 kWh to 4,630 kWh across 29 recorded years.
How have agriculture emissions moved?
199020232.3 MtCO2e
Agriculture emissions moved from 4.33 to 2.29 MtCO2e across 33 recorded years.
Climate Watch (WRI), historical emissions
How have building emissions moved?
199020232.3 MtCO2e
Building emissions moved from 2.65 to 2.28 MtCO2e across 33 recorded years.
Climate Watch (WRI), historical emissions
How have electricity/heat emissions moved?
199020234 MtCO2e
Electricity/Heat emissions moved from 7.9 to 4.03 MtCO2e across 33 recorded years.
Climate Watch (WRI), historical emissions
How have energy emissions moved?
1990202317.3 MtCO2e
Energy emissions moved from 21.4 to 17.28 MtCO2e across 33 recorded years.
Climate Watch (WRI), historical emissions
How have industrial processes emissions moved?
199020233 MtCO2e
Industrial Processes emissions moved from 2.94 to 2.96 MtCO2e across 33 recorded years.
Climate Watch (WRI), historical emissions
How have manufacturing/construction emissions moved?
199020232.5 MtCO2e
Manufacturing/Construction emissions moved from 5.39 to 2.45 MtCO2e across 33 recorded years.
Climate Watch (WRI), historical emissions
How have transportation emissions moved?
199020237.6 MtCO2e
Transportation emissions moved from 3.67 to 7.63 MtCO2e across 33 recorded years.
Climate Watch (WRI), historical emissions
Worst caseCurrent pathBest case
Worst case
Every measured decline continues at the pace already recorded. The weakest pillar, natural fibres at 2/5, is the one that gives way first.
Computed from: recorded series extended with no policy change
What the best case actually asks for
Lift natural fibres
It scores 2 out of 5 today, among the weakest parts of Croatia's record. Croatia keeps living natural-materials traditions, above all its lacemaking, with the needlepoint lace of Pag and the bobbin lace of Lepoglava inscribed on the UNESCO intangible cultural heritage list and still hand-made.
measured each year
Costs: spending and enforcement, not new technology
Lift food and farming
It scores 3 out of 5 today, among the weakest parts of Croatia's record. Croatia has solid domestic farming, from wheat, maize and sugar beet on the Pannonian plain to olive oil, wine, vegetables and Adriatic fish and shellfish along the coast, plus prized Istrian truffles and Pag cheese.
measured each year
Costs: spending and enforcement, not new technology
Lift plant-based eating
It scores 3 out of 5 today, among the weakest parts of Croatia's record. The Dalmatian coast follows a broadly Mediterranean diet rich in olive oil, vegetables, wild greens such as blitva (Swiss chard), legumes, tomatoes and fruit, which makes unprocessed plant eating easy there.
measured each year
Costs: spending and enforcement, not new technology

Government and Goals in Croatia.

Who is in charge of Croatia now · Office-holders from the UN Protocol and Liaison Service public list of Heads of State and Heads of Government, 20 October 2026. Legislature and election dates from IFES ElectionGuide. Constitution dates from the Constitute Project. Governance scores from the World Bank Worldwide Governance Indicators 2024.
Andrej Plenković
Prime Minister
Andrej Plenković is the head of government of Croatia, in office since 19 October 2016. Every climate, protection and energy pledge on this page is delivered, or not, under this administration.
Public opinion, measured
Voice and accountability, the freedom to question government scores 71.3 out of 100 in 2025. On this World Bank scale, 100 is the strongest governance measured. Down from 71.5 in 2024. World Bank Worldwide Governance Indicators, 2025 data (updated 25 September 2026)
Control of corruption scores 50.6 out of 100 in 2025. On this World Bank scale, 100 is the strongest governance measured. Up from 50.4 in 2024. World Bank Worldwide Governance Indicators, 2025 data (updated 25 September 2026)
Political stability and absence of violence scores 77.6 out of 100 in 2025. On this World Bank scale, 100 is the strongest governance measured. Down from 78.1 in 2024. World Bank Worldwide Governance Indicators, 2025 data (updated 25 September 2026)
Rule of law scores 65.6 out of 100 in 2025. On this World Bank scale, 100 is the strongest governance measured. Up from 65.3 in 2024. World Bank Worldwide Governance Indicators, 2025 data (updated 25 September 2026)
Regulatory quality scores 63.0 out of 100 in 2025. On this World Bank scale, 100 is the strongest governance measured. Up from 62.0 in 2024. World Bank Worldwide Governance Indicators, 2025 data (updated 25 September 2026)
Andrej PlenkovićPrime Minister
Croatian Parliament (Hrvatski Sabor)Legislature, unicameral
Last election17 April 2024
Constitution1991, as revised to 2013
Government typeparliamentary republic
Croatia national goals: climate commitments on record · as recorded by Climate Watch, World Resources Institute
2050
Net zero
In Policy Document
Net-zero target as recorded by Climate Watch. Status: In Policy Document (6/1/2021) Source
Gases covered
All GHGs Covered Source
Sectors covered
All Sectors Source
International offsets
Unclear or Undecided Source

Plain Answers About Croatia.

The questions people actually type, answered in full sentences from the sourced data above.
Swipe
Is Croatia sustainable?
Croatia scores 67 out of 100 on the Throne Eco Index, across twelve equally weighted pillars. A forested, water-rich Adriatic country where about 38% of the land carries protected status and organic farming and recycling are climbing, though mass coastal tourism and modest marine protection weigh against it.
Is the water in Croatia safe and plentiful?
Croatia is comfortably water-rich, drained by major rivers such as the Sava, Drava and Danube in the interior and threaded with clean karst rivers and springs in the Dinaric interior, home to the terraced lakes of Plitvice and the waterfalls of Krka. Tap water is potable across the country. The WHO/UNICEF JMP safely managed figure stands at about 87.1% (World Bank, 2022), and the Adriatic islands can face summer water stress that is met by mainland pipelines and tankering.
Can Croatia feed itself?
Croatia has solid domestic farming, from wheat, maize and sugar beet on the Pannonian plain to olive oil, wine, vegetables and Adriatic fish and shellfish along the coast, plus prized Istrian truffles and Pag cheese. It is, however, a net food importer and does not fully cover its own consumption.
Is it easy to eat plant-based in Croatia?
The Dalmatian coast follows a broadly Mediterranean diet rich in olive oil, vegetables, wild greens such as blitva (Swiss chard), legumes, tomatoes and fruit, which makes unprocessed plant eating easy there. Continental Croatian cuisine is heavier on meat and dairy, and dedicated vegetarian and vegan options, while growing in Zagreb, Split and the tourist centres, remain modest in smaller towns. Good local produce is widely available even where the culture is not strongly plant-based.
How much of Croatia is actually protected?
On paper Croatia protects a lot of land, about 38.5% (World Bank, 2025), but most of that is the EU Natura 2000 network, which is a multi-use conservation designation rather than strict reserve, so the headline overstates on-the-ground protection. The strictly protected core, eight national parks including Plitvice Lakes and Krka and twelve nature parks, is well managed and much smaller. Marine protection is comparatively modest at about 9.3% of territorial waters, and coastal development and tourism add pressure.
What wildlife is left in Croatia?
Croatia retains Europe's large carnivores, with a brown bear population of roughly a thousand plus wolves and the reintroduced Eurasian lynx in the Dinaric mountains and Gorski Kotar forests. The karst underworld is a genuine endemism hotspot, most famously home to the olm (Proteus anguinus), a blind cave-dwelling salamander, along with endemic karst fish and cave invertebrates. The Adriatic supports bottlenose dolphins and important seabird and fish populations.
Is Croatia on clean energy?
Croatia draws about 54% of its electricity from low-carbon sources, with hydropower near 28%, wind around 15% and solar close to 6%, while fossil fuels supply roughly 17% and imports cover more than a quarter of demand (Low Carbon Power, 2025). Emissions sit in the mid-range at about 4.83 tonnes of CO2 per person in 2024 (Our World in Data). As an EU member state, Croatia is bound by the European Climate Law, its 2050 climate-neutrality target and the Fit for 55 package (European Commission).
How polluted is Croatia?
As an EU member Croatia applies the EU Single-Use Plastics Directive, banning items such as plastic straws, cutlery, plates, cotton buds and expanded-polystyrene food containers since 2021, alongside charges on plastic bags. Air quality is moderate, with a national mean PM2.5 of about 15.8 micrograms per cubic metre in 2023 (World Bank), improving over the past decade though still above the WHO guideline, with winter wood and solid-fuel heating a factor inland. The Adriatic is among the cleaner seas of the Mediterranean.
Does recycling work in Croatia?
Croatia's municipal recycling rate reached about 36% in 2023 (Eurostat), up sharply from single digits fifteen years ago as EU-driven separate collection and deposit-return schemes expanded. A long-standing deposit-return system for drinks packaging achieves high bottle and can returns. The rate still trails the EU leaders but has improved markedly.
Is the farming in Croatia organic?
Organic farming has grown strongly and now covers around 9% of Croatia's utilised agricultural area (Eurostat), close to the EU average and well ahead of most of the Americas. The sector spans olive oil, wine, honey and field crops, supported by EU rural-development funding. This is a genuine and expanding share rather than a niche.
Are there natural materials and craft in Croatia?
Croatia keeps living natural-materials traditions, above all its lacemaking, with the needlepoint lace of Pag and the bobbin lace of Lepoglava inscribed on the UNESCO intangible cultural heritage list and still hand-made. Traditional wool and linen folk textiles and Pag island sheep-wool crafts persist, and the necktie itself derives from the 17th-century Croatian cravat. These are craft-scale living traditions rather than a mainstream materials economy.
Is there living culture in Croatia?
Croatia has deep, living cultural heritage, from the UNESCO-listed old towns of Dubrovnik, Split and Trogir to folk music, lacemaking and Mediterranean farming traditions, and inland Istria has a genuine family-run agritourism scene built on wine, olive oil and truffles. The dominant coastal tourism model is large-scale and seasonal, with cruise-ship crowding and overtourism straining Dubrovnik and other honeypots, so a good deal of tourism revenue is extractive rather than community-rooted.
What heritage does Croatia keep alive?
Croatia holds one of Europe's densest living folk repertoires. Klapa, the a cappella harmony singing of Dalmatia, and the driving tamburica string music remain widely performed, alongside the kolo circle dance and the older Ojkanje and ganga singing styles. The Sinjska Alka, a knights' tournament held since the eighteenth century, continues each year, as does the becarac verse-singing of Slavonia.

How Croatia Ranks, region and world.

Where Croatia sits on the Eco Index, against its Europe neighbours and the 77 destinations scored worldwide.
How does Croatia compare in Europe?
Scored Europe destinations, Eco Index.
The global top 10 of the 77 destinations scored
10Spain73
Croatia sits 31 of 77 at 67/100. Every name links to its own destination page, built exactly like this one. The full ranking
What is Croatia particularly good at?
✓ Water, scored 4/5. Croatia is comfortably water-rich, drained by major rivers such as the Sava, Drava and Danube in the interior and threaded with clean karst rivers and springs in the Dinaric interior, home to the terraced lakes of Plitvice and the waterfalls of Krka. Tap water is potable across the country. The WHO/UNICEF JMP safely managed figure stands at about 87.1% (World Bank, 2022), and the Adriatic islands can face summer water stress that is met by mainland pipelines and tankering. Abundant, high-quality freshwater keeps this strong.
✓ Organic farming, scored 4/5. Organic farming has grown strongly and now covers around 9% of Croatia's utilised agricultural area (Eurostat), close to the EU average and well ahead of most of the Americas. The sector spans olive oil, wine, honey and field crops, supported by EU rural-development funding. This is a genuine and expanding share rather than a niche.
✓ Conservation, scored 4/5. On paper Croatia protects a lot of land, about 38.5% (World Bank, 2025), but most of that is the EU Natura 2000 network, which is a multi-use conservation designation rather than strict reserve, so the headline overstates on-the-ground protection. The strictly protected core, eight national parks including Plitvice Lakes and Krka and twelve nature parks, is well managed and much smaller. Marine protection is comparatively modest at about 9.3% of territorial waters, and coastal development and tourism add pressure. Strong designated coverage, but softened by the Natura 2000 caveat and limited marine protection.
Where does Croatia score worst?
✕ Natural fibres, scored 2/5. Croatia keeps living natural-materials traditions, above all its lacemaking, with the needlepoint lace of Pag and the bobbin lace of Lepoglava inscribed on the UNESCO intangible cultural heritage list and still hand-made. Traditional wool and linen folk textiles and Pag island sheep-wool crafts persist, and the necktie itself derives from the 17th-century Croatian cravat. These are craft-scale living traditions rather than a mainstream materials economy.
✕ Food and farming, scored 3/5. Croatia has solid domestic farming, from wheat, maize and sugar beet on the Pannonian plain to olive oil, wine, vegetables and Adriatic fish and shellfish along the coast, plus prized Istrian truffles and Pag cheese. It is, however, a net food importer and does not fully cover its own consumption. Fresh, seasonal local produce is a strong feature of everyday markets and cuisine.
✕ Plant-based eating, scored 3/5. The Dalmatian coast follows a broadly Mediterranean diet rich in olive oil, vegetables, wild greens such as blitva (Swiss chard), legumes, tomatoes and fruit, which makes unprocessed plant eating easy there. Continental Croatian cuisine is heavier on meat and dairy, and dedicated vegetarian and vegan options, while growing in Zagreb, Split and the tourist centres, remain modest in smaller towns. Good local produce is widely available even where the culture is not strongly plant-based.
A note from the lens of mother natureSwipe
Natural fibres, 2/5
Croatia keeps living natural-materials traditions, above all its lacemaking, with the needlepoint lace of Pag and the bobbin lace of Lepoglava inscribed on the UNESCO intangible cultural heritage list and still hand-made.
Consequence: It is the lowest-scoring part of Croatia's record, so it is where the score moves first.
Food and farming, 3/5
Croatia has solid domestic farming, from wheat, maize and sugar beet on the Pannonian plain to olive oil, wine, vegetables and Adriatic fish and shellfish along the coast, plus prized Istrian truffles and Pag cheese. It is, however, a net food importer and does not fully cover its own consumption.
Plant-based eating, 3/5
The Dalmatian coast follows a broadly Mediterranean diet rich in olive oil, vegetables, wild greens such as blitva (Swiss chard), legumes, tomatoes and fruit, which makes unprocessed plant eating easy there.

The Croatia Directory.

Everything on Hold The Throne that sits in Croatia, checked and listed.
How the rest of the world scores Croatia
Independent global indices, for calibration.
Forest cover
34.8
World Bank, 2024.
Protected land
38.4
World Bank, 2025.
Protected sea
9.3
World Bank, 2025.
Renewable grid
69.9
World Bank, 2021.
CO2 per person
4.8
World Bank, 2024.
Threatened species
117
Recorded figure, sourced on this page.
Control of corruption
50.6 / 100
World Bank Worldwide Governance Indicators, 2025. Score from 0 to 100, where 100 is the strongest governance.
Government effectiveness
68.1 / 100
World Bank Worldwide Governance Indicators, 2025. Score from 0 to 100, where 100 is the strongest governance.
Rule of law
65.6 / 100
World Bank Worldwide Governance Indicators, 2025. Score from 0 to 100, where 100 is the strongest governance.
Political stability
77.6 / 100
World Bank Worldwide Governance Indicators, 2025. Score from 0 to 100, where 100 is the strongest governance.
Voice and accountability
71.3 / 100
World Bank Worldwide Governance Indicators, 2025. Score from 0 to 100, where 100 is the strongest governance.
Environmental Performance Index
52.8 / 100 · 36 of 177
Yale Environmental Performance Index 2026, ranked 36 of 177 countries assessed.
Ecosystem vitality
53.8 / 100 · 36 of 177
Yale Environmental Performance Index 2026, ranked 36 of 177 countries assessed.
Biodiversity and habitat
60.5 / 100 · 28 of 177
Yale Environmental Performance Index 2026, ranked 28 of 177 countries assessed.
Air quality
47.9 / 100 · 65 of 177
Yale Environmental Performance Index 2026, ranked 65 of 177 countries assessed.
Terrestrial biomes protected
100.0 / 100 · 1 of 177
Yale Environmental Performance Index 2026, ranked 1 of 177 countries assessed.
Marine habitat protected
37.1 / 100 · 35 of 111
Yale Environmental Performance Index 2026, ranked 35 of 111 countries assessed.

How Croatia Is Scored. The Throne Standard.

Every destination on the index is scored the same way, so a 4 in Barbados means exactly what a 4 means in Iceland. No self-declared data and no brochure claims are accepted. Seven pillars are scored from published measurements with the same fixed thresholds everywhere: energy (low-carbon share of electricity, 90% or more scores 5, 70% 4, 50% 3, 25% 2), conservation (land and sea protected), water (safe drinking water, wastewater treated, water stress), organic farmland, recycling, food import dependence and air quality. Where a measurement is not published for a place, that pillar keeps its source-assessed score and is labelled as such. Wildlife, culture, heritage, materials and plant-based eating have no comparable measurement and are assessed from the named sources. The Eco Index is the average of the twelve pillar scores multiplied by 20. Every figure on this page carries its named source and year, and the history on each page names what empire took as plainly as it scores the present.
The 12 pillars every destination is scored on, equally weighted
01
Water
Safe drinking water, wastewater treated and water stress. Measured.
02
Food & farming
How much of the import bill is food: whether the place feeds itself. Measured.
03
Plant-based
How easy it is to eat plant-based, from documented sources.
04
Organic
Certified organic share of farmland. Measured.
05
Conservation
Land and sea legally protected, against the 30 by 30 goal. Measured.
06
Wildlife
What survives, what is endemic, what is lost, from documented sources.
07
Materials
Local natural fibres and craft, from documented sources.
08
Pollution
Air quality (PM2.5, measured) and plastics and waste policy.
09
Recycling
Share of municipal waste recycled. Measured.
10
Energy
Low-carbon share of electricity, nuclear included. Measured.
11
Culture
Living culture and community-led visits, from documented sources.
12
Heritage
What the law keeps standing, from documented sources.
What each 0 to 5 pillar score means, in plain words
0
Absent
nothing verifiable exists
1
Failing
measurably going the wrong way
2
Weak
claims outrun delivery
3
Fair
real effort, mixed results
4
Strong
genuinely good, evidence named
5
Leading
world class, and the trend holds
Where the numbers come from.
IUCN logo
World Bank logo
Eurostat logo
FAO logo
UNESCO logo
BirdLife International logo
Convention on Biological Diversity logo
UNEP-WCMC logo
WHO/UNICEF Joint Monitoring Programme logo
European Commission logo
Climate Watch (WRI) logo
IEA logo
IHME logo
Low Carbon Power logo
Our World in Data logo
The institutions above are the ones cited on this page, ranked by how many of its figures they carry. This same sectioned page renders for all 77 scored destinations, each with its own researched history, comparison charts and three-way future. Read the full methodology
Every figure on this page, and where it came from: 85 sources across 33 institutions
World Bank15 FIGURES
  • Forest area (% of land area) AG.LND.FRST.ZS, Croatia, 2023 (34.8%) check
  • Terrestrial protected areas (% of total land area) ER.LND.PTLD.ZS, Croatia, 2023 (38.5%) check
  • Marine protected areas (% of territorial waters) ER.MRN.PTMR.ZS, Croatia, 2025 (9.3%) check
  • Renewable electricity output (% of total electricity output) EG.ELC.RNEW.ZS, Croatia, 2021 (69.9%) check
  • CO2 emissions per capita EN.GHG.CO2.PC.CE.AR5, 2024 check
  • GDP (current US$) NY.GDP.MKTP.CD, 2025 check
  • International tourist arrivals ST.INT.ARVL, 2020 check
  • Agricultural land (% of land area) AG.LND.AGRI.ZS, 2023 check
  • Arable land (% of land area) AG.LND.ARBL.ZS, 2023 check
  • Agriculture, value added (% of GDP) NV.AGR.TOTL.ZS, 2025 check
  • Adult literacy rate SE.ADT.LITR.ZS, 2001 check
  • Renewable internal freshwater per capita (m3) ER.H2O.INTR.PC, 2022 check
  • Safely managed sanitation (% of population) SH.STA.SMSS.ZS, 2021 check
  • Overweight prevalence, adults (%) SH.STA.OWAD.ZS, 2022 check
  • Population total SP.POP.TOTL, 2025 check
IUCN Red List assessment12 FIGURES
  • Cricetus cricetus (Common hamster), Banaszek et al. 2020, Critically Endangered on the IUCN Red List, and recorded in Croatia in GBIF occurrence data (mammal). check
  • Cricetus cricetus (Common hamster), Banaszek et al. 2020 corroboration check
  • Cricetus cricetus (Common hamster), Banaszek et al. 2020 corroboration check
  • Squatina squatina (Angelshark), Morey et al. 2019, Critically Endangered on the IUCN Red List, and recorded in Croatia in GBIF occurrence data (shark or ray). check
  • Squatina squatina (Angelshark), Morey et al. 2019 corroboration check
  • Squatina squatina (Angelshark), Morey et al. 2019 corroboration check
  • Stenobothrus croaticus, Chobanov et al. 2016, Critically Endangered on the IUCN Red List, and recorded in Croatia in GBIF occurrence data (insect). check
  • Stenobothrus croaticus, Chobanov et al. 2016 corroboration check
  • Stenobothrus croaticus, Chobanov et al. 2016 corroboration check
  • Pinna nobilis (Noble pen shell), Kersting et al. 2019, Critically Endangered on the IUCN Red List, and recorded in Croatia in GBIF occurrence data (species). check
  • Pinna nobilis (Noble pen shell), Kersting et al. 2019 corroboration check
  • Pinna nobilis (Noble pen shell), Kersting et al. 2019 corroboration check
Eurostat5 FIGURES
  • Area under organic farming as share of total utilised agricultural area (sdg_02_40), Croatia (about 9%) check
  • Recycling rate of municipal waste (cei_wm011), Croatia, 2023 (about 36%) check
  • UN SDG Global Database, electronic waste recycled (%) EN_EWT_RCYR, Croatia, 2018 (91.2%), country-reported check
  • recycling rate of municipal waste (cei_wm011) check
  • municipal waste by treatment operation (env_wasmun) check
Ministry of Culture and Media4 FIGURES
  • immovable cultural goods on the UNESCO World Heritage List, Croatia has deep, living cultural heritage, from the UNESCO-listed old towns of Dubrovnik, Split and Trogir to check
  • immovable cultural goods on the UNESCO World Heritage List corroboration check
  • immovable cultural goods on the UNESCO World Heritage List corroboration check
  • immovable cultural goods on the UNESCO World Heritage List corroboration check
BirdLife International, IUCN and UNEP-WCMC3 FIGURES
  • UN SDG Global Database, terrestrial Key Biodiversity Areas covered by protected areas (%) ER_PTD_TERR, Croatia, 2025 (82.0%), country-reported check
  • UN SDG Global Database, marine Key Biodiversity Areas covered by protected areas (%) ER_MRN_MPA, Croatia, 2025 (84.6%), country-reported check
  • UN SDG Global Database, freshwater Key Biodiversity Areas covered by protected areas (%) ER_PTD_FRHWTR, Croatia, 2025 (100.0%), country-reported check
CBD COP15 Decision 15/43 FIGURES
  • Kunming-Montreal Global Biodiversity Framework, Target 3, The 30x30 target is 30% by 2030, so 20.7 percentage points are still to be designated. check
  • Kunming-Montreal Global Biodiversity Framework, Target 3 corroboration check
  • Kunming-Montreal Global Biodiversity Framework, Target 3 corroboration check
FAO, Global Forest Resources Assessment3 FIGURES
  • UN SDG Global Database, forest area (% of land area) AG_LND_FRST, Croatia, 2025 (34.8%), country-reported check
  • UN SDG Global Database, forest area under a long-term management plan (%) AG_LND_FRSTMGT, Croatia, 2025 (100.0%), country-reported check
  • UN SDG Global Database, forest area inside legally established protected areas (%) AG_LND_FRSTPRCT, Croatia, 2025 (45.5%), country-reported check
Hrvatski sabor (Croatian Parliament)3 FIGURES
  • Constitutional Decision on the Sovereignty and Independence of the Republic of Croatia, 25 June 1991, Independence was declared in 1991 and followed by four years of war. check
  • Constitutional Decision on the Sovereignty and Independence of the Republic of Croatia, 25 June 1991 corroboration check
  • Constitutional Decision on the Sovereignty and Independence of the Republic of Croatia, 25 June 1991 corroboration check
UNESCO Institute for Statistics3 FIGURES
  • government expenditure on education as % of GDP, Croatia, Public spending on education runs at 4.1% of GDP and 8.5% of all government spending, and secondary enrolment check
  • government expenditure on education as % of GDP, Croatia corroboration check
  • government expenditure on education as % of GDP, Croatia corroboration check
WHO/UNICEF Joint Monitoring Programme3 FIGURES
  • World Bank, People using safely managed drinking water services SH.H2O.SMDW.ZS, Croatia, 2022 (87.1%) check
  • UN SDG Global Database, population using safely managed drinking water (%) SH_H2O_SAFE, Croatia, 2024 (87.3%), modelled estimate check
  • UN SDG Global Database, population using safely managed sanitation (%) SH_SAN_SAFE, Croatia, 2021 (74.7%), modelled estimate check
European Commission2 FIGURES
  • Single-Use Plastics Directive (EU) 2019/904 check
  • 2050 long-term climate strategy check
FAO2 FIGURES
  • FAOSTAT Production: Crops and livestock products, Europe bulk file (domain QCL), By tonnage, the largest crops grown in Croatia are maize, green corn, wheat, sugar beet and barley (FAO, FAOST check
  • FAOSTAT Production: Crops and livestock products, Europe bulk file (domain QCL) corroboration check
IUCN2 FIGURES
  • The IUCN Red List of Threatened Species, Critically Endangered, the last IUCN category before Extinct in the Wild, and still recorded in Croatia. check
  • The IUCN Red List of Threatened Species corroboration check
Ministry of Culture and Media of the Republic of Croatia2 FIGURES
  • Lacemaking in Croatia, Croatia keeps living natural-materials traditions, above all its lacemaking, with the needlepoint lace of Pag check
  • Lacemaking in Croatia corroboration check
Other published sources2 FIGURES
  • Not Evaluated: the Critically Endangered assessment belongs to Puccinellia gussonei, a Sicilian species, and the name was matched to it in error check
  • Jelsa is not in DarkSky International's certified places directory; its own tourist board recorded a 2021 candidacy to become the first such community in Croatia, not Southern Europe check
Plitvice Lakes National Park public institution2 FIGURES
  • General information, Plitvice Lakes National Park, sixteen terraced lakes linked by waterfalls over travertine barriers that the fl check
  • General information corroboration check
UN Comtrade2 FIGURES
  • Croatia annual exports by HS chapter, 2023, The largest single export, mineral fuels and oils, is 12.0% of the total (2023, UN Comtrade). check
  • Croatia annual exports by HS chapter, 2023 corroboration check
Zakon o zastiti zivotinja2 FIGURES
  • Narodne novine 102/2017 (Croatian official gazette), Croatia banned fur farming in 2017 and prohibits keeping cetaceans in captivity, so there are no dolphin shows check
  • Narodne novine 102/2017 (Croatian official gazette) corroboration check
"more than a thousand"1 FIGURE
  • the figure the Krapina Neanderthal Museum publishes; 900 bones and the "largest collection at one site" claim both confirmed by the museum check
79% Catholic1 FIGURE
  • 3.3% Serbian Orthodox, 1.3% Muslim, nearly 5% non-religious or atheist at the 2021 census check
Climate Watch (WRI)1 FIGURE
Constitute Project1 FIGURE
  • Croatia 1991 (rev. 2013) check
Croatian Agency for the Environment and Nature1 FIGURE
  • national environmental authority check
Croatian Bureau of Statistics1 FIGURE
  • national statistical authority check
IEA, World Energy Balances1 FIGURE
  • UN SDG Global Database, renewable share of total final energy consumption (%) EG_FEC_RNEW, Croatia, 2023 (30.2%), modelled estimate check
IFES ElectionGuide1 FIGURE
  • Croatia elections and chambers check
Low Carbon Power1 FIGURE
  • Croatia electricity mix, 2025 check
Our World in Data1 FIGURE
  • CO2 emissions per capita, 2024 check
UN Protocol and Liaison Service1 FIGURE
  • Heads of State, Heads of Government and Ministers for Foreign Affairs, public list dated 20 October 2026 check
UNESCO1 FIGURE
  • Lacemaking in Croatia (Pag and Lepoglava) check
UNESCO World Heritage Centre1 FIGURE
  • Plitvice Lakes National Park check
World Bank / GBD-IHME1 FIGURE
  • PM2.5 air pollution mean annual exposure EN.ATM.PM25.MC.M3, Croatia, 2023 (15.8 µg/m³) check
World Bank / IUCN Red List1 FIGURE
  • threatened species by group, Croatia, 2022 (mammals 10, birds 16, fish 80, higher plants 11; combined 117) check