Destinations › Asia · The Destination Index · universal template · every figure sourced
Indonesia.
Southeastern Asia, archipelago between the Indian Ocean and the Pacific Ocean. 1,904,569 sq km and 285,721,236 people, 54,716 km of coastline, tropical; hot, humid; more moderate in highlands.
Region · AsiaPopulation · ~285,721,236Languages · Indonesian (official), Javanese, Sundanese, Madurese. Over 700 living languagesEco Index · 65/100 · Passable
16,107,000 visitors a year · 285,721,236 residents
The Eco Index across 12 pillars · scored 0 to 5 · World Bank, OWID, WHO/UNICEF JMP, FiBL, Protected Planet, IUCN, UNESCO (2023-24)
Conservation
Wildlife
Water
Food & farming
Organic & clean
Climate & energy
Waste
Health
Heritage
Ownership
Governance
Future
The History of Indonesia.
Indonesia carries an exceptionally rich living heritage across its islands, from gamelan orchestras and wayang kulit shadow puppetry to the Balinese Legong, Barong and Kecak dances and the Saman dance of Aceh. Batik, kris craft and angklung music remain part of daily and ceremonial life.
Where the name comes from
Greek-derived and coined in the nineteenth century by Europeans, 'Indian islands'. Indonesians adopted it as a national name in the independence movement. Source: UK Permanent Committee on Geographical Names toponymic factfile.
The land itself: coastal lowlands across the archipelago, with interior mountains on the larger islands. Its high point is Puncak Jaya, 4,884 m. Source: UK Permanent Committee on Geographical Names toponymic factfile.
Where it starts
The oldest story ever painted
Java holds one of the richest records of early humans anywhere, with fossils at Sangiran covering more than a million years, and Flores was home to a small-bodied human species alongside dwarf elephants. On Sulawesi, a painted scene at Leang Karampuang showing figures and a pig has been dated to around 51,200 years ago, making it the oldest known narrative art anywhere in the world. Storytelling in pictures begins here, not in Europe.
How it got here
Voyaging, trade, independence
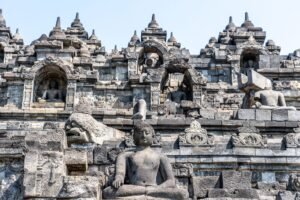
Austronesian seafarers settled the archipelago and went on to reach Madagascar and the Pacific. Maritime states, Srivijaya and later Majapahit, controlled trade across the straits, and Borobudur and Prambanan were built in Java. Islam spread through trading ports rather than conquest. The Dutch East India Company and then the Dutch state took control, imposing forced cultivation systems. Independence was declared in 1945 and recognised in 1949, and thirty-two years of authoritarian rule ended with Reformasi in 1998.
The timeline
c. 1.5 to 1 million years ago
Sangiran.
Java holds one of the richest records of early humans anywhere, with fossils covering more than a million years. ↗
c. 51,200 years ago
Leang Karampuang.
A painted scene on Sulawesi showing figures and a pig is the oldest known narrative art anywhere in the world. ↗
c. 100,000 to 50,000 years ago
Flores.
A small-bodied human species, Homo floresiensis, lived on Flores alongside dwarf elephants. ↗
c. 2000 BC onward
Austronesian voyaging.
Seafaring communities settle the archipelago and go on to reach Madagascar and the Pacific. ↗
c. 700s to 1300s
Srivijaya and Majapahit.
Maritime states control trade across the straits, and Borobudur and Prambanan are built in Java. ↗
c. 1200s onward
Islam arrives by trade.
Islam spreads through trading ports from the thirteenth century rather than by conquest, carried along the routes that already moved spices. That is why Indonesian Islam layered onto existing Hindu, Buddhist and local practice rather than replacing it. ↗
1600s to 1945
Dutch rule.
The Dutch East India Company and then the Dutch state take control, with forced cultivation systems. ↗
1945 to 1949
Independence.
Independence is declared by Sukarno in August 1945, and recognised by the Netherlands in 1949. ↗
1998
Reformasi.
Thirty-two years of authoritarian rule end and democratic reform begins. ↗
Terrestrial protected areas cover about 12% and marine areas about 3% (World Bank, 2025), including flagship parks such as Komodo, Lorentz and Gunung Leuser. Coverage sits in the middle band, but enforcement is uneven and clearing for palm oil and mining continues inside and around reserves.
Is wild Indonesia protected? 12% of the land is, against a 30% target for 2030
How protected is nature in Indonesia?
Forest cover47.7%
Terrestrial protected area12%
Marine protected area3%
1,716 (mammals, birds, fish & plants) listed as threatened.
Critically Endangered, the last IUCN category before Extinct in the Wild, and still recorded in Indonesia. GBIF holds 94 verified occurrence records.
Bali Myna (Leucopsar rothschildi)
Critically Endangered, the last IUCN category before Extinct in the Wild, and still recorded in Indonesia. GBIF holds 59 verified occurrence records.
Hawksbill (Eretmochelys imbricata)
Critically Endangered, the last IUCN category before Extinct in the Wild, and still recorded in Indonesia. GBIF holds 174 verified occurrence records.
Giant clam (Tridacna gigas)
Critically Endangered, the last IUCN category before Extinct in the Wild, and still recorded in Indonesia. GBIF holds 26 verified occurrence records.
Species named here are drawn from GBIF occurrence records for Indonesia filtered to the IUCN Red List threatened categories. Species are listed where GBIF holds occurrence records for them in this country. Record counts are not published here because the figure cannot be reproduced from a public GBIF query.
National park in Aceh, mapped and named in the open record for Indonesia. OpenStreetMap.
Water and Ocean in Indonesia.
Indonesia has abundant rainfall and major rivers across its islands, so raw freshwater supply is not the constraint. The problem is delivery and quality: the WHO/UNICEF JMP figure for safely managed drinking water is only about 30% (2024), and Jakarta suffers severe groundwater over-extraction and land subsidence. Tap water is not safe to drink and most residents boil or buy it.
Does Indonesia have enough fresh water? Yes, with headroom
30.5% of people here have safely managed drinking water at home (2024, WHO/UNICEF JMP). Coverage is well short of universal, so a visitor should not assume the tap is safe.
Cleanest water: Upland spring-fed rivers in Bali and the eastern islands
How much fresh water does Indonesia have, per person?
7,240 m³
Indonesia
1,000 m³
the UN “water scarce” line
Indonesia withdraws about 222,635 million cubic metres of fresh water a year (2022). That is 29.7% of the fresh water actually available to it, which FAO counts as medium water stress. Of what is taken, farming takes 85%, homes and towns 11%, industry 4%. Source: FAO AQUASTAT.
What are the rules on Indonesia beaches?
✕Tap water: Not drinkable.
✕Plastic rules: No national ban; Bali (2019) and Jakarta (2020) ban single-use plastics.
✕Solo travel: rated take care on the record for this destination.
✕Marine protection: 3% of the sea is protected. The 30x30 pledge for 2030 is not met yet.
3% of territorial waters are protected, against the 30% pledged for 2030 under the Global Biodiversity Framework.
Cleanest
Where the water is cleanest
Upland spring-fed rivers in Bali and the eastern islands.
The record
Measured
Indonesia has abundant rainfall and major rivers across its islands, so raw freshwater supply is not the constraint. The problem is delivery and quality: the WHO/UNICEF JMP figure for safely managed drinking water is only about 30% (2024), and Jakarta suffers severe groundwater over-extraction and land subsidence.
Sea protected
3%
Against the 30% pledged for 2030 under the Global Biodiversity Framework.
Threatened species
1,716 (mammals, birds, fish & plants)
Mammals, birds, fish and higher plants on the IUCN list.
Cleanest water
here
Upland spring-fed rivers in Bali and the eastern islands.
Is the tap water safe in Indonesia?
30.5% of people have safely managed drinking water at home (2024, WHO/UNICEF JMP). Renewable fresh water works out at about 7,240 cubic metres per person a year (World Bank).
How hard is the water supply being pushed?
Of every 10 buckets nature refills, 3 are already taken. Withdrawals run at 29.7% of what Indonesia renews internally each year (2022, World Bank / FAO AQUASTAT). That is past the 25% mark generally treated as water stress, so the supply is being pushed towards its limit.
When is the best time to visit Indonesia? Tap your month.
Tap your month.
JanFebMarAprMayJunJulAugSepOctNovDec
.
How much fresh water does Indonesia actually have?
Nature renews about 7,240 cubic metres of fresh water per person per year here. That ranks Indonesia 148 of 208 countries measured, putting it in the wetter half of the world. The UN treats anything under 1,000 cubic metres as water scarce, and this is above that line. World Bank / FAO AQUASTAT.
Indonesia is a major agricultural nation and one of the world's largest rice producers, broadly self-sufficient in its staple while importing wheat, soy and sugar. Smallholder farming, home gardens and wet-rice terraces remain widespread across Java, Sumatra and Bali.
Where does the food in Indonesia come from?
10.2% imported
about US$24,688m a year
On the plate: Rice, tempeh, tofu, cassava, chilli, coconut
How often each food is on the plate
Share of people eating each one regularly. These overlap, so they do not add up to 100%.
Rice60%
Tempeh51%
Tofu42%
Cassava33%
Chilli24%
Coconut15%
1 of 10
bites are imported
The island buys in more food energy than it eats. About US$24,688m a year leaves the country to pay for it. The green slice is roughly what still grows here.
About 10.2% of everything Indonesia buys in from abroad is food, roughly 1 in every 10 imported items on the dock (2025, World Bank). Farming itself is 13.1% of the economy and 29.1% of the land is agricultural, of which 9.4% is arable. The green slice is roughly what still grows here.
What is killing people in Indonesia? The imported diet.
Cause of death, and the diet behind it.
Non-communicable diseases, all combined52.2%
Diabetes11.3%
Adults living with overweight or obesity. 38.1%.
Can Indonesia feed itself?
9.4%
Arable land
29.1%
Agricultural land
40,155,013
Farmers
43,942,442
Arable acres
13.1%
Agriculture, share of GDP
Harvest: Two rice harvests in many areas; main crop around March to April
Feeding itself
Indonesia is a major agricultural nation and one of the world's largest rice producers, broadly self-sufficient in its staple while importing wheat, soy and sugar. Smallholder farming, home gardens and wet-rice terraces remain widespread across Java, Sumatra and Bali.
Certification
Certified organic land is about 0.1% of agricultural area (FiBL, 2024 data), among the lowest shares measured, even though much smallholder farming is low-input by default.
Water for crops
Indonesia has abundant rainfall and major rivers across its islands, so raw freshwater supply is not the constraint. The problem is delivery and quality: the WHO/UNICEF JMP figure for safely managed drinking water is only about 30% (2024), and Jakarta suffers severe groundwater over-extraction and land subsidence.
Why the organic number looks like that. Certified-organic farmland is not separately reported for Indonesia, and that is a certification gap rather than proof nothing is grown cleanly. What the official land record does show: 29.1% of the country is agricultural land and 9.4% is arable (2023, World Bank). Certification is paid for per farm per year by a foreign body, which prices out smallholders, so the organic number reads worse than the practice.
The plant-based kitchen here is not an import. By tonnage, the largest crops grown in Indonesia are oil palm fruit, rice, sugarcane, coconuts and cassava (FAO, FAOSTAT crop production, 2024). That is what the land itself puts on a plate.
Buy direct where residents buy: Kain Harum market, Pasar Jodoh (Wet Market), Fruit Market (Pasar Buah Kali 5), Market (veggies fruits sarong chicken). Each is a mapped, named marketplace, so the money stays with the seller rather than the importer. OpenStreetMap.
Indonesia's per-capita CO2 emissions are relatively low at about 2.9 tonnes per person in 2024 (Our World in Data, Global Carbon Project), but its power sector is dominated by coal at roughly 62% of generation, with renewables, mainly geothermal and hydropower, near a fifth (IEA). It is the world's largest thermal coal exporter, shipping a record of about 555 million tonnes in 2024 before exports fell to about 514 million tonnes in 2025. The country has pledged net-zero by 2060 and signed a Just Energy Transition Partnership intended to bring coal decline forward. The heavy coal dependence and export role weigh against its low per-capita figure.
What powers Indonesia?
Renewable 18.1%Fossil 81.9%
Climate pollution per person
The safe amount, what the planet can absorb
2 tonnes
One person here
2.87 tonnes
The world average, for comparison
4.7 tonnes
The worst it ever got
2.87 tonnes
The grid
Indonesia's per-capita CO2 emissions are relatively low at about 2.9 tonnes per person in 2024 (Our World in Data, Global Carbon Project), but its power sector is dominated by coal at roughly 62% of generation, with renewables, mainly geothermal and hydropower, near a fifth (IEA). It is the world's largest thermal coal exporter, shipping a record of about 555 million tonnes in 2024 before exports fell to about 514 million tonnes in 2025.
Pollution
Indonesia is one of the largest sources of ocean plastic, and litter is visible on many rivers and beaches. Policy is partial: Bali banned single-use plastics in 2019 and Jakarta in 2020 under a national marine-litter roadmap, but there is no comprehensive enforced national ban.
Water stress
Indonesia has abundant rainfall and major rivers across its islands, so raw freshwater supply is not the constraint. The problem is delivery and quality: the WHO/UNICEF JMP figure for safely managed drinking water is only about 30% (2024), and Jakarta suffers severe groundwater over-extraction and land subsidence.
What pollutes most here
1The gridThe share of electricity still generated from fossil fuel.84.5%
2IndustryPalm oil, coal and unregulated mining.named
3AirModelled annual mean against a WHO guideline of 5 µg/m³.20.8 µg/m³ (PM2.5)
4On the recordIndonesia is one of the largest sources of ocean plastic, and litter is visible on many rivers and beaches.
What has Indonesia promised on climate?
Net zero, whole economy2060 (via Policy Document)<br>Before 2050 (via Political Pledge)
Electricity renewable today15.5% (2021)
Land protected, against a 30% target12% by 2025
Sea protected, against a 30% target3% by 2025
The net-zero target year on file with Climate Watch is 2060 (via Policy Document) Before 2050 (via Political Pledge), status: in policy document; in political pledge. Measured against it, 15.5% of electricity is already renewable (2021, World Bank), so 84.5% of the grid is still to be converted. The pledge on file is measured here against what has actually been delivered, not taken on its own (UNFCCC NDC Registry, CBD Kunming-Montreal Target 3).
The biggest line item
One return flight against a whole year of living.
A resident's entire year2.87 t CO2e
Safe-climate budget, per year2 t CO2e
New York return, economy2.92 t CO2e
Los Angeles return, economy2.6 t CO2e
London return, economy2.11 t CO2e
Paris return, economy2.08 t CO2e
Frankfurt return, economy2 t CO2e
How much CO2 does flying to Indonesia emit?
Tap where you would fly from. One return flight, economy.
Every prompt runs on a machine in a building on somebody’s grid. What that costs the planet depends less on the prompt than on what is burning to power it. Here is what would power one in Indonesia.
Data centres
203
Registered colocation and interconnection facilities, PeeringDB, 2026
Grid renewable
18.1 %
What a machine here runs on.
What powers a data centre in Indonesia?
Almost everything a machine here consumes is burned fossil fuel.
Renewable 18.1%Fossil 81.9%
Cooling water. Every one of those halls runs on the national grid, which is 15.5% renewable today (World Bank). A data centre is only as clean as the electricity behind it, so the same figure that decides this country's climate score also decides the footprint of the AI running inside it. Cooling water use is not separately published by facility, and no operator here reports it.
The rules. Indonesia has 203 colocation and interconnection facilities on the public PeeringDB register, concentrated in Jakarta Selatan (31), Jakarta (26), Surabaya (14), alongside 80 internet exchanges (IIX-Jakarta, OpenIXP / NiCE, BIX Jakarta, C2IX). Named sites include Biznet Jakarta, PSN Networks, Datautama-NET, PadiNET Surabaya.
Where the cables land. 146 landing points · Aeng Batu Batu, Agats, Alor, Ambon
95% residents to 5% visitors across a year. 16,107,000 international arrivals in 2019 against 285,721,236 people who live here (2025, World Bank / UN Tourism).
Where a visitor dollar goes in Indonesia
4,053k
Visitors a year
0.0
Visitors per resident
How deep in debt is Indonesia?· for every $100 Indonesia earns in a year, it owes…
Pay to the order of: the creditorsmemo · the 2000 peak
$ 87The worst year on the IMF record. Indonesia owed $87 for every $100 it earned.
IMF World Economic Outlook, 2000signed, the creditors
Pay to the order of: the creditorsmemo · today
$ 42What is owed now, for every $100 of national income (2026).
IMF World Economic Outlook, 2026signed, the creditors
Pay to the order of: the creditorsmemo · projected 2031
$ 42The IMF's own forecast has this rising to $42 by 2031.
IMF World Economic Outlook projection, 2031signed, the forecast
For every $100 Indonesia earns in a year, it owes $42 (2026, IMF World Economic Outlook). The interest on that is paid before schools, clinics or coastline get their turn.
Where does a tourist dollar actually go in Indonesia?
Play one tourist dollar around the board. Every square is a measured fact from this page.
START!
1
GO: a visitor lands
$100 goes on the table. 16,107,000 international arrivals in 2019 against 285,721,236 residents, one visitor a year for every 18 residents (World Bank / UN Tourism).
$100 in play
2
The bed
Who owns the largest places to stay in Indonesia is not published in the records we can check, so this square is left open rather than guessed. Where a listing names its owner, it is shown in the ownership table below.
not published
3
The plate
Food is only 10.2% of everything Indonesia imports (2025, World Bank), so most of a meal is bought from producers inside the country. Eating what the land here actually grows, oil palm fruit, rice, sugarcane, maize, coconuts, cassava, bananas, mangoes/guavas, keeps that money with the grower.
mostly home-grown
4
The power
84.5% of the electricity is fossil (2021, World Bank). Lighting, cooling and hot water are paid for largely in imported fuel.
burns away
5
What actually stays
On the parts that can be measured, the power leaves and the plate stays. It is genuinely a coin toss, decided by what you book.
split
6
Pay the bank first
Indonesia owes $42 for every $100 it earns (IMF World Economic Outlook, 2026 projection). The interest is paid before anything else on this board.
$42 per $100
7
A spread hand
The largest single export, mineral fuels and oils, is 20.9% of the total (2024, UN Comtrade). No one shock can take the whole board.
top export 22.9%
8
Community chest
Tourism earns 2% of everything Indonesia makes from exports (2020, World Bank / UN Tourism). That is how much of the economy depends on the game continuing.
2% of exports
9
The flight
Getting here is usually the biggest single line on the bill. From New York a return economy seat is 2.92 t CO2, on the UK Government's published conversion factors. It is the one part of the trip this board cannot reduce.
2.92 t CO2
10
Back to GO
The economy turns over about US$1,540 billion a year (IMF World Economic Outlook, 2026 projection). Every lap of this board is a choice about how much of it stays.
US$1,540bn
GDPUS$1,445.6bn
Agriculture, share of GDP13.1%
Visitors a year4,053,000
Visitors per resident0
Residents~285,721,236
Agriculture
Farming is 13.1% of the economy. Indonesia is a major agricultural nation and one of the world's largest rice producers, broadly self-sufficient in its staple while importing wheat, soy and sugar.
Natural materials
Living natural-materials traditions are strong, including batik, ikat and songket weaving, rattan and bamboo craft, and banana and abaca fibre. These skills remain in daily production, not just heritage display.
Energy
Indonesia's per-capita CO2 emissions are relatively low at about 2.9 tonnes per person in 2024 (Our World in Data, Global Carbon Project), but its power sector is dominated by coal at roughly 62% of generation, with renewables, mainly geothermal and hydropower, near a fifth (IEA). It is the world's largest thermal coal exporter, shipping a record of about 555 million tonnes in 2024 before exports fell to about 514 million tonnes in 2025.
Who owns the biggest hotels in Indonesia?
By rooms · company records and press.
Komodo Resort · ~20 roomsIndependentnot published
Misool Eco Resort · ~19 roomsIndependentnot published
Mule Malu Tropical Stay · ~11 roomsIndependentnot published
Six Senses Uluwatu · ~103 roomsCorporatemixed
The Shala Bali · ~6 roomsIndependentnot published
Bali au Naturel · ~6 roomsIndependentnot published
Bambu Indah · ~20 roomsIndependentnot published
Nihi Sumba · ~28 roomsIndependentnot published
Pulau Macan Eco Lodge · ~11 roomsIndependentnot published
Amanwana · ~17 roomsCorporatenot published
Visitors, over time
201510,407k
201611,519k
201714,040k
201815,810k
201916,107k
20204,053k
International tourism receipts run at about US$3.53 billion in 2020 (World Bank / UN Tourism). That is 2% of everything the country earns from exports.
How much of your money actually stays here?
Tap the holiday you are planning.
All-inclusive resortForeign-owned hotel and tourist restaurantsLocally owned stay and local restaurantsGuesthouse, markets and public transport
Resort guest, villa renter, family, nomad or backpacker. The honest playbook for each, from the same sourced numbers.
Already booked a resort? · the rescue list
Five swaps that move your money back on-island
1. Eat where the country eats Choose kitchens cooking rice, tempeh, tofu, cassava, chilli, coconut over imported menus. The checked list →
2. Book with a local operator Never the lobby desk. The margin on a tour is the part that stays. Eco tours →
3. Stay somewhere locally owned Ownership decides where the room rate books. Eco stays →
4. Use the transport residents use Domestic flights between islands, ferries, ride-hailing apps, trains on Java
5. Buy the craft, not the souvenir Natural-materials work made here pays the maker directly; imported gifts pay a shipping line.
swipe →
First time here
Indonesia pairs some of Earth's richest rainforests and endemic wildlife with deep-rooted plant food and natural-fibre traditions, offset by heavy plastic pollution and weak forest enforcement.
Best time: Dry season
Getting around
Domestic flights between islands, ferries, ride-hailing apps, trains on Java
Transport is where the fare either stays or leaves.
Eating here
The everyday plate is rice, tempeh, tofu, cassava, chilli, coconut. Java is the birthplace of tempeh, and tofu, gado-gado, sayur and sambal make unprocessed plant eating easy and cheap.
Eating what the country grows is the cheapest way to cut the import bill.
Good to know
Cash widely used, cards in cities; IDR. Sarongs at temples; motorbike taxis (Gojek) everywhere.
Ownership is recorded here from each listing's own filings and company records. 1 of the 10 have a named owner, none of them local. That ownership line is what decides how much of a room rate stays in the country.
Society and Governance in Indonesia.
How well is Indonesia actually run?
Governance, measured · World Bank WGI
Four measured answers, none of them opinion. Averaged across corruption control, delivery and accountability, Indonesia scores 48 out of 100 (2024, World Bank Worldwide Governance Indicators). That matters here because every pledge on this page is only as good as the machinery meant to deliver it.
How well is Indonesia run? · each scored out of 100, higher is better
Clean government, scored 37 of 100
Control of corruption scores 36.8 out of 100 (2024, World Bank Worldwide Governance Indicators). That is below the halfway mark of governments measured.
37
Freedom and rights, scored 54 of 100
Voice and accountability, which measures free expression, free media and the ability to choose a government, scores 53.8 out of 100 (2024, World Bank WGI). Citizens have some room to question their government.
54
Government effectiveness, scored 55 of 100
Government effectiveness, which measures the quality of public services and how well policy is actually delivered, scores 54.8 out of 100 (2024, World Bank WGI). Delivery is rated above average.
55
Income equality, scored 34 of 100
The Gini index of income inequality reads 34.4 (2025, World Bank). Zero is perfect equality and 100 is one person holding everything. Below 40 is the level usually treated as manageable, and Indonesia sits inside it.
34
LGBTQ+ status: LowSolo female travel: Take care96% adult literacyIndustry to avoid: Palm oil, coal and unregulated mining
What is daily life in Indonesia really like? Measured
Getting around, breathing, throwing away, learning. The honest checklist.
TransportAirWaterWastePower
✓How you get around Domestic flights between islands, ferries, ride-hailing apps, trains on Java
✓Air quality, measured Modelled annual mean 20.8 µg/m³ (PM2.5). The WHO guideline is 5 µg/m³.
✓Where the air is cleanest Remote highlands and eastern islands away from cities and peat fires
·Tap water Not drinkable
✓What to drink Bottled water; brush teeth with bottled and keep your mouth closed in the shower.
✓Plastic rules No national ban; Bali (2019) and Jakarta (2020) ban single-use plastics
✓Sockets and voltage Type A/B/C, 220V (varies)
96.0%
literacy. Public spending on education runs at 1.3% of GDP and 10.6% of all government spending, and secondary enrolment stands at 97.2% gross (UNESCO Institute for Statistics, 2023 to 2025).
Made in Indonesia.
Living natural-materials traditions are strong, including batik, ikat and songket weaving, rattan and bamboo craft, and banana and abaca fibre. These skills remain in daily production, not just heritage display. Every step of processing done at home is value that stops leaving the country.
What Indonesia actually sells the world
The single biggest thing Indonesia sells the world is mineral fuels and oils, 22.9% of all exports in 2023 (about US$59.49 billion, UN Comtrade). The next four are animal and vegetable fats and oils at 11.0%, iron and steel at 10.3%, electrical machinery and electronics at 5.5%, vehicles at 4.3%.
Made now · natural materials
Batik
Worked in Indonesia from local material, and still a working craft rather than a museum piece.
Made now · natural materials
Ikat
Worked in Indonesia from local material, and still a working craft rather than a museum piece.
Made now · natural materials
Songket weaving
Worked in Indonesia from local material, and still a working craft rather than a museum piece.
Made now · natural materials
Rattan
Worked in Indonesia from local material, and still a working craft rather than a museum piece.
Made now · natural materials
Bamboo craft
Worked in Indonesia from local material, and still a working craft rather than a museum piece.
Made now · natural materials
Banana fibre
Worked in Indonesia from local material, and still a working craft rather than a museum piece.
Buys in · 14.6% of imports
Machinery and mechanical appliances
Indonesia imported US$32.64 billion of machinery and mechanical appliances in 2023, 14.6% of everything it bought abroad, and sells none of it back. Every point of that is a business that could be built at home rather than shipped in. UN Comtrade.
Buys in · 4.2% of imports
Plastics
Indonesia imported US$9.45 billion of plastics in 2023, 4.2% of everything it bought abroad, and sells none of it back. Every point of that is a business that could be built at home rather than shipped in. UN Comtrade.
Buys in · 2.9% of imports
Organic chemicals
Indonesia imported US$6.42 billion of organic chemicals in 2023, 2.9% of everything it bought abroad, and sells none of it back. Every point of that is a business that could be built at home rather than shipped in. UN Comtrade.
Buys in · 2.7% of imports
Cereals
Indonesia imported US$5.95 billion of cereals in 2023, 2.7% of everything it bought abroad, and sells none of it back. Every point of that is a business that could be built at home rather than shipped in. UN Comtrade.
The maths for an entrepreneur. Indonesia produces about US$1,446 billion a year, which is roughly US$5,060 per person (2025, World Bank). Farming is 13.1% of that, while food is 10.2% of everything the country imports. With 9.4% of the land arable, the raw material for that is already in the ground.
A living tradition of Indonesia, still practised rather than archived.
Wayang kulit shadow puppetry
A living tradition of Indonesia, still practised rather than archived.
Balinese Legong
A living tradition of Indonesia, still practised rather than archived.
Barong
A living tradition of Indonesia, still practised rather than archived.
Kecak dancesA living tradition of Indonesia, still practised rather than archived.
Saman dance of AcehA living tradition of Indonesia, still practised rather than archived.
Does Indonesia protect its heritage by law?
Partly, and the gaps say as much as the protections.
What is kept alive. Indonesia carries an exceptionally rich living heritage across its islands, from gamelan orchestras and wayang kulit shadow puppetry to the Balinese Legong, Barong and Kecak dances and the Saman dance of Aceh. Batik, kris craft and angklung music remain part of daily and ceremonial life. Living ancestral and spiritual traditions include Balinese Hindu Dharma, Javanese Kejawen, and the distinct beliefs and rites of the Toraja, Dayak and Mentawai and other indigenous peoples.
Who it belongs to. Indonesia has hundreds of living rooted cultures, from Balinese and Torajan to Dayak and Papuan communities, and community-based tourism is growing alongside conventional resorts. Craft, ceremony and village life remain central rather than staged for visitors.
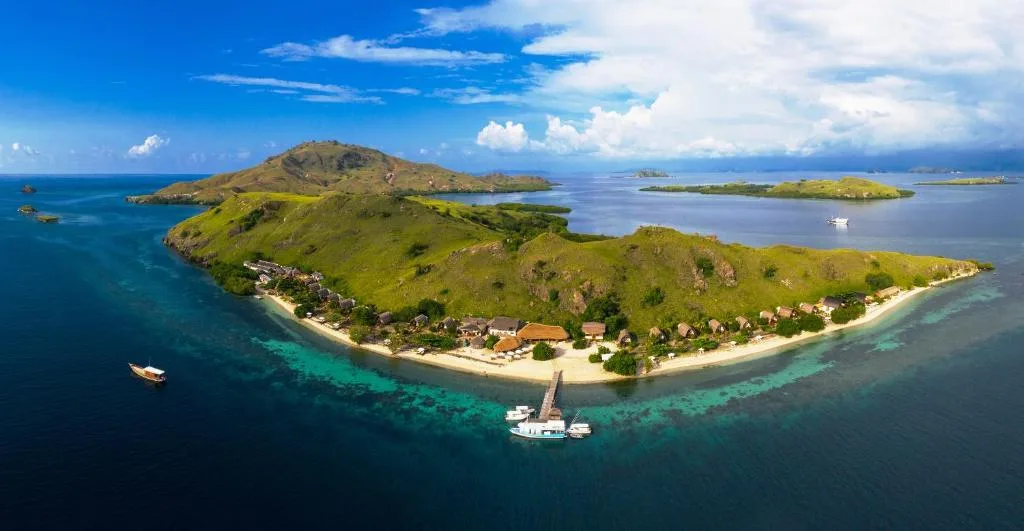
Only here. The Komodo dragon, the world's largest lizard, lives wild only in Indonesia, on four islands inside Komodo National Park and in fragmented populations on Flores outside it.
Three futures for Indonesia, every one run forward from measured data.
Where the making actually happens
Named craft workshops on the open map: A3Rajut Kerajinan Noken Lokal Kampung Urumb, Artland, Artline, Bali Oding, Blink By Kapal Laut, Dinanti Craft.
Every measured trend on one line
Run forward at the pace already recorded.
-21%
Forest cover
1995: 60.7 % → 2023: 47.7 %
-6%
Renewable electricity
1995: 16.5 % → 2021: 15.5 %
+140%
CO2 per person
1995: 1.2 t → 2024: 2.87 t
-6%
Tourist arrivals
1995: 4324 k → 2020: 4053 k
-19%
Protected land
2013: 14.8 % → 2025: 12 %
-38%
Farm workforce
1995: 44 % → 2025: 27.3 %
-9%
Protected sea
2013: 3.3 % → 2025: 3 %
+23%
Agricultural land
1995: 23.7 % → 2023: 29.1 %
+64%
Urban population
1995: 36.3 % → 2025: 59.4 %
-27%
Air pollution
1995: 28.4 µg/m³ → 2023: 20.8 µg/m³
-28%
Fresh water per person
1995: 10099.2 m³ → 2022: 7239.9 m³
+212%
Adult overweight
1995: 12.2 % → 2022: 38.1 %
+49%
Electricity access
1995: 66.9 % → 2024: 99.9 %
+400%
GDP per person
1995: 1011 → 2025: 5060
+43%
Population
1995: 199888 k → 2025: 285721 k
-60%
Renewable energy use
1995: 50.7 % → 2021: 20.2 %
+71%
Energy per person
1995: 574.8 kg → 2023: 982.4 kg
-15%
Protected area, total
2013: 6.1 % → 2025: 5.2 %
+9%
Life expectancy
1995: 65.3 yrs → 2024: 71.3 yrs
+52%
Cereal yield
1995: 3843 ha → 2023: 5829 ha
+113%
Fertiliser use
1995: 145.8 ha → 2023: 311.1 ha
-36%
Rural population
1995: 63.7 % → 2025: 40.6 %
+24%
Water productivity
1995: 4.06 $/m3 → 2022: 5.04 $/m3
+46%
Health spending
2000: 1.85 % → 2023: 2.7 %
-18%
Forest area
1995: 1099125 km2 → 2023: 903166 km2
+456%
Electric power use
1995: 259.7 kWh → 2023: 1445 kWh
+30%
Emissions: Agriculture
1990: 118.3 e → 2023: 154.2 e
-6%
Emissions: Building
1990: 32.6 e → 2023: 30.6 e
+642%
Emissions: Electricity/Heat
1990: 47.9 e → 2023: 355.2 e
+286%
Emissions: Energy
1990: 198.3 e → 2023: 765.1 e
+366%
Emissions: Industrial Processes
1990: 9.1 e → 2023: 42.4 e
+353%
Emissions: Manufacturing/Construction
1990: 28.5 e → 2023: 129.2 e
World Bank open data, recorded series
How much forest is left?
Forest cover moved from 60.7% to 47.7% across 28 recorded years.
World Bank AG.LND.FRST.ZS
How clean is the grid?
Renewable electricity moved from 16.5% to 15.5% across 26 recorded years.
World Bank EG.ELC.RNEW.ZS
How much climate pollution per person?
CO2 per person moved from 1.2 t to 2.9 t across 29 recorded years.
World Bank EN.GHG.CO2.PC.CE.AR5
How many people visit?
Tourist arrivals moved from 4324k to 4053k across 25 recorded years.
World Bank ST.INT.ARVL
How much land is protected?
Protected land moved from 14.8% to 12.0% across 12 recorded years.
World Bank ER.LND.PTLD.ZS
How many people still farm?
Farm workforce moved from 44.0% to 27.3% across 30 recorded years.
World Bank SL.AGR.EMPL.ZS
How much sea is protected?
Protected sea moved from 3.3% to 3.0% across 12 recorded years.
World Bank ER.MRN.PTMR.ZS
How much land is farmed?
Agricultural land moved from 23.7% to 29.1% across 28 recorded years.
World Bank AG.LND.AGRI.ZS
How fast is it urbanising?
Urban population moved from 36.3% to 59.4% across 30 recorded years.
World Bank SP.URB.TOTL.IN.ZS
Is the air getting cleaner?
Air pollution moved from 28.4 µg/m³ to 20.8 µg/m³ across 28 recorded years.
World Bank EN.ATM.PM25.MC.M3
Is water getting scarcer?
Fresh water per person moved from 10099.2 m³ to 7239.9 m³ across 27 recorded years.
World Bank ER.H2O.INTR.PC
Is diet-related disease rising?
Adult overweight moved from 12.2% to 38.1% across 27 recorded years.
World Bank SH.STA.OWAD.ZS
Who has power?
Electricity access moved from 66.9% to 99.9% across 29 recorded years.
World Bank EG.ELC.ACCS.ZS
Is income rising?
GDP per person moved from 1011 to 5060 across 30 recorded years.
World Bank NY.GDP.PCAP.CD
How fast is it growing?
Population moved from 199888k to 285721k across 30 recorded years.
World Bank SP.POP.TOTL
What share of all energy is renewable?
Renewable energy use moved from 50.7% to 20.2% across 26 recorded years.
World Bank EG.FEC.RNEW.ZS
How much energy does one person use?
Energy per person moved from 574.76 kg to 982.41 kg across 28 recorded years.
World Bank EG.USE.PCAP.KG.OE
How much land and sea is protected together?
Protected area, total moved from 6.1% to 5.2% across 12 recorded years.
World Bank ER.PTD.TOTL.ZS
How long do people live?
Life expectancy moved from 65.26 yrs to 71.29 yrs across 29 recorded years.
World Bank SP.DYN.LE00.IN
How much does a hectare of cereal produce?
Cereal yield moved from 3843 kg/ha to 5829 kg/ha across 28 recorded years.
World Bank AG.YLD.CREL.KG
How much fertiliser goes on the land?
Fertiliser use moved from 145.84 kg/ha to 311.07 kg/ha across 28 recorded years.
World Bank AG.CON.FERT.ZS
How many people still live rurally?
Rural population moved from 63.7% to 40.61% across 30 recorded years.
World Bank SP.RUR.TOTL.ZS
How much value per cubic metre of water?
Water productivity moved from 4.06 $/m3 to 5.04 $/m3 across 27 recorded years.
World Bank ER.GDP.FWTL.M3.KD
How much goes on health?
Health spending moved from 1.85% to 2.7% across 23 recorded years.
World Bank SH.XPD.CHEX.GD.ZS
How much forest is there in total?
Forest area moved from 1099125 km2 to 903166 km2 across 28 recorded years.
World Bank AG.LND.FRST.K2
How much electricity per person?
Electric power use moved from 259.72 kWh to 1445 kWh across 28 recorded years.
World Bank EG.USE.ELEC.KH.PC
How have agriculture emissions moved?
Agriculture emissions moved from 118.25 to 154.2 MtCO2e across 33 recorded years.
Climate Watch (WRI), historical emissions
How have building emissions moved?
Building emissions moved from 32.64 to 30.57 MtCO2e across 33 recorded years.
Climate Watch (WRI), historical emissions
How have electricity/heat emissions moved?
Electricity/Heat emissions moved from 47.87 to 355.2 MtCO2e across 33 recorded years.
Climate Watch (WRI), historical emissions
How have energy emissions moved?
Energy emissions moved from 198.33 to 765.05 MtCO2e across 33 recorded years.
Climate Watch (WRI), historical emissions
How have industrial processes emissions moved?
Industrial Processes emissions moved from 9.1 to 42.37 MtCO2e across 33 recorded years.
Climate Watch (WRI), historical emissions
How have manufacturing/construction emissions moved?
Manufacturing/Construction emissions moved from 28.49 to 129.18 MtCO2e across 33 recorded years.
Climate Watch (WRI), historical emissions
Worst caseCurrent pathBest case
Worst case
Every measured decline continues at the pace already recorded. The weakest pillar, energy at 2/5, is the one that gives way first.
Computed from: recorded series extended with no policy change
Current path
Every line above is a recorded World Bank series for this country. The current path is simply those series continuing at the pace already measured.
Computed from: recorded series, no policy change assumed
Best case
The pledges are met on their own stated timetables and the weakest pillars are lifted to match the strongest. Indonesia already shows it can do this: wildlife scores 5/5.
Computed from: each published target delivered on its own date
What the best case actually asks for
Lift energy
It scores 2 out of 5 today, among the weakest parts of Indonesia's record. Indonesia's per-capita CO2 emissions are relatively low at about 2.9 tonnes per person in 2024 (Our World in Data, Global Carbon Project), but its power sector is dominated by coal at roughly 62% of generation, with renewables, mainly geothermal and hydropower, near a fifth (IEA). It is the world's largest thermal coal exporter, shipping a record of about 555 million tonnes in 2024 before exports fell to about 514 million tonnes in 2025. The country has pledged net-zero by 2060 and signed a Just Energy Transition Partnership intended to bring coal decline forward. The heavy coal dependence and export role weigh against its low per-capita figure. Lifting it toward the 5/5 the strongest pillars already reach is what the best case turns on.
measured each year
Costs: spending and enforcement, not new technology
Lift organic farming
It scores 2 out of 5 today, among the weakest parts of Indonesia's record. Certified organic land is about 0.1% of agricultural area (FiBL, 2024 data), among the lowest shares measured, even though much smallholder farming is low-input by default. Lifting it toward the 5/5 the strongest pillars already reach is what the best case turns on.
measured each year
Costs: spending and enforcement, not new technology
Lift pollution
It scores 2 out of 5 today, among the weakest parts of Indonesia's record. Indonesia is one of the largest sources of ocean plastic, and litter is visible on many rivers and beaches. Policy is partial: Bali banned single-use plastics in 2019 and Jakarta in 2020 under a national marine-litter roadmap, but there is no comprehensive enforced national ban. Ambient PM2.5 averages about 21 µg/m³ (World Bank, 2023). Lifting it toward the 5/5 the strongest pillars already reach is what the best case turns on.
measured each year
Costs: spending and enforcement, not new technology
Government and Goals in Indonesia.
Who is in charge of Indonesia now · Office-holders from the UN Protocol and Liaison Service public list of Heads of State and Heads of Government, 8 September 2026. Legislature and election dates from IFES ElectionGuide. Constitution dates from the Constitute Project. Governance scores from the World Bank Worldwide Governance Indicators 2024.
Prabowo Subianto
President
Prabowo Subianto is the head of government of Indonesia, in office since 20 October 2024. Every climate, protection and energy pledge on this page is delivered, or not, under this administration.
Public opinion, measured
Voice and accountability, the freedom to question government: 53.8 / 100. Above the halfway mark of governments measured. World Bank WGI 2024
Control of corruption: 36.8 / 100. Below the halfway mark of governments measured. World Bank WGI 2024
Political stability and absence of violence: 55.5 / 100. Above the halfway mark of governments measured. World Bank WGI 2024
Rule of law: 53.4 / 100. Above the halfway mark of governments measured. World Bank WGI 2024
Regulatory quality: 56.8 / 100. Above the halfway mark of governments measured. World Bank WGI 2024
Prabowo SubiantoPresident
House of Representatives (Dewan Perwakilan Rakyat)Legislature, unicameral
Last election14 February 2024
Constitution1945, as revised to 2002
Government typepresidential republic
Indonesia national goals: climate commitments on record · as recorded by Climate Watch, World Resources Institute
2060
Net zero
In Policy Document; In Political Pledge
Net-zero target as recorded by Climate Watch. Status: In Policy Document (9/23/2022); In Political Pledge (11/20/2024) ↗
The questions people actually type, answered in full sentences from the sourced data above.
swipe →
Is Indonesia sustainable?
Indonesia scores 67 out of 100 on the Throne Eco Index, across twelve equally weighted pillars. Indonesia pairs some of Earth's richest rainforests and endemic wildlife with deep-rooted plant food and natural-fibre traditions, offset by heavy plastic pollution and weak forest enforcement.
Is the water in Indonesia safe and plentiful?
Indonesia has abundant rainfall and major rivers across its islands, so raw freshwater supply is not the constraint. The problem is delivery and quality: the WHO/UNICEF JMP figure for safely managed drinking water is only about 30% (2024), and Jakarta suffers severe groundwater over-extraction and land subsidence. Tap water is not safe to drink and most residents boil or buy it.
Can Indonesia feed itself?
Indonesia is a major agricultural nation and one of the world's largest rice producers, broadly self-sufficient in its staple while importing wheat, soy and sugar. Smallholder farming, home gardens and wet-rice terraces remain widespread across Java, Sumatra and Bali.
Is it easy to eat plant-based in Indonesia?
Java is the birthplace of tempeh, and tofu, gado-gado, sayur and sambal make unprocessed plant eating easy and cheap. Vegetables and legumes are central to everyday meals, though fish and meat feature widely.
How much of Indonesia is actually protected?
Terrestrial protected areas cover about 12% and marine areas about 3% (World Bank, 2025), including flagship parks such as Komodo, Lorentz and Gunung Leuser. Coverage sits in the middle band, but enforcement is uneven and clearing for palm oil and mining continues inside and around reserves.
What wildlife is left in Indonesia?
Indonesia is one of a handful of megadiverse countries, home to orangutans, Komodo dragons, Sumatran tigers, rhinos and elephants, and thousands of endemic birds and plants. Endemism is exceptionally high across Sumatra, Borneo, Sulawesi and Papua.
Is Indonesia on clean energy?
Indonesia's per-capita CO2 emissions are relatively low at about 2.9 tonnes per person in 2024 (Our World in Data, Global Carbon Project), but its power sector is dominated by coal at roughly 62% of generation, with renewables, mainly geothermal and hydropower, near a fifth (IEA). It is the world's largest thermal coal exporter, shipping a record of about 555 million tonnes in 2024 before exports fell to about 514 million tonnes in 2025. The country has pledged net-zero by 2060 and signed a Just Energy Transition Partnership intended to bring coal decline forward.
How polluted is Indonesia?
Indonesia is one of the largest sources of ocean plastic, and litter is visible on many rivers and beaches. Policy is partial: Bali banned single-use plastics in 2019 and Jakarta in 2020 under a national marine-litter roadmap, but there is no comprehensive enforced national ban. Ambient PM2.5 averages about 21 µg/m³ (World Bank, 2023).
Does recycling work in Indonesia?
Formal municipal recycling is minimal, well below the level needed for a higher band, though an active informal waste-picker sector recovers plastics, metal and paper for resale.
Is the farming in Indonesia organic?
Certified organic land is about 0.1% of agricultural area (FiBL, 2024 data), among the lowest shares measured, even though much smallholder farming is low-input by default.
Are there natural materials and craft in Indonesia?
Living natural-materials traditions are strong, including batik, ikat and songket weaving, rattan and bamboo craft, and banana and abaca fibre. These skills remain in daily production, not just heritage display.
Is there living culture in Indonesia?
Indonesia has hundreds of living rooted cultures, from Balinese and Torajan to Dayak and Papuan communities, and community-based tourism is growing alongside conventional resorts. Craft, ceremony and village life remain central rather than staged for visitors.
What heritage does Indonesia keep alive?
Indonesia carries an exceptionally rich living heritage across its islands, from gamelan orchestras and wayang kulit shadow puppetry to the Balinese Legong, Barong and Kecak dances and the Saman dance of Aceh. Batik, kris craft and angklung music remain part of daily and ceremonial life. Living ancestral and spiritual traditions include Balinese Hindu Dharma, Javanese Kejawen, and the distinct beliefs and rites of the Toraja, Dayak and Mentawai and other indigenous peoples.
So is Indonesia actually green? The measured answer
What is working: the record is thin on the headline measures, and the sourced numbers below say why.
What is not: land protected at 12% against a 30% mark, sea protected at 3% against a 30% mark, renewable electricity at 15.5% against a 100% mark.
Indonesia sits 50 of 77 at 65/100. Every name links to its own destination page, built exactly like this one. The full ranking →
What is Indonesia particularly good at?
✓Heritage, scored 5/5. Indonesia carries an exceptionally rich living heritage across its islands, from gamelan orchestras and wayang kulit shadow puppetry to the Balinese Legong, Barong and Kecak dances and the Saman dance of Aceh. Batik, kris craft and angklung music remain part of daily and ceremonial life. Living ancestral and spiritual traditions include Balinese Hindu Dharma, Javanese Kejawen, and the distinct beliefs and rites of the Toraja, Dayak and Mentawai and other indigenous peoples. These traditions are practised widely and continuously.
✓Wildlife, scored 5/5. Indonesia is one of a handful of megadiverse countries, home to orangutans, Komodo dragons, Sumatran tigers, rhinos and elephants, and thousands of endemic birds and plants. Endemism is exceptionally high across Sumatra, Borneo, Sulawesi and Papua.
✓Culture, scored 4/5. Indonesia has hundreds of living rooted cultures, from Balinese and Torajan to Dayak and Papuan communities, and community-based tourism is growing alongside conventional resorts. Craft, ceremony and village life remain central rather than staged for visitors.
Where does Indonesia score worst?
✕Organic farming, scored 2/5. Certified organic land is about 0.1% of agricultural area (FiBL, 2024 data), among the lowest shares measured, even though much smallholder farming is low-input by default.
✕Pollution, scored 2/5. Indonesia is one of the largest sources of ocean plastic, and litter is visible on many rivers and beaches. Policy is partial: Bali banned single-use plastics in 2019 and Jakarta in 2020 under a national marine-litter roadmap, but there is no comprehensive enforced national ban. Ambient PM2.5 averages about 21 µg/m³ (World Bank, 2023).
✕Recycling, scored 2/5. Formal municipal recycling is minimal, well below the level needed for a higher band, though an active informal waste-picker sector recovers plastics, metal and paper for resale.
Similar countries doing it better and worse
Sri LankaScored on the same twelve pillars as Indonesia.75
IndiaScored on the same twelve pillars as Indonesia.72
ThailandScored on the same twelve pillars as Indonesia.67
MongoliaScored on the same twelve pillars as Indonesia.58
JordanScored on the same twelve pillars as Indonesia.50
MaldivesScored on the same twelve pillars as Indonesia.42
A note from the lens of mother natureswipe →
Energy, 2/5
Indonesia's per-capita CO2 emissions are relatively low at about 2.9 tonnes per person in 2024 (Our World in Data, Global Carbon Project), but its power sector is dominated by coal at roughly 62% of generation, with renewables, mainly geothermal and hydropower, near a fifth (IEA). It is the world's largest thermal coal exporter, shipping a record of about 555 million tonnes in 2024 before exports fell to about 514 million tonnes in 2025.
Consequence: It is among the lowest-scoring parts of Indonesia's record, so it is where the score moves first.
Food and farming, 4/5
Indonesia is a major agricultural nation and one of the world's largest rice producers, broadly self-sufficient in its staple while importing wheat, soy and sugar. Smallholder farming, home gardens and wet-rice terraces remain widespread across Java, Sumatra and Bali.
Heritage, 5/5
Indonesia carries an exceptionally rich living heritage across its islands, from gamelan orchestras and wayang kulit shadow puppetry to the Balinese Legong, Barong and Kecak dances and the Saman dance of Aceh. Batik, kris craft and angklung music remain part of daily and ceremonial life.
The Indonesia Directory.
Everything on Hold The Throne that sits in Indonesia, checked and listed.
World Bank Worldwide Governance Indicators, 2024. Percentile among all governments measured.
Government effectiveness
54.8 / 100
World Bank Worldwide Governance Indicators, 2024. Percentile among all governments measured.
Rule of law
53.4 / 100
World Bank Worldwide Governance Indicators, 2024. Percentile among all governments measured.
Political stability
55.5 / 100
World Bank Worldwide Governance Indicators, 2024. Percentile among all governments measured.
Voice and accountability
53.8 / 100
World Bank Worldwide Governance Indicators, 2024. Percentile among all governments measured.
Environmental Performance Index
33.6 / 100 · 163 of 180
Yale Environmental Performance Index 2024, ranked 163 of 180 countries assessed.
Ecosystem vitality
38.9 / 100 · 147 of 180
Yale Environmental Performance Index 2024, ranked 147 of 180 countries assessed.
Biodiversity and habitat
30.7 / 100 · 143 of 180
Yale Environmental Performance Index 2024, ranked 143 of 180 countries assessed.
Air pollution
46.2 / 100 · 148 of 180
Yale Environmental Performance Index 2024, ranked 148 of 180 countries assessed.
Terrestrial biomes protected
38.2 / 100 · 116 of 180
Yale Environmental Performance Index 2024, ranked 116 of 180 countries assessed.
Marine protected areas
96.1 / 100 · 44 of 131
Yale Environmental Performance Index 2024, ranked 44 of 131 countries assessed.
How Indonesia Is Scored. The Throne Standard.
Every destination on the index is scored the same way, so a 4 in Barbados means exactly what a 4 means in Iceland. No self-declared data and no brochure claims are accepted. Every figure on this page carries its named source and year, and the history on each page names what empire took as plainly as it scores the present.
The 12 pillars every destination is scored on, equally weighted
01
Conservation
Land and sea actually protected, not pledged
02
Wildlife
What survives, what is endemic, what is lost
03
Water
Fresh water per person, and the ocean’s health
04
Food & farming
Whether the place can feed itself
05
Organic & clean
Certified land and pesticide reality
06
Climate & energy
Emissions per person, how the grid is powered
07
Waste
Where the rubbish goes, what comes back
08
Health
What people eat and die of
09
Heritage
Living culture, and what the law keeps standing
10
Ownership
Who owns the economy, how much of a dollar stays
11
Governance
Freedom, honesty, promises kept
12
Future
Measured trends run forward, pledges against pace
What each 0 to 5 pillar score means, in plain words
The institutions above are the ones cited on this page, ranked by how many of its figures they carry. This same sectioned page renders for all 77 scored destinations, each with its own researched history, comparison charts and three-way future. Read the full methodology
Every figure on this page, and where it came from: 76 sources across 31 institutions
World Bank17 FIGURES
Forest area (% of land area) AG.LND.FRST.ZS, 2023 check
Terrestrial protected areas (% of total land area) ER.LND.PTLD.ZS, 2025 check
Marine protected areas (% of territorial waters) ER.MRN.PTMR.ZS, 2025 check
Renewable electricity output (% of total electricity output) EG.ELC.RNEW.ZS, 2021 check
PM2.5 air pollution, mean annual exposure (µg/m³) EN.ATM.PM25.MC.M3, 2023 check
CO2 emissions per capita EN.GHG.CO2.PC.CE.AR5, 2024 check
Food import share left blank: no reliably comparable import-dependency figure verified.
Record was 2024 at about 555 Mt; 2025 exports fell to about 514 Mt check
Four island populations inside the park plus fragmented populations on Flores, outside it check
Jakarta Governor Regulation No. 142 of 2019 on the compulsory use of environmentally friendly shopping bags in shopping centres, supermarkets and traditional markets, JDIH Provinsi DKI Jakarta (Jakarta provincial legal documentation network), Policy is partial: Bali banned single-use plastics in 2019 and Jakarta in 2020 under a national marine-litter check
Jakarta Governor Regulation No. 142 of 2019 on the compulsory use of environmentally friendly shopping bags in shopping centres, supermarkets and traditional markets, JDIH Provinsi DKI Jakarta (Jakarta provincial legal documentation network) corroboration check
Jakarta Governor Regulation No. 142 of 2019 on the compulsory use of environmentally friendly shopping bags in shopping centres, supermarkets and traditional markets, JDIH Provinsi DKI Jakarta (Jakarta provincial legal documentation network) corroboration check
Aprilzal5 FIGURES
'Sejarah Untuk Mendapatkan Pengakuan Kedaulatan Republik Indonesia', Jurnal Pendidikan Sejarah, Universitas Negeri Jakarta, 2023, Independence was declared in 1945 and recognised in 1949, and thirty-two years of authoritarian rule ended wit check
'Sejarah Untuk Mendapatkan Pengakuan Kedaulatan Republik Indonesia', Jurnal Pendidikan Sejarah, Universitas Negeri Jakarta, 2023 corroboration check
'Sejarah Untuk Mendapatkan Pengakuan Kedaulatan Republik Indonesia', Jurnal Pendidikan Sejarah, Universitas Negeri Jakarta, 2023 corroboration check
'Sejarah Untuk Mendapatkan Pengakuan Kedaulatan Republik Indonesia', Jurnal Pendidikan Sejarah, Universitas Negeri Jakarta, 2023 corroboration check
'Sejarah Untuk Mendapatkan Pengakuan Kedaulatan Republik Indonesia', Jurnal Pendidikan Sejarah, Universitas Negeri Jakarta, 2023 corroboration check
GBIF occurrence search5 FIGURES
Indonesia, IUCN Red List category Critically Endangered, class Mammalia, Critically Endangered on the IUCN Red List, and recorded in Indonesia in GBIF occurrence data (mammal). check
Indonesia, IUCN Red List category Critically Endangered, class Mammalia corroboration check
Indonesia, IUCN Red List category Critically Endangered, class Aves, Critically Endangered on the IUCN Red List, and recorded in Indonesia in GBIF occurrence data (bird). check
Indonesia, IUCN Red List category Critically Endangered, order Testudines, Critically Endangered on the IUCN Red List, and recorded in Indonesia in GBIF occurrence data (turtle). check
Indonesia, IUCN Red List category Critically Endangered, all taxa, Critically Endangered on the IUCN Red List, and recorded in Indonesia in GBIF occurrence data (species). check
FAOSTAT4 FIGURES
Production: Crops and livestock products (Food and Agriculture Organization of the United Nations), Indonesia is a major agricultural nation and one of the world's largest rice producers, broadly self-sufficien check
Production: Crops and livestock products (Food and Agriculture Organization of the United Nations) corroboration check
Production: Crops and livestock products (Food and Agriculture Organization of the United Nations) corroboration check
Production: Crops and livestock products (Food and Agriculture Organization of the United Nations) corroboration check
UNESCO Institute for Statistics4 FIGURES
public data API (indicator XGDP.FSGOV, government expenditure on education as a percentage of GDP), Public spending on education runs at 1.3% of GDP and 10.6% of all government spending, and secondary enrolment check
public data API (indicator XGDP.FSGOV, government expenditure on education as a percentage of GDP) corroboration check
public data API (indicator XGDP.FSGOV, government expenditure on education as a percentage of GDP) corroboration check
public data API (indicator XGDP.FSGOV, government expenditure on education as a percentage of GDP) corroboration check
BirdLife International, IUCN and UNEP-WCMC3 FIGURES
UN SDG Global Database, terrestrial Key Biodiversity Areas covered by protected areas (%) ER_PTD_TERR, Indonesia, 2025 (26.3%), country-reported check
UN SDG Global Database, marine Key Biodiversity Areas covered by protected areas (%) ER_MRN_MPA, Indonesia, 2025 (25.9%), country-reported check
UN SDG Global Database, freshwater Key Biodiversity Areas covered by protected areas (%) ER_PTD_FRHWTR, Indonesia, 2025 (38.0%), country-reported check
Convention on Biological Diversity3 FIGURES
Kunming-Montreal Global Biodiversity Framework, Target 3, The 30x30 target is 30% by 2030, so 27 percentage points are still to be designated. check
Kunming-Montreal Global Biodiversity Framework, Target 3 corroboration check
Kunming-Montreal Global Biodiversity Framework, Target 3 corroboration check
FAO, Global Forest Resources Assessment3 FIGURES
UN SDG Global Database, forest area (% of land area) AG_LND_FRST, Indonesia, 2025 (50.7%), country-reported check
UN SDG Global Database, forest area under a long-term management plan (%) AG_LND_FRSTMGT, Indonesia, 2025 (18.5%), country-reported check
UN SDG Global Database, forest area inside legally established protected areas (%) AG_LND_FRSTPRCT, Indonesia, 2025 (54.5%), country-reported check
Meijer3 FIGURES
van Emmerik, van der Ent, Schmidt and Lebreton, 'More than 1000 rivers account for 80% of global riverine plastic emissions into the ocean', Science Advances, 2021 (open access full text), Indonesia is one of the largest sources of ocean plastic, and litter is visible on many rivers and beaches. check
van Emmerik, van der Ent, Schmidt and Lebreton, 'More than 1000 rivers account for 80% of global riverine plastic emissions into the ocean', Science Advances, 2021 (open access full text) corroboration check
van Emmerik, van der Ent, Schmidt and Lebreton, 'More than 1000 rivers account for 80% of global riverine plastic emissions into the ocean', Science Advances, 2021 (open access full text) corroboration check
Oktaviana3 FIGURES
Joannes-Boyau, Hakim, Burhan, Sardi, Adhityatama, Hamrullah, Sumantri et al., 'Narrative cave art in Indonesia by 51,200 years ago', Nature, 3 July 2024, On Sulawesi, a painted scene at Leang Karampuang showing figures and a pig has been dated to around 51,200 yea check
Joannes-Boyau, Hakim, Burhan, Sardi, Adhityatama, Hamrullah, Sumantri et al., 'Narrative cave art in Indonesia by 51,200 years ago', Nature, 3 July 2024 corroboration check
Joannes-Boyau, Hakim, Burhan, Sardi, Adhityatama, Hamrullah, Sumantri et al., 'Narrative cave art in Indonesia by 51,200 years ago', Nature, 3 July 2024 corroboration check
20.9% of exports in 2024 (US$55.53bn of US$266.32bn)1 FIGURE
Heads of State, Heads of Government and Ministers for Foreign Affairs, public list dated 8 September 2026 check
UNESCO Intangible Cultural Heritage1 FIGURE
Indonesia (batik, wayang, angklung, Saman dance, kris, gamelan). check
UNESCO World Heritage Centre1 FIGURE
Komodo National Park, Outstanding Universal Value statement, The Komodo dragon, the world's largest lizard, lives wild only in Indonesia (Komodo National Park) check
WHO/UNICEF JMP1 FIGURE
World Bank, People using safely managed drinking water services (% of population) SH.H2O.SMDW.ZS, 2024 check
WHO/UNICEF Joint Monitoring Programme1 FIGURE
UN SDG Global Database, population using safely managed drinking water (%) SH_H2O_SAFE, Indonesia, 2024 (30.5%), modelled estimate check

 Sri LankaScored on the same twelve pillars as Indonesia.75
 IndiaScored on the same twelve pillars as Indonesia.72
 ThailandScored on the same twelve pillars as Indonesia.67
 MongoliaScored on the same twelve pillars as Indonesia.58
 JordanScored on the same twelve pillars as Indonesia.50
 MaldivesScored on the same twelve pillars as Indonesia.42