Destinations › Asia · The Destination Index · universal template · every figure sourced

Palestine.

The West Bank and the Gaza Strip, 6,025 sq km of land, 64.93% of it agricultural and 87.38% of the people urban. Six World Heritage sites and nine inscribed living traditions.
Region · Asia Population · 5.6 million at the end of 2025, 3.43 million in the West Bank and 2.13 million in Gaza (Palestinian Central Bureau of Statistics). The World Bank estimates 5,413,596 for 2025. Both are given because the national bureau and the World Bank series do not agree. Languages · Arabic. Adult literacy is 97.94% (World Bank, 2024). Eco Index · 67/100 · Passable
64.93% agricultural land · 5.6 million residents (PCBS, end 2025)

Palestine at a Glance.

The score, and the four numbers that set the tone. 12 equally-weighted pillars, every pillar sourced.
Compare with:
Eco IndexPassable
67/100
12 pillars, all sourced, scored below All 77 ranked →
Renewable power
24%
of electricity
Food imported
31%
of dietary energy
The Eco Index across 12 pillars · scored 0 to 5 · World Bank, OWID, WHO/UNICEF JMP, FiBL, Protected Planet, IUCN, UNESCO (2023-24)
Conservation
Wildlife
Water
Food & farming
Organic & clean
Climate & energy
Waste
Health
Heritage
Ownership
Governance
Future

The History of Palestine.

A settlement stood at the spring beside Jericho in the ninth millennium BC, fortified, and UNESCO inscribed it in 2023. The modern record runs through the Nakba of 1948 and, since 2012, six World Heritage inscriptions and nine entries on the intangible heritage lists.
Where the name comes from
A settlement stood at the spring beside Jericho in the ninth millennium BC, inscribed by UNESCO in 2023 as Ancient Jericho, Tell es-Sultan.
The West Bank and the Gaza Strip, 6,025 sq km of land in total (World Bank, 2023). 87.38% of people live in urban areas (World Bank, 2025).
The timeline
9th millennium BC
Tell es-Sultan.
A permanent settlement emerges at the spring beside ancient Jericho, with fortification walls, a tower and trenches. UNESCO inscribed it in 2023 as Ancient Jericho/Tell es-Sultan, among the earliest fortified settlements known anywhere.
1948
The Nakba.
The Palestinian Central Bureau of Statistics records the population of historic Palestine at 1.36 million in 1948 and tracks the dispersal that followed. About 5.6 million Palestinians live in the State of Palestine today, 3.43 million in the West Bank and 2.13 million in Gaza.
2008 onward
Nine practices inscribed.
UNESCO inscribes nine Palestinian practices on the intangible heritage lists, beginning with the Hikaye storytelling tradition in 2008 and running through embroidery and Arabic calligraphy in 2021, the date palm in 2022, metal engraving and Dabkeh in 2023, Nabulsi soap making and henna in 2024, and Arabic kohl in 2025.
2012
Bethlehem, the first inscription.
The Birthplace of Jesus, the Church of the Nativity and the Pilgrimage Route in Bethlehem becomes the first site inscribed on the World Heritage List under the State of Palestine.
2014
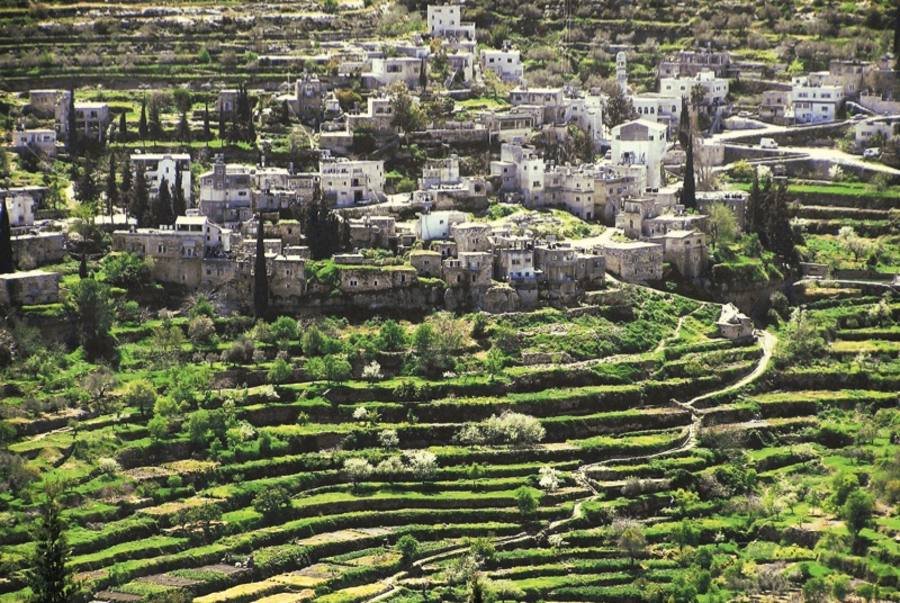
The terraces of Battir.
Palestine: Land of Olives and Vines, the cultural landscape of southern Jerusalem at Battir, is inscribed. It is the rare listing that protects a farming system rather than a monument, the stone terraces and irrigation that grow the olives and vines.
2025
Sebastia, the sixth site.
Sebastia is inscribed, bringing Palestine to six World Heritage sites alongside Bethlehem, Battir, the Old City of Hebron, Ancient Jericho and Tell Umm el-Amr, the monastery of Saint Hilarion.

Nature and Biodiversity in Palestine.

Forest cover is 1.68% and 87.38% of people live in urban areas (World Bank, 2023 and 2025). Protected areas cover 10% of the land and none of the sea (World Bank, 2025). The living landscape here is farmed rather than wild: terraces, olives and vines.
Nature
How protected is nature in Palestine?
Forest cover1.68%
Terrestrial protected area10%
Marine protected area0%
21 listed as threatened.
Species to know
Recorded in Palestine and named in the open record. Endemic status is stated per species, not implied by this list.
Ammoperdix heyi
Sand partridge. Recorded in Palestine in specimen-backed records held by GBIF.
Am
Levantina spiriplana
A land snail of the Levant. Recorded in Palestine in specimen-backed records held by GBIF.
Le
Helix engaddensis
A land snail first described from the region in 1852. Recorded in Palestine in specimen-backed records held by GBIF.
He
Recorded in Palestine and named in the open record via GBIF, from specimen-backed records. Endemic status is stated per species, not implied by this list.
Who is putting it back
A World Heritage cultural landscape protecting terraces, irrigation and the farming system itself, inscribed 2014.
Inscribed 2023, a settlement at the spring dating to the ninth millennium BC.
Inscribed 2025, the sixth World Heritage site.

Water and Ocean in Palestine.

About 165 cubic metres of renewable internal freshwater per person, with 41.23% of the resource already withdrawn (World Bank, 2021). That is severe water stress on the UN scale, and it is the single binding constraint on everything else.
Water
Groundwater and piped supply. 80.64% of people are on safely managed drinking water (World Bank, 2024), with only about 165 cubic metres per person of renewable resources.
How much fresh water does Palestine have, per person?
165
Palestine
1,000 m³
the UN “water scarce” line
41.23% of renewable freshwater is already withdrawn (World Bank, 2021), which the UN classes as severe stress.
How hard is the water supply being pushed?
Of every 10 buckets nature refills, 4 are already taken.
How much fresh water does Palestine actually have?
About 165 cubic metres of renewable internal freshwater per person, among the lowest figures anywhere (World Bank, 2021).

Food and Drink in Palestine.

Olives take 85% of the horticultural tree area and horticultural trees are 61.7% of all cropped land (PCBS, 2020/21). The diet follows the land: olive oil, pulses, wheat and vegetables. Adult obesity is 68.8% (World Bank, 2022).
Where does the food in Palestine come from?
30.9% imported
On the plate: Olive oil, wheat, pulses, za'atar, vegetables
How often each food is on the plate
Share of people eating each one regularly. These overlap, so they do not add up to 100%.
Olive oil85%
Wheat and bread60%
Pulses45%
3 of 10
bites are imported
The island buys in more food energy than it eats. The green slice is roughly what still grows here.
What is killing people in Palestine? The imported diet.
Cause of death, and the diet behind it.
Non-communicable diseases, all combined18.3%
Diabetes15.5%
Adults living with overweight or obesity. 68.8%.
Can Palestine feed itself?
7.0%
Arable land
64.9%
Agricultural land
5.5%
Agriculture, share of GDP
Harvest: Olives in October and November
Water first
41.23% of renewable freshwater is already withdrawn against 165 cubic metres per person (World Bank, 2021).
One dominant crop
Olives take 85% of the horticultural tree area, and horticultural trees are 61.7% of all cropped land (PCBS, 2020/21).
Organic is unmeasured
PCBS publishes no national certified organic area, so the sector cannot be scored on evidence.
Why the organic number looks like that. PCBS publishes no national certified organic area, so the organic sector is not formally measured. The olive terraces are rain-fed rather than irrigated intensive systems, which is a low input base.

Climate and Energy in Palestine.

Renewables supplied 24.46% of electricity in 2021 against 75.54% fossil (World Bank), a notably high renewable share for the region, and 15.4% of total final energy consumption (World Bank, 2022). Access to electricity is 100% (World Bank, 2024).
What powers Palestine?
Renewable 24.5%Fossil 75.5%
Water
About 165 cubic metres of renewable freshwater per person with 41.23% already withdrawn (World Bank, 2021), which is severe stress.
The terraces
Olives are 85% of the horticultural tree area (PCBS, 2020/21) and are rain-fed. A drying trend hits the crop and the World Heritage landscape together.
Waste
Collection reaches 79% of households but recycling is left largely to private operators rather than the joint service councils.
What pollutes most here
Water abstraction
Untreated waste
Fossil electricity

AI and Data Centres in Palestine.

Every prompt runs on a machine in a building on somebody’s grid. What that costs the planet depends less on the prompt than on what is burning to power it. Here is what would power one in Palestine.
Grid renewable
24.5 %
What a machine here runs on.
What powers a data centre in Palestine?
Almost everything a machine here consumes is burned fossil fuel.
Renewable 24.5%Fossil 75.5%

Economy and Tourism in Palestine.

5.6 million residents at the end of 2025 (PCBS), 3.43 million in the West Bank and 2.13 million in Gaza. 87.38% live in urban areas (World Bank, 2025).
Economy and tourism
93k
Visitors a year
GDPUS$17.2 bn (2025)
Agriculture, forestry and fishing5.52% of GDP (2024)
Agricultural land64.93% of land area (2023)
Freshwater withdrawn41.23% of renewable resources (2021)
Olives
575,200 dunums under olives, 85% of the horticultural tree area (PCBS, 2020/21). The crop feeds both the kitchen and the export trade.
Agriculture
5.52% of GDP and 6.34% of employment (World Bank, 2024 and 2022) on 64.93% agricultural land.
Heritage
Six World Heritage sites and nine inscribed living traditions on 6,025 square kilometres.

Visiting Palestine, whoever you are.

Resort guest, villa renter, family, nomad or backpacker. The honest playbook for each, from the same sourced numbers.
Already booked a resort? · the rescue list
Five swaps that move your money back on-island
1. Buy the olive oil here Olives take 85% of the horticultural tree area. Buying the oil at source keeps the margin with the grower rather than the shipper.
2. Use water like a resident 165 cubic metres per person a year, with 41.23% already withdrawn. Water is the one thing a visitor can measurably take.
3. Buy inscribed craft Palestinian embroidery is on the UNESCO Representative List. Buy the stitched piece, not the printed copy of it.
4. Walk the terraces Battir is a World Heritage cultural landscape that exists because it is still farmed. Visiting it is the point of protecting it.
swipe →
First time here
6,025 square kilometres, 87.38% urban, and six World Heritage sites. Bethlehem, Battir, Hebron, Jericho, Tell Umm el-Amr and Sebastia.
Best time: the olive harvest, October and November
Landscape first
Battir is inscribed as a cultural landscape of olives and vines, protecting terraces and irrigation rather than a monument. It is farming you can walk through.
Agricultural land is 64.93%
Buying well
Olive oil is the product the land actually makes, on 575,200 dunums. Embroidery is inscribed by UNESCO. Both are made here rather than imported.
Buy the thing that is grown or stitched here

Society and Governance in Palestine.

Society
5.6 million people (PCBS, end 2025), 87.38% urban. Adult literacy is 97.94% (World Bank, 2024), among the highest anywhere, and everyone has access to electricity (World Bank, 2024). Life expectancy is 69.21 years and the Gini index is 36.4 (World Bank, 2023 and 2024).
How well is Palestine run? · each scored out of 100, higher is better
Income equality, scored 36 of 100
Gini index 36.4 (World Bank, 2023), more equal than many neighbours.
36
What is daily life in Palestine really like? Measured
Getting around, breathing, throwing away, learning. The honest checklist.
WaterEnergyAirWasteCulture
·Freshwater available About 165 m3 per person with 41.23% withdrawn (World Bank, 2021). Severe stress.
Safe drinking water 80.64% on safely managed drinking water (World Bank, 2024).
97.9%
literacy.

Culture in Palestine.

October and November
The olive harvest
The working season on 575,200 dunums of olives, 85% of the horticultural tree area (PCBS, 2020/21). Whole families pick, and the crop feeds both the kitchen and the export trade.
Year round
Living heritage inscribed by UNESCO
Nine practices are on the UNESCO intangible heritage lists, from the Hikaye storytelling tradition in 2008 to embroidery and Arabic calligraphy in 2021, Dabkeh in 2023, Nabulsi soap making in 2024 and Arabic kohl in 2025.
Does Palestine protect its heritage by law?
Partly, and the gaps say as much as the protections.
What is kept alive. Nine practices on the UNESCO intangible lists, from the Hikaye in 2008 to embroidery in 2021, Dabkeh in 2023, Nabulsi soap in 2024 and Arabic kohl in 2025.
Where it is rooted. Battir is inscribed as a cultural landscape of olives and vines, which protects a working farming system rather than a monument.
How old. A fortified settlement stood at Tell es-Sultan beside Jericho in the ninth millennium BC, inscribed by UNESCO in 2023.

The Future of Palestine.

Three futures for Palestine, every one run forward from measured data.
Every measured trend on one line
Run forward at the pace already recorded.
+12%
Forest cover
1990: 1.51% → 2023: 1.68%
199020231.7%
from zero
Renewable electricity
2000: 0% → 2021: 24.46%
2000202124.5%
+19%
Protected land
2017: 8.4% → 2025: 10%
2017202510%
+8%
Safely managed drinking water
2000: 74.55% → 2024: 80.64%
2000202480.6%
+5%
PM2.5 air pollution
1990: 21.29 ug/m3 → 2023: 22.39 ug/m3
1990202322.4 ug/m3
-18%
Agricultural land
1961: 79.57% → 2023: 64.93%
1961202364.9%
+98%
Urban population
1960: 44.18% → 2025: 87.38%
1960202587.4%
+2%
Life expectancy
1990: 67.8 yrs → 2024: 69.21 yrs
1990202469.2 yrs
+2%
Access to electricity
1997: 97.9% → 2024: 100%
19972024100%
-56%
Employment in agriculture
1991: 14.49% → 2022: 6.34%
199120226.3%
-58%
Agriculture share of GDP
1994: 13.26% → 2024: 5.52%
199420245.5%
+174%
Population
1990: 1978248 → 2025: 5413596
199020255,413,596
from zero
Internet use
1990: 0% → 2023: 86.64%
1990202386.6%
+68%
Diabetes
2011: 9.2 % of adults → 2024: 15.5 % of adults
2011202415.5 % of adults
-60%
Freshwater per person
1990: 410.46 m3 → 2021: 164.95 m3
19902021164.9 m3
4
How much forest is left?
199020231.7%
Forest cover moved from 1.51% to 1.68% across 33 recorded years.
World Bank AG.LND.FRST.ZS
How clean is the grid?
2000202124.5%
Renewable electricity moved from 0% to 24.46% across 21 recorded years.
World Bank EG.ELC.RNEW.ZS
How much land is protected?
2017202510%
Protected land moved from 8.4% to 10% across 8 recorded years.
World Bank ER.LND.PTLD.ZS
Can people drink the water?
2000202480.6%
Safely managed drinking water moved from 74.55% to 80.64% across 24 recorded years.
World Bank SH.H2O.SMDW.ZS
How clean is the air?
1990202322.4 ug/m3
PM2.5 air pollution moved from 21.29 ug/m3 to 22.39 ug/m3 across 33 recorded years.
World Bank EN.ATM.PM25.MC.M3
How much land is farmed?
1961202364.9%
Agricultural land moved from 79.57% to 64.93% across 62 recorded years.
World Bank AG.LND.AGRI.ZS
How urban is it?
1960202587.4%
Urban population moved from 44.18% to 87.38% across 65 recorded years.
World Bank SP.URB.TOTL.IN.ZS
How long do people live?
1990202469.2 yrs
Life expectancy moved from 67.8 yrs to 69.21 yrs across 34 recorded years.
World Bank SP.DYN.LE00.IN
Does everyone have power?
19972024100%
Access to electricity moved from 97.9% to 100% across 27 recorded years.
World Bank EG.ELC.ACCS.ZS
How many people farm?
199120226.3%
Employment in agriculture moved from 14.49% to 6.34% across 31 recorded years.
World Bank SL.AGR.EMPL.ZS
How much of the economy is farming?
199420245.5%
Agriculture share of GDP moved from 13.26% to 5.52% across 30 recorded years.
World Bank NV.AGR.TOTL.ZS
How many people?
199020255,413,596
Population moved from 1978248 to 5413596 across 35 recorded years.
World Bank SP.POP.TOTL
Who is online?
1990202386.6%
Internet use moved from 0% to 86.64% across 33 recorded years.
World Bank IT.NET.USER.ZS
How common is diabetes?
2011202415.5 % of adults
Diabetes moved from 9.2 % of adults to 15.5 % of adults across 13 recorded years.
World Bank SH.STA.DIAB.ZS
How much water is there?
19902021164.9 m3
Freshwater per person moved from 410.46 m3 to 164.95 m3 across 31 recorded years.
World Bank ER.H2O.INTR.PC
Worst caseCurrent pathBest case
Worst case
The worst case is the olive terraces going. They are 85% of the horticultural tree area, the basis of the Battir World Heritage listing, and they depend on rainfall in a territory already withdrawing 41.23% of its freshwater.
Computed from: Worst case holds the weak pillars where they are and assumes the strong ones erode.
What the best case actually asks for
Lift recycling
It scores 2 out of 5, with collection already at 79% of households.
measured each year
Costs: sorting and treatment capacity, not collection
Protect more land
Protected land is 10% against a 30% pledge for 2030.
by 2030
Costs: land designation in a territory of 6,025 sq km
Hold the terraces
Olives are 85% of the tree crop area and underpin the Battir listing.
continuous
Costs: water allocation

Government and Goals in Palestine.

Who is in charge of Palestine now · Head of government cross-checked against Wikidata, September 2026. Confirm against the Palestinian Authority before relying on it.
Mohammad Mustafa
Prime Minister
Mohammad MustafaPrime Minister
Palestinian Legislative CouncilLegislature
Palestine national goals: What has been signed up to · Targets are from the Kunming-Montreal Global Biodiversity Framework. Status is measured against the World Bank protected-area series on this page.
2030
30% of land protected
a third of the way
Target 3 of the Kunming-Montreal Global Biodiversity Framework. Protected land is 10% (World Bank, 2025).
2030
30% of sea protected
not started
The marine half of the same pledge. Protected territorial waters stand at 0% (World Bank, 2025).
ongoing
Safeguard living heritage
nine inscribed
Nine practices are inscribed on the UNESCO intangible heritage lists between 2008 and 2025, from the Hikaye to Arabic kohl.
2014
Protect the terraced landscape
inscribed
Battir was inscribed as Palestine: Land of Olives and Vines, a World Heritage cultural landscape that protects a working farming system.

How Palestine Ranks, region and world.

Where Palestine sits on the Eco Index, against its Asia neighbours and the 77 destinations scored worldwide.
How does Palestine compare in Asia?
5Laos67
Scored Asia destinations, Eco Index.
The global top 10 of the 77 destinations scored
2Peru80
Palestine sits 41 of 77 at 67/100. Every name links to its own destination page, built exactly like this one. The full ranking →
Similar countries doing it better and worse
Sri LankaScored on the same twelve pillars as Palestine.75
IndiaScored on the same twelve pillars as Palestine.72
ThailandScored on the same twelve pillars as Palestine.68
PalestineThis page.67
LaosScored on the same twelve pillars as Palestine.67
JordanScored on the same twelve pillars as Palestine.50
A note from the lens of mother natureswipe →
Water, 1/5
165 cubic metres per person with 41.23% withdrawn (World Bank, 2021).
Consequence: The binding constraint on the whole record, and the hardest to change.
Recycling, 2/5
79% of households have collection, but recycling is left to private operators.
Consequence: The cheapest real gain, because the collection network already exists.
Culture, 5/5
Nine inscribed living traditions and six World Heritage sites.
Consequence: The strongest part of the record by a distance.

The Palestine Directory.

Everything on Hold The Throne that sits in Palestine, checked and listed.
How the rest of the world scores Palestine
Independent global indices, for calibration.
Agricultural land
64.93%
World Bank, 2023.
Forest cover
1.68%
World Bank, 2023.
Protected land
10%
World Bank, 2025.
Protected sea
0%
World Bank, 2025.
Renewable electricity
24.46%
World Bank, 2021.
Fossil electricity
75.54%
World Bank, 2021.
Freshwater per person
165 m3
World Bank, 2021.
Freshwater withdrawn
41.23%
World Bank, 2021. Severe stress.
Safely managed drinking water
80.64%
World Bank, 2024.
PM2.5
22.39 ug/m3
World Bank, 2023.
Olives, share of tree crops
85%
PCBS, 2020/21.
Agriculture share of GDP
5.52%
World Bank, 2024.
Urban population
87.38%
World Bank, 2025.
Adult literacy
97.94%
World Bank, 2024.
Access to electricity
100%
World Bank, 2024.
World Heritage sites
6
UNESCO, 2012 to 2025.

How Palestine Is Scored. The Throne Standard.

Every destination on the index is scored the same way, so a 4 in Barbados means exactly what a 4 means in Iceland. No self-declared data and no brochure claims are accepted. Every figure on this page carries its named source and year, and the history on each page names what empire took as plainly as it scores the present.
The 12 pillars every destination is scored on, equally weighted
01
Conservation
Land and sea actually protected, not pledged
02
Wildlife
What survives, what is endemic, what is lost
03
Water
Fresh water per person, and the ocean’s health
04
Food & farming
Whether the place can feed itself
05
Organic & clean
Certified land and pesticide reality
06
Climate & energy
Emissions per person, how the grid is powered
07
Waste
Where the rubbish goes, what comes back
08
Health
What people eat and die of
09
Heritage
Living culture, and what the law keeps standing
10
Ownership
Who owns the economy, how much of a dollar stays
11
Governance
Freedom, honesty, promises kept
12
Future
Measured trends run forward, pledges against pace
What each 0 to 5 pillar score means, in plain words
0
Absent
nothing verifiable exists
1
Failing
measurably going the wrong way
2
Weak
claims outrun delivery
3
Fair
real effort, mixed results
4
Strong
genuinely good, evidence named
5
Leading
world class, and the trend holds
Where the numbers come from.
World Bank Group logo
International Monetary Fund logo
FAO logo
UNESCO logo
World Health Organization logo
IUCN logo
Our World in Data logo
Global Forest Watch logo
Ember
ND-GAIN
UN Tourism logo
Ocean Health Index
WRI Aqueduct
Global Footprint Network
IHME
One index, every destination. This same sectioned page renders for all 77 scored destinations, each with its own researched history, comparison charts and three-way future. Read the full methodology

Share this page: Palestine

Facebook
X
LinkedIn
Reddit
Threads
Email
WhatsApp