Destinations › Africa · The Destination Index · universal template · every figure sourced
Uganda.
East-Central Africa, west of Kenya, east of the Democratic Republic of the Congo. 241,038 sq km and 51,384,894 people, landlocked, with no coastline at all, tropical; generally rainy with two dry seasons (December to February, June to August); semiarid in northeast.
Region · AfricaPopulation · ~51,384,894Languages · Luganda, English and Swahili (both official), Runyankole, Acholi, Ateso, LusogaEco Index · 68/100 · Passable
The Eco Index across 12 pillars · scored 0 to 5 · World Bank, OWID, WHO/UNICEF JMP, FiBL, Protected Planet, IUCN, UNESCO (2023-24)
Conservation
Wildlife
Water
Food & farming
Organic & clean
Climate & energy
Waste
Health
Heritage
Ownership
Governance
Future
The History of Uganda.
Uganda holds exceptionally deep living heritage across its kingdoms and peoples. Royal Kiganda dances such as Bakisimba, Nankasa and Muwogola, Acholi Larakaraka and Bwola, and Ankole Ekitaguriro are still danced to ngoma drumming, amadinda and akadinda xylophones and the endongo lyre and adungu harp.
Where the name comes from
From Buganda, the kingdom at the centre of the territory, meaning the country of the Ganda people. 'Uganda' is the Swahili form. Source: national and regional toponymic records.
The land itself: a plateau ringed by mountains. Its high point is Margherita Peak on Mount Stanley, 5,109 m. Source: national mapping and survey records.
Where it starts
A tool industry named after a place here
An entire African Stone Age tool industry, the Sangoan, is named after Sango Bay on Lake Victoria, where it was first identified, and dates to roughly 500,000 to 300,000 years ago. Communities lived across the Great Lakes region for tens of thousands of years after that, and microliths at the Nsongezi rock shelter in the Kagera valley record Later Stone Age life continuing alongside farming societies. Between the fourteenth and sixteenth centuries the polity remembered as Kitara held territory from Lake Albert east to Lake Victoria, and the earthworks at Bigo bya Mugenyi show organised labour at scale.
How it got here
Four kingdoms, then a protectorate
The Babiito dynasty succeeded the Bachwezi, and the kingdoms of Bunyoro and Tooro formed alongside Buganda and Ankole, each with its own court, law and succession. Bunyoro fought a long war against British colonial expansion between 1872 and 1899 before being subdued. Britain declared the Uganda Protectorate in 1894 and ruled substantially through Buganda. Independence came on 9 October 1962.
The timeline
c. 500,000 to 300,000 years ago
Sango Bay.
An entire African Stone Age tool industry, the Sangoan, is named after Sango Bay on Lake Victoria, where it was first identified. ↗
c. 20,000 years ago onward
The lakes and the forest.
Communities lived across the Great Lakes region for tens of thousands of years, fishing, hunting and later farming. ↗
c. 900 to 1000
Nsongezi rock shelter.
Microliths and occupation layers in the Kagera valley, excavated in 1961, record Later Stone Age life continuing alongside farming societies. ↗
c. 1000 BC onward
Farming, cattle and iron.
Farming, cattle-keeping and ironworking communities settle the region between the lakes. ↗
14th to 16th century
The Empire of Kitara.
A polity remembered as Kitara controlled territory from the western shore of Lake Albert east to Lake Victoria and south to Lake Kivu, ruled by the Bachwezi. ↗
14th to 16th century
Bigo bya Mugenyi.
Massive earthwork trenches and embankments near Lake Albert, attributed to the Bachwezi era, showing organised labour and engineering at scale. ↗
16th century onward
Bunyoro, Buganda, Tooro, Ankole.
The Babiito dynasty succeeds the Bachwezi and the kingdoms of Bunyoro and Tooro form, alongside Buganda and Ankole, each with its own court, law and succession. ↗
1872 to 1899
The Anglo-Bunyoro wars.
Bunyoro fought a long war against British colonial expansion before being subdued. ↗
1894
The Uganda Protectorate.
Britain declares a protectorate, ruling substantially through Buganda. ↗
1962
Independence.
Self-government was inaugurated on 1 March 1962 and the last elections before independence followed. The Uganda People's Congress under Milton Obote took 37 seats to the Democratic Party's 24, while Buganda chose indirect election and its Lukiiko nominated 21 representatives. That government received the instruments of independence on 9 October 1962. ↗
About 16% of Uganda's land is protected (World Bank, 2025), spread across ten national parks including Bwindi, Queen Elizabeth, Murchison Falls and Kidepo. Gorilla and chimpanzee tourism helps fund ranger patrols and community revenue sharing, which supports enforcement. Encroachment for farming, charcoal and wetland reclamation remains a serious pressure.
Is wild Uganda protected? 16.1% of the land is, against a 30% target for 2030
Found only here. Albertine Rift endemics; the mountain gorilla, shared with Rwanda and the DRC
The watchlist
ThreatenedAfrican Pygmy Elephant (Loxodonta cyclotis)Critically Endangered on the IUCN Red List, and recorded in Uganda in GBIF occurrence data (mammal).
ThreatenedGyps africanusCritically Endangered on the IUCN Red List, and recorded in Uganda in GBIF occurrence data (bird).
ThreatenedAfrican elephant (Loxodonta africana)Endangered on the IUCN Red List, and recorded in Uganda in GBIF occurrence data (mammal).
ThreatenedPiliocolobus tephroscelesEndangered on the IUCN Red List, and recorded in Uganda in GBIF occurrence data (mammal).
ThreatenedRuppell's griffon (Gyps rueppellii)Critically Endangered on the IUCN Red List, and recorded in Uganda in GBIF occurrence data (bird).
ThreatenedNecrosyrtes monachusCritically Endangered on the IUCN Red List, and recorded in Uganda in GBIF occurrence data (bird).
ThreatenedTrigonoceps occipitalisCritically Endangered on the IUCN Red List, and recorded in Uganda in GBIF occurrence data (bird).
Critically Endangered, the last IUCN category before Extinct in the Wild, and still recorded in Uganda. GBIF holds 3 verified occurrence records.
Gyps africanus
Critically Endangered, the last IUCN category before Extinct in the Wild, and still recorded in Uganda. GBIF holds 228 verified occurrence records.
Ruppell's griffon (Gyps rueppellii)
Critically Endangered, the last IUCN category before Extinct in the Wild, and still recorded in Uganda. GBIF holds 141 verified occurrence records.
Species named here are drawn from GBIF occurrence records for Uganda filtered to the IUCN Red List threatened categories. Species are listed where GBIF holds occurrence records for them in this country. Record counts are not published here because the figure cannot be reproduced from a public GBIF query.
Botanical garden in Western Region, mapped and named in the open record for Uganda. OpenStreetMap.
Water and Ocean in Uganda.
Uganda sits on abundant fresh water, including Lake Victoria, Lake Albert and the source of the White Nile, so raw supply is rarely the problem. The gap is treatment and access: only about 18% of people have safely managed drinking water (World Bank and JMP, 2024) and tap water is generally unsafe to drink. Many rural households rely on untreated lake, river or borehole water, which drives recurring cholera outbreaks.
Does Uganda have enough fresh water? Yes, with headroom
18.1% of people here have safely managed drinking water at home (2024, WHO/UNICEF JMP). Coverage is well short of universal, so a visitor should not assume the tap is safe.
Cleanest water: The crater lakes near Fort Portal and Rwenzori streams
How much fresh water does Uganda have, per person?
824 m³
Uganda
1,000 m³
the UN “water scarce” line
Uganda withdraws about 637 million cubic metres of fresh water a year (2022). That is 5.8% of the fresh water actually available to it, which FAO counts as no water stress. Of what is taken, farming takes 41%, homes and towns 51%, industry 8%. Source: FAO AQUASTAT.
Where does the sewage go?
20.4%
of people have safely managed sanitation
20.4% of people here use a safely managed sanitation service, meaning waste is contained, emptied and treated rather than reaching the ground or the sea untreated (2024, World Bank / WHO-UNICEF JMP, SDG 6.2.1). The rest is what the rivers and the coast receive.
Is the tap water safe in Uganda?
18.1% of people have safely managed drinking water at home (2024, WHO/UNICEF JMP). Renewable fresh water works out at about 824 cubic metres per person a year (World Bank).
How hard is the water supply being pushed?
Of every 10 buckets nature refills, 1 are already taken. Withdrawals run at 5.8% of what Uganda renews internally each year (2022, World Bank / FAO AQUASTAT). That is inside the 25% mark generally treated as water stress, so the supply has headroom.
When is the best time to visit Uganda? Tap your month.
Tap your month.
JanFebMarAprMayJunJulAugSepOctNovDec
.
How much fresh water does Uganda actually have?
Nature renews about 824 cubic metres of fresh water per person per year here. That ranks Uganda 51 of 208 countries measured, putting it in the drier half of the world. The UN treats anything under 1,000 cubic metres as water scarce, and this is below that line. World Bank / FAO AQUASTAT.
Agriculture employs around two thirds of Ugandans and the country grows most of what it eats. Staples such as matoke (steamed plantain), cassava, sweet potato, millet, beans and groundnuts come from smallholder plots, and food import dependence is low. Fertile soils and a bimodal rainfall pattern support two harvests a year in much of the country.
Where does the food in Uganda come from?
10.7% imported
about US$1,975m a year
On the plate: Matoke (steamed plantain), cassava, sweet potato, millet, beans, groundnuts and cooked greens
How often each food is on the plate
Share of people eating each one regularly. These overlap, so they do not add up to 100%.
Cassava51%
Sweet potato42%
Millet33%
Beans24%
Groundnuts15%
1 of 10
bites are imported
The island buys in more food energy than it eats. About US$1,975m a year leaves the country to pay for it. The green slice is roughly what still grows here.
About 10.7% of everything Uganda buys in from abroad is food, roughly 1 in every 10 imported items on the dock (2024, World Bank). Farming itself is 26.1% of the economy and 71.9% of the land is agricultural, of which 34.4% is arable. The green slice is roughly what still grows here.
What is killing people in Uganda? The imported diet.
Cause of death, and the diet behind it.
Non-communicable diseases, all combined36.9%
Diabetes2.2%
Adults living with overweight or obesity. 23.8%.
Can Uganda feed itself?
34.4%
Arable land
71.9%
Agricultural land
15,171,861
Farmers
17,050,245
Arable acres
26.1%
Agriculture, share of GDP
Harvest: Two harvests a year; grain harvests around June to July and December to January, bananas year round
Feeding itself
Agriculture employs around two thirds of Ugandans and the country grows most of what it eats. Staples such as matoke (steamed plantain), cassava, sweet potato, millet, beans and groundnuts come from smallholder plots, and food import dependence is low.
Certification
Certified organic farmland is about 0.8% of agricultural land (FiBL, 2020), which places Uganda in a low band by area. In practice Uganda has one of the largest populations of certified organic farmers in Africa and a genuine organic export sector in coffee, cotton and cocoa, and most smallholdings use few or no synthetic inputs by default.
Water for crops
Uganda sits on abundant fresh water, including Lake Victoria, Lake Albert and the source of the White Nile, so raw supply is rarely the problem. The gap is treatment and access: only about 18% of people have safely managed drinking water (World Bank and JMP, 2024) and tap water is generally unsafe to drink.
Why the organic number looks like that. Certified-organic farmland is not separately reported for Uganda, and that is a certification gap rather than proof nothing is grown cleanly. What the official land record does show: 71.9% of the country is agricultural land and 34.4% is arable (2023, World Bank). Certification is paid for per farm per year by a foreign body, which prices out smallholders, so the organic number reads worse than the practice.
The plant-based kitchen here is not an import. By tonnage, the largest crops grown in Uganda are plantains and cooking bananas, sugarcane, maize, cassava and sweet potatoes (FAO, FAOSTAT crop production, 2024). That is what the land itself puts on a plate.
Buy direct where residents buy: Barakala Market, Bwaise Farmers' Market, Clothing Market, Gayaza Market, Gulu Main Market, Gulu Market. Each is a mapped, named marketplace, so the money stays with the seller rather than the importer. OpenStreetMap.
Uganda's electricity is almost entirely renewable, with large hydropower on the Nile (plants such as Bujagali, Isimba and Karuma) supplying roughly 90% or more of generation and the grid as a whole close to fully renewable. Territorial CO2 emissions are among the lowest in the world at about 0.13 tonnes per person (2024), a small fraction of the global average. The country has a low-emission development strategy and updated climate commitments under the Paris Agreement. A real forward risk is the Lake Albert oil development and the East African Crude Oil Pipeline, which could raise emissions and shift Uganda towards fossil-fuel exports.
What powers Uganda?
Renewable 97.1%Fossil 2.9%
Climate pollution per person
The safe amount, what the planet can absorb
2 tonnes
One person here
0.17 tonnes
The world average, for comparison
4.7 tonnes
The worst it ever got
0.17 tonnes
The grid
Uganda's electricity is almost entirely renewable, with large hydropower on the Nile (plants such as Bujagali, Isimba and Karuma) supplying roughly 90% or more of generation and the grid as a whole close to fully renewable. Territorial CO2 emissions are among the lowest in the world at about 0.13 tonnes per person (2024), a small fraction of the global average.
Pollution
Air quality is moderate to poor, with a modelled PM2.5 annual mean around 31 micrograms per cubic metre (World Bank, 2023), driven by charcoal and biomass burning and vehicle smoke in Kampala. Uganda has legislated bans on thin plastic bags (kaveera) more than once, but enforcement is weak and litter is common in towns.
Water stress
Uganda sits on abundant fresh water, including Lake Victoria, Lake Albert and the source of the White Nile, so raw supply is rarely the problem. The gap is treatment and access: only about 18% of people have safely managed drinking water (World Bank and JMP, 2024) and tap water is generally unsafe to drink.
What pollutes most here
1The gridThe share of electricity still generated from fossil fuel.10%
2IndustryUrban charcoal and biomass smoke, and emerging oil development around Lake Albert.named
3AirModelled annual mean against a WHO guideline of 5 µg/m³.31.2
4On the recordAir quality is moderate to poor, with a modelled PM2.5 annual mean around 31 micrograms per cubic metre (World Bank, 2023), driven by charcoal and biomass burning and vehicle smoke in Kampala.
What has Uganda promised on climate?
Electricity renewable today90% (2021)
Land protected, against a 30% target16.1% by 2025
Measured on delivery, 90% of electricity is already renewable (2021, World Bank), so 10% of the grid is still to be converted. The pledge on file is measured here against what has actually been delivered, not taken on its own (UNFCCC NDC Registry, CBD Kunming-Montreal Target 3).
The biggest line item
One return flight against a whole year of living.
A resident's entire year0.17 t CO2e
Safe-climate budget, per year2 t CO2e
Los Angeles return, economy2.73 t CO2e
Sydney return, economy2.28 t CO2e
New York return, economy2.05 t CO2e
Singapore return, economy1.43 t CO2e
London return, economy1.17 t CO2e
How much CO2 does flying to Uganda emit?
Tap where you would fly from. One return flight, economy.
Every prompt runs on a machine in a building on somebody’s grid. What that costs the planet depends less on the prompt than on what is burning to power it. Here is what would power one in Uganda.
Data centres
2
Registered colocation and interconnection facilities, PeeringDB, 2026
Grid renewable
97.1 %
What a machine here runs on.
What powers a data centre in Uganda?
Running AI here is about as clean as it currently gets.
Renewable 97.1%Fossil 2.9%
Cooling water. Every one of those halls runs on the national grid, which is 90% renewable today (World Bank). A data centre is only as clean as the electricity behind it, so the same figure that decides this country's climate score also decides the footprint of the AI running inside it. Cooling water use is not separately published by facility, and no operator here reports it.
The rules. Uganda has 2 colocation and interconnection facilities on the public PeeringDB register, concentrated in Kampala (2), alongside 1 internet exchange (UIXP). Named sites include Communications House, Raxio, UG1, Kampala, Uganda.
97% residents to 3% visitors across a year. 1,543,000 international arrivals in 2019 against 51,384,894 people who live here (2025, World Bank / UN Tourism).
Where a visitor dollar goes in Uganda
473k
Visitors a year
0.0
Visitors per resident
How deep in debt is Uganda?· for every $100 Uganda earns in a year, it owes…
Pay to the order of: the creditorsmemo · today
$ 55What is owed now, for every $100 of national income (2026).
IMF World Economic Outlook, 2026signed, the creditors
Pay to the order of: the creditorsmemo · projected 2031
$ 53The IMF's own forecast has this falling to $53 by 2031.
IMF World Economic Outlook projection, 2031signed, the forecast
For every $100 Uganda earns in a year, it owes $55 (2026, IMF World Economic Outlook). The interest on that is paid before schools, clinics or coastline get their turn.
Where does a tourist dollar actually go in Uganda?
Play one tourist dollar around the board. Every square is a measured fact from this page.
START!
1
GO: a visitor lands
$100 goes on the table. 1,543,000 international arrivals in 2019 against 51,384,894 residents, one visitor a year for every 33 residents (World Bank / UN Tourism).
$100 in play
2
The bed
Who owns the largest places to stay in Uganda is not published in the records we can check, so this square is left open rather than guessed. Where a listing names its owner, it is shown in the ownership table below.
not published
3
The plate
Food is only 10.7% of everything Uganda imports (2024, World Bank), so most of a meal is bought from producers inside the country. Eating what the land here actually grows, plantains, sugarcane, maize, cassava, sweet potatoes, vegetables, beans, potatoes, tea, keeps that money with the grower.
mostly home-grown
4
The power
90% of the electricity is renewable (2021, World Bank), so the energy on the bill is mostly generated inside the country rather than shipped in.
made at home
5
What actually stays
Of the two parts of a visitor's bill that can be measured here, the plate and the power stay inside Uganda. This is not an economy where a visitor's money drains away, and the board is shorter for it.
most of it
6
Pay the bank first
Uganda owes $55 for every $100 it earns (IMF World Economic Outlook, 2026 projection). The interest is paid before anything else on this board.
$55 per $100
7
No plan B
35.4% of everything Uganda sells abroad is pearls, gemstones and precious metals (2023, UN Comtrade). One market moving takes the whole board with it.
35.4% one export
8
Community chest
Tourism earns 9.2% of everything Uganda makes from exports (2020, World Bank / UN Tourism). That is how much of the economy depends on the game continuing.
9.2% of exports
9
The flight
Getting here is usually the biggest single line on the bill. From Los Angeles a return economy seat is 2.73 t CO2, on the UK Government's published conversion factors. It is the one part of the trip this board cannot reduce.
2.73 t CO2
10
Back to GO
The economy turns over about US$73 billion a year (IMF World Economic Outlook, 2026 projection). Every lap of this board is a choice about how much of it stays.
US$73bn
GDPUS$62.0bn
Agriculture, share of GDP26.1%
Visitors a year473,000
Visitors per resident0
Residents~51,384,894
Agriculture
Farming is 26.1% of the economy. Agriculture employs around two thirds of Ugandans and the country grows most of what it eats.
Natural materials
Uganda keeps a living natural materials tradition in barkcloth, made from the inner bark of the Mutuba fig and recognised by UNESCO as intangible cultural heritage. Basketry, mat weaving and home grown cotton add to a real craft base that still relies on plant fibres rather than plastics.
Energy
Uganda's electricity is almost entirely renewable, with large hydropower on the Nile (plants such as Bujagali, Isimba and Karuma) supplying roughly 90% or more of generation and the grid as a whole close to fully renewable. Territorial CO2 emissions are among the lowest in the world at about 0.13 tonnes per person (2024), a small fraction of the global average.
Who owns the biggest hotels in Uganda?
By rooms · company records and press.
Kyambura Gorge Lodge · ~8 roomsIndependentnot published
Visitors, over time
20151,303k
20161,323k
20171,402k
20181,506k
20191,543k
2020473k
International tourism receipts run at about US$0.52 billion in 2020 (World Bank / UN Tourism). That is 9.2% of everything the country earns from exports.
How much of your money actually stays here?
Tap the holiday you are planning.
All-inclusive resortForeign-owned hotel and tourist restaurantsLocally owned stay and local restaurantsGuesthouse, markets and public transport
Resort guest, villa renter, family, nomad or backpacker. The honest playbook for each, from the same sourced numbers.
Already booked a resort? · the rescue list
Five swaps that move your money back on-island
1. Eat where the country eats Choose kitchens cooking matoke (steamed plantain), cassava, sweet potato, millet, beans, groundnuts and cooked greens over imported menus. The checked list →
2. Book with a local operator Never the lobby desk. The margin on a tour is the part that stays. Eco tours →
3. Stay somewhere locally owned Ownership decides where the room rate books. Eco stays →
4. Use the transport residents use Light aircraft to the parks, 4x4 with a driver, matatu minibuses and boda boda motorbikes
5. Buy the craft, not the souvenir Natural-materials work made here pays the maker directly; imported gifts pay a shipping line.
swipe →
First time here
A green, water rich equatorial country whose forests shelter roughly half the planet's mountain gorillas, though safe drinking water and enforced pollution rules lag well behind.
Best time: The drier seasons
Getting around
Light aircraft to the parks, 4x4 with a driver, matatu minibuses and boda boda motorbikes
Transport is where the fare either stays or leaves.
Eating here
The everyday plate is matoke (steamed plantain), cassava, sweet potato, millet, beans, groundnuts and cooked greens. The everyday Ugandan plate is built on plants: matoke, cassava, sweet potato, beans, groundnut sauce and cooked greens such as dodo and nakati.
Eating what the country grows is the cheapest way to cut the import bill.
Good to know
Cash widely used; UGX. Gorilla permits sell out months ahead; carry small notes.
Rate my hotel. Tap yours for the honest verdict.
Ownership from company records and press.
Kyambura Gorge Lodge
.
Who owns the place to stay
Kyambura Gorge LodgeIndependent · 8 rooms
The one property listed here does not publish who ultimately owns it, so no claim is made either way. Ownership is what decides how much of a room rate stays in the country, which is why we show it when a listing states it.
Society and Governance in Uganda.
How well is Uganda actually run?
Governance, measured · World Bank WGI
Four measured answers, none of them opinion. Averaged across corruption control, delivery and accountability, Uganda scores 36 out of 100 (2024, World Bank Worldwide Governance Indicators). That matters here because every pledge on this page is only as good as the machinery meant to deliver it.
How well is Uganda run? · each scored out of 100, higher is better
Clean government, scored 25 of 100
Control of corruption scores 25.3 out of 100 (2024, World Bank Worldwide Governance Indicators). That is below the halfway mark of governments measured.
25
Freedom and rights, scored 39 of 100
Voice and accountability, which measures free expression, free media and the ability to choose a government, scores 39.1 out of 100 (2024, World Bank WGI). Room to question the government publicly is limited.
39
Government effectiveness, scored 45 of 100
Government effectiveness, which measures the quality of public services and how well policy is actually delivered, scores 44.5 out of 100 (2024, World Bank WGI). Delivery is rated below average, so a pledge on paper is not the same as a pledge kept.
45
Income equality, scored 43 of 100
The Gini index of income inequality reads 42.7 (2019, World Bank). Zero is perfect equality and 100 is one person holding everything. Above 40 is the level usually treated as socially strained, and Uganda sits above it.
43
LGBTQ+ status: IllegalSolo female travel: Take care77% adult literacyIndustry to avoid: Urban charcoal and biomass smoke, and emerging oil development around Lake Albert
What is daily life in Uganda really like? Measured
Getting around, breathing, throwing away, learning. The honest checklist.
TransportAirWaterWastePower
✓How you get around Light aircraft to the parks, 4x4 with a driver, matatu minibuses and boda boda motorbikes
✓Air quality, measured Modelled annual mean 31.2. The WHO guideline is 5 µg/m³.
✓Where the air is cleanest The rural south west highlands and the Rwenzori
·Tap water Not drinkable
✓What to drink Bottled water everywhere; never drink untreated water.
✓Plastic rules Plastic bag (kaveera) ban legislated but weakly enforced
✓Sockets and voltage Type C/F, 230V
77.0%
literacy. Public spending on education runs at 2.6% of GDP and 8.5% of all government spending (UNESCO Institute for Statistics, 2022). The most recent gross secondary enrolment ratio UNESCO has published for Uganda is 24.1%, and it dates from 2007.
Made in Uganda.
Uganda keeps a living natural materials tradition in barkcloth, made from the inner bark of the Mutuba fig and recognised by UNESCO as intangible cultural heritage. Basketry, mat weaving and home grown cotton add to a real craft base that still relies on plant fibres rather than plastics. Every step of processing done at home is value that stops leaving the country.
What Uganda actually sells the world
The single biggest thing Uganda sells the world is pearls, gemstones and precious metals, 35.4% of all exports in 2023 (about US$2.23 billion, UN Comtrade). The next four are coffee, tea and spices at 17.0%, cereals at 3.0%, mineral fuels and oils at 3.0%, ceramics at 2.9%.
Sells now · 35.4% of exports
Pearls, gemstones and precious metals
Pearls, gemstones and precious metals is 35.4% of everything Uganda sold abroad in 2023, worth about US$2.23 billion. UN Comtrade.
Sells now · 17.0% of exports
Coffee, tea and spices
Coffee, tea and spices is 17.0% of everything Uganda sold abroad in 2023, worth about US$1.07 billion. UN Comtrade.
Sells now · 3.0% of exports
Cereals
Cereals is 3.0% of everything Uganda sold abroad in 2023, worth about US$0.19 billion. UN Comtrade.
Sells now · 3.0% of exports
Mineral fuels and oils
Mineral fuels and oils is 3.0% of everything Uganda sold abroad in 2023, worth about US$0.19 billion. UN Comtrade.
Sells now · 2.9% of exports
Ceramics
Ceramics is 2.9% of everything Uganda sold abroad in 2023, worth about US$0.18 billion. UN Comtrade.
Buys in · 7.8% of imports
Machinery and mechanical appliances
Uganda imported US$0.91 billion of machinery and mechanical appliances in 2023, 7.8% of everything it bought abroad, and sells none of it back. Every point of that is a business that could be built at home rather than shipped in. UN Comtrade.
Buys in · 7.2% of imports
Vehicles
Uganda imported US$0.84 billion of vehicles in 2023, 7.2% of everything it bought abroad, and sells none of it back. Every point of that is a business that could be built at home rather than shipped in. UN Comtrade.
Buys in · 4.7% of imports
Plastics
Uganda imported US$0.56 billion of plastics in 2023, 4.7% of everything it bought abroad, and sells none of it back. Every point of that is a business that could be built at home rather than shipped in. UN Comtrade.
Buys in · 4.6% of imports
Electrical machinery and electronics
Uganda imported US$0.54 billion of electrical machinery and electronics in 2023, 4.6% of everything it bought abroad, and sells none of it back. Every point of that is a business that could be built at home rather than shipped in. UN Comtrade.
The maths for an entrepreneur. Uganda produces about US$62 billion a year, which is roughly US$1,206 per person (2025, World Bank). Farming is 26.1% of that, while food is 10.7% of everything the country imports. With 34.4% of the land arable, the raw material for that is already in the ground.
Kiganda royal dances (Bakisimba, Nankasa, Muwogola)
A living tradition of Uganda, still practised rather than archived.
Acholi Larakaraka
A living tradition of Uganda, still practised rather than archived.
Bwola
A living tradition of Uganda, still practised rather than archived.
Ankole Ekitaguriro
A living tradition of Uganda, still practised rather than archived.
Ngoma drummingA living tradition of Uganda, still practised rather than archived.
AmadindaA living tradition of Uganda, still practised rather than archived.
Does Uganda protect its heritage by law?
Partly, and the gaps say as much as the protections.
What is kept alive. Uganda holds exceptionally deep living heritage across its kingdoms and peoples. Royal Kiganda dances such as Bakisimba, Nankasa and Muwogola, Acholi Larakaraka and Bwola, and Ankole Ekitaguriro are still danced to ngoma drumming, amadinda and akadinda xylophones and the endongo lyre and adungu harp. Ancestral traditions remain widely alive, including the Empaako naming system, Bigwala gourd trumpet music, the Imbalu circumcision ceremony of the Bagisu and barkcloth making of the Baganda, several inscribed on UNESCO's heritage lists.
Who it belongs to. Uganda has strong living communities, from the Baganda to the Batwa and Karamojong, and community tourism is real, with gorilla permit revenue sharing funding schools, clinics and enterprises around Bwindi. The record is not clean: the Batwa were evicted from Bwindi and Mgahinga when the parks were gazetted and remain marginalised conservation refugees.
Only here. Bwindi Impenetrable Forest, home to roughly half of all remaining wild mountain gorillas.
Three futures for Uganda, every one run forward from measured data.
Where the making actually happens
Named cultural and craft sites on the open map: Annah's Craft Centre (Rubanda), Katwe Tourist Information Centre (KATIC) and Craft Shop (Kasese), Uganda Museum (Kampala), ST. LUKE COMMUNITY MUSEUM (Kyotera), RAILWAY MUSEUM (Jinja City). OpenStreetMap. Named craft workshops on the open map: African Art Crafts Market, Crafts Africa, Exposure Africa Ltd, Flock of Birds, Kabale Crafts Store, Kanya Kankara Group & Drum.
Every measured trend on one line
Run forward at the pace already recorded.
-35%
Forest cover
1995: 16.9 % → 2023: 11 %
-8%
Renewable electricity
2005: 97.7 % → 2021: 90 %
+237%
CO2 per person
1995: 0.049 t → 2024: 0.165 t
+196%
Tourist arrivals
1995: 160 k → 2020: 473 k
+0%
Protected land
2013: 16.1 % → 2025: 16.1 %
+6%
Farm workforce
1995: 61.4 % → 2025: 64.9 %
+18%
Agricultural land
1995: 60.7 % → 2023: 71.9 %
+198%
Urban population
1995: 10.7 % → 2025: 31.9 %
+9%
Air pollution
1995: 28.6 µg/m³ → 2023: 31.2 µg/m³
-56%
Fresh water per person
1995: 1887.2 m³ → 2022: 824.3 m³
+183%
Adult overweight
1995: 8.4 % → 2022: 23.8 %
+713%
Electricity access
1995: 6.8 % → 2024: 55.3 %
+332%
GDP per person
1995: 279 → 2025: 1206
+149%
Population
1995: 20666 k → 2025: 51385 k
-6%
Renewable energy use
1995: 96.5 % → 2022: 90.9 %
+25%
Energy per person
1995: 398.1 kg → 2023: 497.4 kg
+0%
Protected area, total
2013: 16.1 % → 2025: 16.1 %
+44%
Life expectancy
1995: 47.7 yrs → 2024: 68.5 yrs
+22%
Cereal yield
1995: 1571 ha → 2024: 1920 ha
+1181%
Fertiliser use
1995: 0.26 kg/ha → 2023: 3.33 kg/ha
-24%
Rural population
1995: 89.3 % → 2025: 68.1 %
+134%
Water productivity
1995: 29.6 $/m3 → 2022: 69.3 $/m3
-17%
Health spending
2000: 5.08 % → 2023: 4.24 %
-34%
Forest area
1995: 33692 km2 → 2023: 22141 km2
+305%
Electric power use
1995: 23.5 kWh → 2023: 95.3 kWh
+186%
Emissions: Agriculture
1990: 10.8 e → 2023: 30.8 e
+136%
Emissions: Building
1990: 4.8 e → 2023: 11.2 e
+228%
Emissions: Energy
1990: 5.6 e → 2023: 18.3 e
+3500%
Emissions: Industrial Processes
1990: 0.02 e → 2023: 0.72 e
+1056%
Emissions: Manufacturing/Construction
1990: 0.18 e → 2023: 2.08 e
+590%
Emissions: Transportation
1990: 0.61 e → 2023: 4.21 e
World Bank open data, recorded series
How much forest is left?
Forest cover moved from 16.9% to 11.0% across 28 recorded years.
World Bank AG.LND.FRST.ZS
How clean is the grid?
Renewable electricity moved from 97.7% to 90.0% across 16 recorded years.
World Bank EG.ELC.RNEW.ZS
How much climate pollution per person?
CO2 per person moved from 0.0 t to 0.2 t across 29 recorded years.
World Bank EN.GHG.CO2.PC.CE.AR5
How many people visit?
Tourist arrivals moved from 160k to 473k across 25 recorded years.
World Bank ST.INT.ARVL
How much land is protected?
Protected land moved from 16.1% to 16.1% across 12 recorded years.
World Bank ER.LND.PTLD.ZS
How many people still farm?
Farm workforce moved from 61.4% to 64.9% across 30 recorded years.
World Bank SL.AGR.EMPL.ZS
How much land is farmed?
Agricultural land moved from 60.7% to 71.9% across 28 recorded years.
World Bank AG.LND.AGRI.ZS
How fast is it urbanising?
Urban population moved from 10.7% to 31.9% across 30 recorded years.
World Bank SP.URB.TOTL.IN.ZS
Is the air getting cleaner?
Air pollution moved from 28.6 µg/m³ to 31.2 µg/m³ across 28 recorded years.
World Bank EN.ATM.PM25.MC.M3
Is water getting scarcer?
Fresh water per person moved from 1887.2 m³ to 824.3 m³ across 27 recorded years.
World Bank ER.H2O.INTR.PC
Is diet-related disease rising?
Adult overweight moved from 8.4% to 23.8% across 27 recorded years.
World Bank SH.STA.OWAD.ZS
Who has power?
Electricity access moved from 6.8% to 55.3% across 29 recorded years.
World Bank EG.ELC.ACCS.ZS
Is income rising?
GDP per person moved from 279 to 1206 across 30 recorded years.
World Bank NY.GDP.PCAP.CD
How fast is it growing?
Population moved from 20666k to 51385k across 30 recorded years.
World Bank SP.POP.TOTL
What share of all energy is renewable?
Renewable energy use moved from 96.5% to 90.9% across 27 recorded years.
World Bank EG.FEC.RNEW.ZS
How much energy does one person use?
Energy per person moved from 398.14 kg to 497.39 kg across 28 recorded years.
World Bank EG.USE.PCAP.KG.OE
How much land and sea is protected together?
Protected area, total moved from 16.1% to 16.1% across 12 recorded years.
World Bank ER.PTD.TOTL.ZS
How long do people live?
Life expectancy moved from 47.71 yrs to 68.49 yrs across 29 recorded years.
World Bank SP.DYN.LE00.IN
How much does a hectare of cereal produce?
Cereal yield moved from 1571 kg/ha to 1920 kg/ha across 29 recorded years.
World Bank AG.YLD.CREL.KG
How much fertiliser goes on the land?
Fertiliser use moved from 0.26 kg/ha to 3.33 kg/ha across 28 recorded years.
World Bank AG.CON.FERT.ZS
How many people still live rurally?
Rural population moved from 89.27% to 68.06% across 30 recorded years.
World Bank SP.RUR.TOTL.ZS
How much value per cubic metre of water?
Water productivity moved from 29.6 $/m3 to 69.3 $/m3 across 27 recorded years.
World Bank ER.GDP.FWTL.M3.KD
How much goes on health?
Health spending moved from 5.08% to 4.24% across 23 recorded years.
World Bank SH.XPD.CHEX.GD.ZS
How much forest is there in total?
Forest area moved from 33692 km2 to 22141 km2 across 28 recorded years.
World Bank AG.LND.FRST.K2
How much electricity per person?
Electric power use moved from 23.52 kWh to 95.28 kWh across 28 recorded years.
World Bank EG.USE.ELEC.KH.PC
How have agriculture emissions moved?
Agriculture emissions moved from 10.76 to 30.77 MtCO2e across 33 recorded years.
Climate Watch (WRI), historical emissions
How have building emissions moved?
Building emissions moved from 4.76 to 11.23 MtCO2e across 33 recorded years.
Climate Watch (WRI), historical emissions
How have energy emissions moved?
Energy emissions moved from 5.57 to 18.29 MtCO2e across 33 recorded years.
Climate Watch (WRI), historical emissions
How have industrial processes emissions moved?
Industrial Processes emissions moved from 0.02 to 0.72 MtCO2e across 33 recorded years.
Climate Watch (WRI), historical emissions
How have manufacturing/construction emissions moved?
Manufacturing/Construction emissions moved from 0.18 to 2.08 MtCO2e across 33 recorded years.
Climate Watch (WRI), historical emissions
How have transportation emissions moved?
Transportation emissions moved from 0.61 to 4.21 MtCO2e across 33 recorded years.
Climate Watch (WRI), historical emissions
Worst caseCurrent pathBest case
Worst case
Every measured decline continues at the pace already recorded. The weakest pillar, organic farming at 2/5, is the one that gives way first.
Computed from: recorded series extended with no policy change
Current path
Every line above is a recorded World Bank series for this country. The current path is simply those series continuing at the pace already measured.
Computed from: recorded series, no policy change assumed
Best case
The pledges are met on their own stated timetables and the weakest pillars are lifted to match the strongest. Uganda already shows it can do this: heritage scores 5/5.
Computed from: each published target delivered on its own date
What the best case actually asks for
Lift organic farming
It scores 2 out of 5 today, among the weakest parts of Uganda's record. Certified organic farmland is about 0.8% of agricultural land (FiBL, 2020), which places Uganda in a low band by area. In practice Uganda has one of the largest populations of certified organic farmers in Africa and a genuine organic export sector in coffee, cotton and cocoa, and most smallholdings use few or no synthetic inputs by default. Lifting it toward the 5/5 the strongest pillars already reach is what the best case turns on.
measured each year
Costs: spending and enforcement, not new technology
Lift pollution
It scores 2 out of 5 today, among the weakest parts of Uganda's record. Air quality is moderate to poor, with a modelled PM2.5 annual mean around 31 micrograms per cubic metre (World Bank, 2023), driven by charcoal and biomass burning and vehicle smoke in Kampala. Uganda has legislated bans on thin plastic bags (kaveera) more than once, but enforcement is weak and litter is common in towns. Lifting it toward the 5/5 the strongest pillars already reach is what the best case turns on.
measured each year
Costs: spending and enforcement, not new technology
Lift recycling
It scores 2 out of 5 today, among the weakest parts of Uganda's record. There is no reliable municipal recycling rate. What recovery happens is largely informal: waste pickers collect PET bottles, scrap metal and cardboard, and organic waste is often composted or fed to livestock. Formal kerbside recycling systems are minimal. Lifting it toward the 5/5 the strongest pillars already reach is what the best case turns on.
measured each year
Costs: spending and enforcement, not new technology
Government and Goals in Uganda.
Who is in charge of Uganda now · Office-holders from the UN Protocol and Liaison Service public list of Heads of State and Heads of Government, 8 September 2026. Legislature and election dates from IFES ElectionGuide. Constitution dates from the Constitute Project. Governance scores from the World Bank Worldwide Governance Indicators 2024.
Robinah Nabbanja
Prime Minister
Robinah Nabbanja is the head of government of Uganda, in office since 14 June 2021. Every climate, protection and energy pledge on this page is delivered, or not, under this administration.
Public opinion, measured
Voice and accountability, the freedom to question government: 39.1 / 100. Below the halfway mark of governments measured. World Bank WGI 2024
Control of corruption: 25.3 / 100. Below the halfway mark of governments measured. World Bank WGI 2024
Political stability and absence of violence: 48.4 / 100. Below the halfway mark of governments measured. World Bank WGI 2024
Rule of law: 44.3 / 100. Below the halfway mark of governments measured. World Bank WGI 2024
Regulatory quality: 46.6 / 100. Below the halfway mark of governments measured. World Bank WGI 2024
Robinah NabbanjaPrime Minister
ParliamentLegislature, unicameral
Last election15 January 2026
Constitution1995, as revised to 2017
Government typepresidential republic
Uganda national goals: what has been pledged, and how far it has got · each pledge measured against this country's own recorded delivery
2030
30% of land protected
! behind
Target 3 of the Kunming-Montreal Global Biodiversity Framework, adopted by more than 190 parties in December 2022. Uganda currently protects 16.1% of its land, which is 54% of the way to the pledge. ↗
2030
Paris Agreement pledge
on record
Uganda has a Nationally Determined Contribution lodged with the UNFCCC. The registry holds the current text, its target year and the sectors it covers. ↗
Plastic policy
in force, weakly enforced
Plastic bag (kaveera) ban legislated but weakly enforced.
Grid, as it stands
90% renewable
Recorded renewable share of electricity output, the number every energy pledge is measured against. ↗
Plain Answers About Uganda.
The questions people actually type, answered in full sentences from the sourced data above.
swipe →
Is Uganda sustainable?
Uganda scores 70 out of 100 on the Throne Eco Index, across twelve equally weighted pillars. A green, water rich equatorial country whose forests shelter roughly half the planet's mountain gorillas, though safe drinking water and enforced pollution rules lag well behind.
Is the water in Uganda safe and plentiful?
Uganda sits on abundant fresh water, including Lake Victoria, Lake Albert and the source of the White Nile, so raw supply is rarely the problem. The gap is treatment and access: only about 18% of people have safely managed drinking water (World Bank and JMP, 2024) and tap water is generally unsafe to drink. Many rural households rely on untreated lake, river or borehole water, which drives recurring cholera outbreaks.
Can Uganda feed itself?
Agriculture employs around two thirds of Ugandans and the country grows most of what it eats. Staples such as matoke (steamed plantain), cassava, sweet potato, millet, beans and groundnuts come from smallholder plots, and food import dependence is low. Fertile soils and a bimodal rainfall pattern support two harvests a year in much of the country.
Is it easy to eat plant-based in Uganda?
The everyday Ugandan plate is built on plants: matoke, cassava, sweet potato, beans, groundnut sauce and cooked greens such as dodo and nakati. Fresh produce is cheap and sold daily in local markets, so unprocessed plant eating is the default rather than a lifestyle choice. Meat and fish tend to be eaten when affordable rather than at every meal.
How much of Uganda is actually protected?
About 16% of Uganda's land is protected (World Bank, 2025), spread across ten national parks including Bwindi, Queen Elizabeth, Murchison Falls and Kidepo. Gorilla and chimpanzee tourism helps fund ranger patrols and community revenue sharing, which supports enforcement. Encroachment for farming, charcoal and wetland reclamation remains a serious pressure.
What wildlife is left in Uganda?
Uganda is one of Africa's richest wildlife countries, home to roughly half the world's remaining mountain gorillas in Bwindi and Mgahinga, plus chimpanzees, tree climbing lions and over 1,000 bird species. It straddles the Albertine Rift, a centre of endemism, and lists 322 IUCN threatened species (2023). This concentration of iconic and endemic life is a genuine global draw.
Is Uganda on clean energy?
Uganda's electricity is almost entirely renewable, with large hydropower on the Nile (plants such as Bujagali, Isimba and Karuma) supplying roughly 90% or more of generation and the grid as a whole close to fully renewable. Territorial CO2 emissions are among the lowest in the world at about 0.13 tonnes per person (2024), a small fraction of the global average. The country has a low-emission development strategy and updated climate commitments under the Paris Agreement.
How polluted is Uganda?
Air quality is moderate to poor, with a modelled PM2.5 annual mean around 31 micrograms per cubic metre (World Bank, 2023), driven by charcoal and biomass burning and vehicle smoke in Kampala. Uganda has legislated bans on thin plastic bags (kaveera) more than once, but enforcement is weak and litter is common in towns.
Does recycling work in Uganda?
There is no reliable municipal recycling rate. What recovery happens is largely informal: waste pickers collect PET bottles, scrap metal and cardboard, and organic waste is often composted or fed to livestock. Formal kerbside recycling systems are minimal.
Is the farming in Uganda organic?
Certified organic farmland is about 0.8% of agricultural land (FiBL, 2020), which places Uganda in a low band by area. In practice Uganda has one of the largest populations of certified organic farmers in Africa and a genuine organic export sector in coffee, cotton and cocoa, and most smallholdings use few or no synthetic inputs by default.
Are there natural materials and craft in Uganda?
Uganda keeps a living natural materials tradition in barkcloth, made from the inner bark of the Mutuba fig and recognised by UNESCO as intangible cultural heritage. Basketry, mat weaving and home grown cotton add to a real craft base that still relies on plant fibres rather than plastics.
Is there living culture in Uganda?
Uganda has strong living communities, from the Baganda to the Batwa and Karamojong, and community tourism is real, with gorilla permit revenue sharing funding schools, clinics and enterprises around Bwindi. The record is not clean: the Batwa were evicted from Bwindi and Mgahinga when the parks were gazetted and remain marginalised conservation refugees.
What heritage does Uganda keep alive?
Uganda holds exceptionally deep living heritage across its kingdoms and peoples. Royal Kiganda dances such as Bakisimba, Nankasa and Muwogola, Acholi Larakaraka and Bwola, and Ankole Ekitaguriro are still danced to ngoma drumming, amadinda and akadinda xylophones and the endongo lyre and adungu harp. Ancestral traditions remain widely alive, including the Empaako naming system, Bigwala gourd trumpet music, the Imbalu circumcision ceremony of the Bagisu and barkcloth making of the Baganda, several inscribed on UNESCO's heritage lists.
So is Uganda actually green? The measured answer
What is working: renewable electricity at 90%.
What is not: the gaps are narrower here than in most of the directory, and each remaining one is named below.
Uganda sits 29 of 77 at 68/100. Every name links to its own destination page, built exactly like this one. The full ranking →
What is Uganda particularly good at?
✓Energy, scored 5/5. Uganda's electricity is almost entirely renewable, with large hydropower on the Nile (plants such as Bujagali, Isimba and Karuma) supplying roughly 90% or more of generation and the grid as a whole close to fully renewable. Territorial CO2 emissions are among the lowest in the world at about 0.13 tonnes per person (2024), a small fraction of the global average. The country has a low-emission development strategy and updated climate commitments under the Paris Agreement. A real forward risk is the Lake Albert oil development and the East African Crude Oil Pipeline, which could raise emissions and shift Uganda towards fossil-fuel exports.
✓Food and farming, scored 5/5. Agriculture employs around two thirds of Ugandans and the country grows most of what it eats. Staples such as matoke (steamed plantain), cassava, sweet potato, millet, beans and groundnuts come from smallholder plots, and food import dependence is low. Fertile soils and a bimodal rainfall pattern support two harvests a year in much of the country.
✓Heritage, scored 5/5. Uganda holds exceptionally deep living heritage across its kingdoms and peoples. Royal Kiganda dances such as Bakisimba, Nankasa and Muwogola, Acholi Larakaraka and Bwola, and Ankole Ekitaguriro are still danced to ngoma drumming, amadinda and akadinda xylophones and the endongo lyre and adungu harp. Ancestral traditions remain widely alive, including the Empaako naming system, Bigwala gourd trumpet music, the Imbalu circumcision ceremony of the Bagisu and barkcloth making of the Baganda, several inscribed on UNESCO's heritage lists. The kingdoms of Buganda, Bunyoro, Toro and Busoga and the forest knowledge of the Batwa keep these practices rooted in daily life.
Where does Uganda score worst?
✕Pollution, scored 2/5. Air quality is moderate to poor, with a modelled PM2.5 annual mean around 31 micrograms per cubic metre (World Bank, 2023), driven by charcoal and biomass burning and vehicle smoke in Kampala. Uganda has legislated bans on thin plastic bags (kaveera) more than once, but enforcement is weak and litter is common in towns.
✕Recycling, scored 2/5. There is no reliable municipal recycling rate. What recovery happens is largely informal: waste pickers collect PET bottles, scrap metal and cardboard, and organic waste is often composted or fed to livestock. Formal kerbside recycling systems are minimal.
✕Water, scored 2/5. Uganda sits on abundant fresh water, including Lake Victoria, Lake Albert and the source of the White Nile, so raw supply is rarely the problem. The gap is treatment and access: only about 18% of people have safely managed drinking water (World Bank and JMP, 2024) and tap water is generally unsafe to drink. Many rural households rely on untreated lake, river or borehole water, which drives recurring cholera outbreaks.
Similar countries doing it better and worse
TanzaniaScored on the same twelve pillars as Uganda.73
EthiopiaScored on the same twelve pillars as Uganda.72
KenyaScored on the same twelve pillars as Uganda.68
EgyptScored on the same twelve pillars as Uganda.60
BotswanaScored on the same twelve pillars as Uganda.57
SeychellesScored on the same twelve pillars as Uganda.57
A note from the lens of mother natureswipe →
Energy, 5/5
Uganda's electricity is almost entirely renewable, with large hydropower on the Nile (plants such as Bujagali, Isimba and Karuma) supplying roughly 90% or more of generation and the grid as a whole close to fully renewable. Territorial CO2 emissions are among the lowest in the world at about 0.13 tonnes per person (2024), a small fraction of the global average.
Food and farming, 5/5
Agriculture employs around two thirds of Ugandans and the country grows most of what it eats. Staples such as matoke (steamed plantain), cassava, sweet potato, millet, beans and groundnuts come from smallholder plots, and food import dependence is low.
Heritage, 5/5
Uganda holds exceptionally deep living heritage across its kingdoms and peoples. Royal Kiganda dances such as Bakisimba, Nankasa and Muwogola, Acholi Larakaraka and Bwola, and Ankole Ekitaguriro are still danced to ngoma drumming, amadinda and akadinda xylophones and the endongo lyre and adungu harp.
The Uganda Directory.
Everything on Hold The Throne that sits in Uganda, checked and listed.
World Bank Worldwide Governance Indicators, 2024. Percentile among all governments measured.
Government effectiveness
44.5 / 100
World Bank Worldwide Governance Indicators, 2024. Percentile among all governments measured.
Rule of law
44.3 / 100
World Bank Worldwide Governance Indicators, 2024. Percentile among all governments measured.
Political stability
48.4 / 100
World Bank Worldwide Governance Indicators, 2024. Percentile among all governments measured.
Voice and accountability
39.1 / 100
World Bank Worldwide Governance Indicators, 2024. Percentile among all governments measured.
Environmental Performance Index
35.8 / 100 · 154 of 180
Yale Environmental Performance Index 2024, ranked 154 of 180 countries assessed.
Ecosystem vitality
45.6 / 100 · 122 of 180
Yale Environmental Performance Index 2024, ranked 122 of 180 countries assessed.
Biodiversity and habitat
51.9 / 100 · 78 of 180
Yale Environmental Performance Index 2024, ranked 78 of 180 countries assessed.
Air pollution
54.5 / 100 · 130 of 180
Yale Environmental Performance Index 2024, ranked 130 of 180 countries assessed.
Terrestrial biomes protected
59.0 / 100 · 77 of 180
Yale Environmental Performance Index 2024, ranked 77 of 180 countries assessed.
How Uganda Is Scored. The Throne Standard.
Every destination on the index is scored the same way, so a 4 in Barbados means exactly what a 4 means in Iceland. No self-declared data and no brochure claims are accepted. Every figure on this page carries its named source and year, and the history on each page names what empire took as plainly as it scores the present.
The 12 pillars every destination is scored on, equally weighted
01
Conservation
Land and sea actually protected, not pledged
02
Wildlife
What survives, what is endemic, what is lost
03
Water
Fresh water per person, and the ocean’s health
04
Food & farming
Whether the place can feed itself
05
Organic & clean
Certified land and pesticide reality
06
Climate & energy
Emissions per person, how the grid is powered
07
Waste
Where the rubbish goes, what comes back
08
Health
What people eat and die of
09
Heritage
Living culture, and what the law keeps standing
10
Ownership
Who owns the economy, how much of a dollar stays
11
Governance
Freedom, honesty, promises kept
12
Future
Measured trends run forward, pledges against pace
What each 0 to 5 pillar score means, in plain words
The institutions above are the ones cited on this page, ranked by how many of its figures they carry. This same sectioned page renders for all 77 scored destinations, each with its own researched history, comparison charts and three-way future. Read the full methodology
Every figure on this page, and where it came from: 85 sources across 27 institutions
GBIF occurrence search18 FIGURES
Uganda, IUCN category Critically Endangered, class Mammalia, Critically Endangered on the IUCN Red List, and recorded in Uganda in GBIF occurrence data (mammal). check
Uganda, IUCN category Critically Endangered, class Mammalia corroboration check
Uganda, IUCN category Critically Endangered, class Mammalia corroboration check
Uganda, IUCN category Critically Endangered, class Mammalia corroboration check
Uganda, IUCN category Critically Endangered, class Aves, Critically Endangered on the IUCN Red List, and recorded in Uganda in GBIF occurrence data (bird). check
Uganda, IUCN category Critically Endangered, class Aves corroboration check
Uganda, IUCN category Critically Endangered, class Aves corroboration check
Uganda, IUCN category Critically Endangered, class Aves corroboration check
Uganda, IUCN category Critically Endangered, class Aves corroboration check
Uganda, IUCN category Critically Endangered, kingdom Plantae, Critically Endangered on the IUCN Red List, and recorded in Uganda in GBIF occurrence data (plant). check
Uganda country profile (compiled from Uganda's own national reports), Uganda is one of Africa's richest wildlife countries, home to roughly half the world's remaining mountain gori check
Uganda country profile (compiled from Uganda's own national reports) corroboration check
Uganda country profile (compiled from Uganda's own national reports) corroboration check
Uganda country profile (compiled from Uganda's own national reports) corroboration check
Uganda country profile (compiled from Uganda's own national reports) corroboration check
Uganda country profile (compiled from Uganda's own national reports) corroboration check
UNESCO Intangible Cultural Heritage5 FIGURES
Barkcloth making in Uganda (Representative List), Uganda keeps a living natural materials tradition in barkcloth, made from the inner bark of the Mutuba fig and check
Barkcloth making in Uganda (Representative List) corroboration check
Uganda: elements inscribed on the Lists corroboration check
Uganda: elements inscribed on the Lists corroboration check
Uganda: elements inscribed on the Lists corroboration check
FiBL and IFOAM Organics International3 FIGURES
The World of Organic Agriculture, Statistics and Emerging Trends 2026, In practice Uganda has one of the largest populations of certified organic farmers in Africa and a genuine org check
The World of Organic Agriculture, Statistics and Emerging Trends 2026 corroboration check
The World of Organic Agriculture, Statistics and Emerging Trends 2026 corroboration check
IUCN Red List Categories and Criteria3 FIGURES
version 3.1, second edition (2012), Critically Endangered, the last IUCN category before Extinct in the Wild, and still recorded in Uganda. check
version 3.1, second edition (2012) corroboration check
version 3.1, second edition (2012) corroboration check
Our World in Data3 FIGURES
CO2 emissions per capita (Global Carbon Project), 2024 check
CO2 emissions per capita, from the Global Carbon Budget 2025 (Global Carbon Project), Territorial CO2 emissions are among the lowest in the world at about 0.13 tonnes per person (2024), a small fr check
CO2 emissions per capita, from the Global Carbon Budget 2025 (Global Carbon Project) corroboration check
The London Gazette3 FIGURES
Issue 26523, page 3509, Tuesday 19 June 1894, Foreign Office notice of 18 June 1894, Britain declared the Uganda Protectorate in 1894 and ruled substantially through Buganda. check
Issue 26523, page 3509, Tuesday 19 June 1894, Foreign Office notice of 18 June 1894 corroboration check
Issue 26523, page 3509, Tuesday 19 June 1894, Foreign Office notice of 18 June 1894 corroboration check
Uganda Wildlife Authority3 FIGURES
national protected-area and wildlife authority check
Bwindi Impenetrable National Park corroboration check
Bwindi Impenetrable National Park corroboration check
UNESCO3 FIGURES
Representative List of the Intangible Cultural Heritage, Barkcloth making in Uganda, inscribed 2008 check
Representative List of the Intangible Cultural Heritage, Uganda check
BirdLife International, IUCN and UNEP-WCMC2 FIGURES
UN SDG Global Database, terrestrial Key Biodiversity Areas covered by protected areas (%) ER_PTD_TERR, Uganda, 2025 (60.2%), country-reported check
UN SDG Global Database, freshwater Key Biodiversity Areas covered by protected areas (%) ER_PTD_FRHWTR, Uganda, 2025 (47.9%), country-reported check
FAO2 FIGURES
FAOSTAT Crops and Livestock Products (QCL), Africa bulk data file, released 23 December 2025, By tonnage, the largest crops grown in Uganda are plantains and cooking bananas, sugarcane, maize, cassava and check
FAOSTAT Crops and Livestock Products (QCL), Africa bulk data file, released 23 December 2025 corroboration check
FAO, Global Forest Resources Assessment2 FIGURES
UN SDG Global Database, forest area (% of land area) AG_LND_FRST, Uganda, 2025 (11.8%), country-reported check
UN SDG Global Database, forest area inside legally established protected areas (%) AG_LND_FRSTPRCT, Uganda, 2025 (53.9%), country-reported check
WHO/UNICEF Joint Monitoring Programme2 FIGURES
UN SDG Global Database, population using safely managed drinking water (%) SH_H2O_SAFE, Uganda, 2024 (18.1%), modelled estimate check
UN SDG Global Database, population using safely managed sanitation (%) SH_SAN_SAFE, Uganda, 2024 (20.4%), modelled estimate check
CBD1 FIGURE
Kunming-Montreal Global Biodiversity Framework Target 3 check

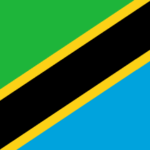 TanzaniaScored on the same twelve pillars as Uganda.73
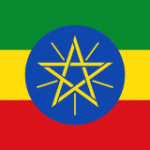 EthiopiaScored on the same twelve pillars as Uganda.72
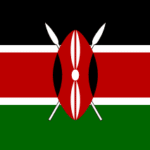 KenyaScored on the same twelve pillars as Uganda.68
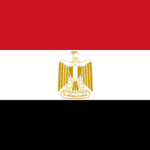 EgyptScored on the same twelve pillars as Uganda.60
 BotswanaScored on the same twelve pillars as Uganda.57
 SeychellesScored on the same twelve pillars as Uganda.57