Destinations › Africa · The Destination Index · universal template · every figure sourced
Zambia.
Southern Africa, east of Angola, south of the Democratic Republic of the Congo. 752,618 sq km and 21,913,874 people, landlocked, with no coastline at all, tropical; modified by altitude; rainy season (October to April).
Region · AfricaPopulation · ~21,913,874Languages · Bemba, Nyanja, Tonga, Lozi, Chewa. English is officialEco Index · 65/100 · Passable
The Eco Index across 12 pillars · scored 0 to 5 · World Bank, OWID, WHO/UNICEF JMP, FiBL, Protected Planet, IUCN, UNESCO (2023-24)
Conservation
Wildlife
Water
Food & farming
Organic & clean
Climate & energy
Waste
Health
Heritage
Ownership
Governance
Future
The History of Zambia.
Zambia sustains a calendar of living traditional ceremonies that remain central to community and spiritual life. The Lozi Kuomboka sees the Litunga move by royal barge from the flooding Barotse plain, while the Ngoni Nc'wala gives first fruits thanks to the ancestors for the harvest.
Where the name comes from
For the Zambezi, from a Tonga name for the river. From 1911 to 1964 it was Northern Rhodesia; it took its own name at independence. Source: UK Permanent Committee on Geographical Names toponymic factfile.
The land itself: a high plateau across most of the country, with hills and mountains along its edges. Its high point is Mafinga Central, 2,330 m. Source: Survey Department, the national mapping agency, with the UK Permanent Committee on Geographical Names.
Where it starts
Wood that should not have survived
Two large logs, shaped with stone tools and joined by a deliberately cut notch, were preserved in the waterlogged bank of the Kalambo river. They are around 476,000 years old and are the earliest structural use of wood found anywhere in the world, from a time before our own species existed. The same ground held a wedge, a digging stick and a notched branch from 390,000 to 324,000 years ago. The Kabwe skull, found at Broken Hill in 1921 and around 299,000 years old, is one of the best preserved fossils of its age in Africa. It is still held in London, and Zambia has asked for its return.
How it got here
Kingdoms, then copper
The Lozi kingdom on the upper Zambezi floodplain, the Bemba in the north-east, and Chewa and Lunda states held territory with their own courts and succession. A chartered company took control in the 1890s and the territory was administered as Northern Rhodesia. Industrial copper mining from the 1920s reshaped the economy, labour and settlement of the country, and independence came on 24 October 1964.
The timeline
c. 476,000 years ago
Kalambo Falls.
Two large logs shaped with stone tools and joined by a cut notch are the earliest structural use of wood found anywhere in the world, from a time before our own species existed. ↗
c. 390,000 to 324,000 years ago
Wooden tools.
The same waterlogged riverbank preserved a wedge, a digging stick, a cut log and a notched branch, wood that almost never survives this long. ↗
c. 299,000 years ago
The Kabwe skull.
A human skull found at Broken Hill in 1921 is one of the best preserved fossils of its age in Africa. It is still held in London, and Zambia has asked for its return. ↗
c. 20,000 years ago onward
The Zambezi and its people.
Communities lived along the Zambezi and across the central plateau for tens of thousands of years, leaving stone tools and rock art. ↗
c. AD 300 onward
Farming and iron.
Farming, cattle-keeping and ironworking communities settle across the plateau, leaving Early Iron Age villages such as Chondwe near Ndola with their own pottery, iron smelting furnaces and worked copper. ↗
15th to 16th century
Ingombe Ilede.
A major trading settlement near the confluence of the Zambezi and Lusitu rivers, dealing above all in salt, and connected to the gold and ivory routes running to the Indian Ocean coast. ↗
17th to 19th century
Kingdoms of the plateau.
The Lozi kingdom on the upper Zambezi floodplain, the Bemba in the north-east and the Chewa and Lunda states hold territory with their own courts and succession. ↗
1890s
British South Africa Company rule.
A chartered company takes control of the territory, later administered as Northern Rhodesia. ↗
1920s onward
The Copperbelt.
Industrial copper mining reshapes the economy, labour and settlement of the country. ↗
1964
Independence.
Northern Rhodesia becomes Zambia on 24 October 1964, after a transition led by UNIP. ↗
Zambia protects about 41.3% of its land (World Bank, 2025) through vast national parks such as Kafue, one of Africa's largest, plus South Luangwa and Lower Zambezi, and a ring of Game Management Areas. The headline figure is undercut by funding: many Game Management Areas are under resourced and poaching remains a real pressure, so paper coverage exceeds effective protection.
Is wild Zambia protected? 41.3% of the land is, already past the 30% target for 2030
Found only here. Kafue lechwe, black lechwe and Thornicroft's giraffe; the Bangweulu shoebill
The watchlist
ThreatenedAfrican elephant (Loxodonta africana)Endangered on the IUCN Red List, and recorded in Zambia in GBIF occurrence data (mammal), with the species named and its Red List assessment linked.
ThreatenedGyps africanusCritically Endangered on the IUCN Red List, and recorded in Zambia in GBIF occurrence data (bird), with the species named and its Red List assessment linked.
ThreatenedLycaon pictusEndangered on the IUCN Red List, and recorded in Zambia in GBIF occurrence data (mammal), with the species named and its Red List assessment linked.
ThreatenedNecrosyrtes monachusCritically Endangered on the IUCN Red List, and recorded in Zambia in GBIF occurrence data (bird), with the species named and its Red List assessment linked.
ThreatenedTrigonoceps occipitalisCritically Endangered on the IUCN Red List, and recorded in Zambia in GBIF occurrence data (bird), with the species named and its Red List assessment linked.
ThreatenedBateleur (Terathopius ecaudatus)Endangered on the IUCN Red List, and recorded in Zambia in GBIF occurrence data (bird), with the species named and its Red List assessment linked.
ThreatenedBalearica regulorumEndangered on the IUCN Red List, and recorded in Zambia in GBIF occurrence data (bird), with the species named and its Red List assessment linked.
Critically Endangered, the last IUCN category before Extinct in the Wild, and still recorded in Zambia, with the species named and its Red List assessment linked. GBIF holds 358 verified occurrence records.
Necrosyrtes monachus
Critically Endangered, the last IUCN category before Extinct in the Wild, and still recorded in Zambia, with the species named and its Red List assessment linked. GBIF holds 178 verified occurrence records.
Trigonoceps occipitalis
Critically Endangered, the last IUCN category before Extinct in the Wild, and still recorded in Zambia, with the species named and its Red List assessment linked. GBIF holds 46 verified occurrence records.
Species named here are drawn from GBIF occurrence records for Zambia filtered to the IUCN Red List threatened categories. Species are listed where GBIF holds occurrence records for them in this country. Record counts are not published here because the figure cannot be reproduced from a public GBIF query.
National park in Lusaka Province, mapped and named in the open record for Zambia. OpenStreetMap.
Water and Ocean in Zambia.
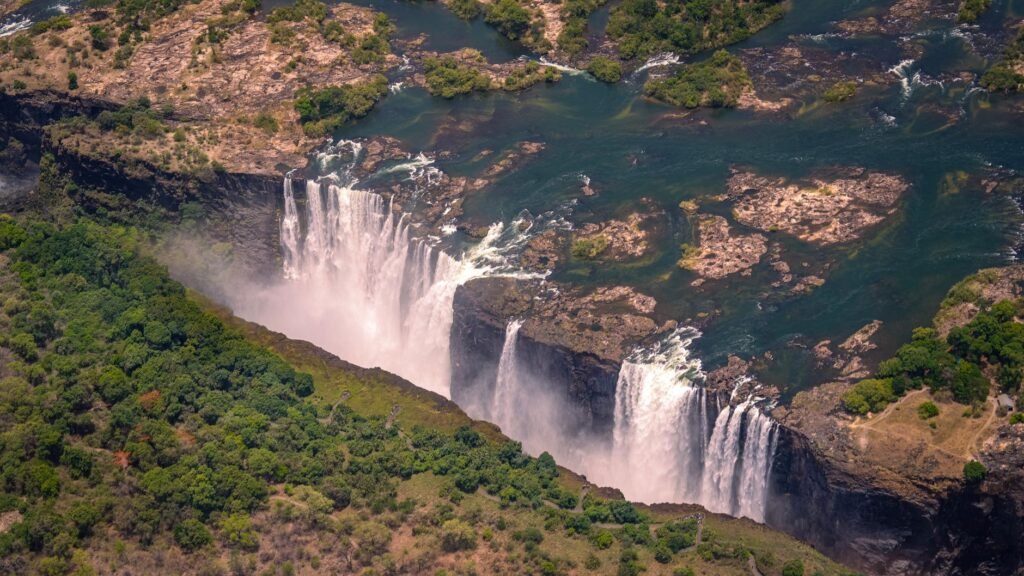
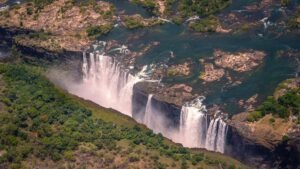
Zambia is exceptionally water rich on paper, with the Zambezi, Kafue and Luangwa rivers, Lake Tanganyika, the huge Kariba reservoir, the Bangweulu wetlands and Victoria Falls. Access is the weak point: about 73% of people have at least basic drinking water (World Bank and JMP, 2024), safely managed coverage is lower, and tap water is generally unsafe. Heavy reliance on Kariba hydro also left supply exposed during the 2024 drought.
Does Zambia have enough fresh water? Yes, with headroom
Bottled water; treat all drinking water on safari.
Cleanest water: Lake Tanganyika and the upper Zambezi
How much fresh water does Zambia have, per person?
3,980 m³
Zambia
1,000 m³
the UN “water scarce” line
Zambia withdraws about 1,572 million cubic metres of fresh water a year (2022). That is 2.8% of the fresh water actually available to it, which FAO counts as no water stress. Of what is taken, farming takes 73%, homes and towns 18%, industry 8%. Source: FAO AQUASTAT.
How hard is the water supply being pushed?
Of every 10 buckets nature refills, 0 are already taken. Withdrawals run at 2.8% of what Zambia renews internally each year (2022, World Bank / FAO AQUASTAT). That is inside the 25% mark generally treated as water stress, so the supply has headroom.
When is the best time to visit Zambia? Tap your month.
Tap your month.
JanFebMarAprMayJunJulAugSepOctNovDec
.
How much fresh water does Zambia actually have?
Nature renews about 3,980 cubic metres of fresh water per person per year here. That ranks Zambia 127 of 208 countries measured, putting it in the wetter half of the world. The UN treats anything under 1,000 cubic metres as water scarce, and this is above that line. World Bank / FAO AQUASTAT.
Farming underpins the economy and Zambia is usually self sufficient in its maize staple, nshima, sometimes exporting surplus to neighbours. Production is dominated by smallholders, but the system is narrow and rain dependent, and the 2024 drought turned a normal surplus into an emergency maize deficit.
Where does the food in Zambia come from?
7.8% imported
about US$1,031m a year
On the plate: Nshima (maize meal), beans, groundnuts, cooked greens such as rape and pumpkin leaves, sweet potato and cassava
How often each food is on the plate
Share of people eating each one regularly. These overlap, so they do not add up to 100%.
Rape60%
Pumpkin leaves51%
Sweet potato42%
Cassava33%
1 of 10
bites are imported
The island buys in more food energy than it eats. About US$1,031m a year leaves the country to pay for it. The green slice is roughly what still grows here.
Food is 7.8% of everything Zambia imports (2024, World Bank). Farming itself is 4.1% of the economy and 32.1% of the land is agricultural, of which 5.1% is arable. The green slice is roughly what still grows here.
What is killing people in Zambia? The imported diet.
Cause of death, and the diet behind it.
Non-communicable diseases, all combined31.2%
Diabetes10.3%
Adults living with overweight or obesity. 29.9%.
Can Zambia feed itself?
5.1%
Arable land
32.1%
Agricultural land
4,368,486
Farmers
9,389,990
Arable acres
4.1%
Agriculture, share of GDP
Harvest: Maize harvest April to July after the November to April rains
Feeding itself
Farming underpins the economy and Zambia is usually self sufficient in its maize staple, nshima, sometimes exporting surplus to neighbours. Production is dominated by smallholders, but the system is narrow and rain dependent, and the 2024 drought turned a normal surplus into an emergency maize deficit.
Certification
Certified organic farmland is negligible, around 0.003% of agricultural land (FiBL, 2020). As across much of the region, many smallholders farm with few synthetic inputs out of necessity, but almost none of this is certified organic.
Water for crops
Zambia is exceptionally water rich on paper, with the Zambezi, Kafue and Luangwa rivers, Lake Tanganyika, the huge Kariba reservoir, the Bangweulu wetlands and Victoria Falls. Access is the weak point: about 73% of people have at least basic drinking water (World Bank and JMP, 2024), safely managed coverage is lower, and tap water is generally unsafe.
Why the organic number looks like that. Certified-organic farmland is not separately reported for Zambia, and that is a certification gap rather than proof nothing is grown cleanly. What the official land record does show: 32.1% of the country is agricultural land and 5.1% is arable (2023, World Bank). Certification is paid for per farm per year by a foreign body, which prices out smallholders, so the organic number reads worse than the practice.
The plant-based kitchen here is not an import. By tonnage, the largest crops grown in Zambia are sugarcane, cassava and maize (FAO, FAOSTAT crop production, 2024). That is what the land itself puts on a plate.
Buy direct where residents buy: Freedom Market, Game Market, Gondwe Market, Ikelenge Market, Jack Public Market, Kabanana Market. Each is a mapped, named marketplace, so the money stays with the seller rather than the importer. OpenStreetMap.
Is this grown in Zambia?
Tap a food for the honest answer.
BeansGroundnutsCooked greens such as rapePumpkin leavesSweet potatoCassava
.
BeansGroundnutsCooked greens such as rapePumpkin leavesSweet potatoCassava
Zambia's electricity is overwhelmingly renewable, with hydropower supplying roughly 84 per cent of generation, chiefly from the Kafue Gorge and Kariba stations. Emissions per person are very low at around 0.54 tonnes of CO2 a year, among the lowest in the world. The country's NDC 3.0, submitted in 2025, pledges to cut emissions by 25 per cent unconditionally and up to 47 per cent with international support by 2030, anchored in the National Policy on Climate Change and Vision 2030. Severe drought has recently cut Kariba output and exposed the grid's dependence on rainfall, prompting a pivot towards solar. On balance Zambia is a very low emitter running on clean power with credible policy.
What powers Zambia?
Renewable 87.5%Fossil 12.5%
Climate pollution per person
The safe amount, what the planet can absorb
2 tonnes
One person here
0.54 tonnes
The world average, for comparison
4.7 tonnes
The worst it ever got
0.97 tonnes
The grid
Zambia's electricity is overwhelmingly renewable, with hydropower supplying roughly 84 per cent of generation, chiefly from the Kafue Gorge and Kariba stations. Emissions per person are very low at around 0.54 tonnes of CO2 a year, among the lowest in the world.
Pollution
The national PM2.5 annual mean is moderate, around 20 micrograms per cubic metre (World Bank, 2023), and Zambia has banned thin single use plastic bags, though enforcement is patchy. The bigger issue is severe localised pollution: copper smelting on the Copperbelt and the notorious legacy lead contamination at Kabwe, one of the most polluted places on Earth.
Water stress
Zambia is exceptionally water rich on paper, with the Zambezi, Kafue and Luangwa rivers, Lake Tanganyika, the huge Kariba reservoir, the Bangweulu wetlands and Victoria Falls. Access is the weak point: about 73% of people have at least basic drinking water (World Bank and JMP, 2024), safely managed coverage is lower, and tap water is generally unsafe.
What pollutes most here
1The gridThe share of electricity still generated from fossil fuel.8%
2IndustryCopperbelt smelting and the lead contaminated town of Kabwe.named
3AirModelled annual mean against a WHO guideline of 5 µg/m³.20.2
4On the recordThe national PM2.5 annual mean is moderate, around 20 micrograms per cubic metre (World Bank, 2023), and Zambia has banned thin single use plastic bags, though enforcement is patchy.
What has Zambia promised on climate?
Electricity renewable today92% (2021)
Land protected, against a 30% target41.3% by 2025
Measured on delivery, 92% of electricity is already renewable (2021, World Bank), so 8% of the grid is still to be converted. The pledge on file is measured here against what has actually been delivered, not taken on its own (UNFCCC NDC Registry, CBD Kunming-Montreal Target 3).
The biggest line item
One return flight against a whole year of living.
A resident's entire year0.54 t CO2e
Safe-climate budget, per year2 t CO2e
Los Angeles return, economy2.9 t CO2e
New York return, economy2.18 t CO2e
Sydney return, economy2.14 t CO2e
Singapore return, economy1.54 t CO2e
London return, economy1.43 t CO2e
How much CO2 does flying to Zambia emit?
Tap where you would fly from. One return flight, economy.
Every prompt runs on a machine in a building on somebody’s grid. What that costs the planet depends less on the prompt than on what is burning to power it. Here is what would power one in Zambia.
Data centres
5
Registered colocation and interconnection facilities, PeeringDB, 2026
Grid renewable
87.5 %
What a machine here runs on.
What powers a data centre in Zambia?
Running AI here is about as clean as it currently gets.
Renewable 87.5%Fossil 12.5%
Cooling water. Every one of those halls runs on the national grid, which is 92% renewable today (World Bank). A data centre is only as clean as the electricity behind it, so the same figure that decides this country's climate score also decides the footprint of the AI running inside it. Cooling water use is not separately published by facility, and no operator here reports it.
The rules. Zambia has 5 colocation and interconnection facilities on the public PeeringDB register, concentrated in Lusaka (4), Kitwe (1), alongside 1 internet exchange (Lusaka Internet Exchange Point). Named sites include NetOne Data Lusaka, INFRATEL Data Centre, Production Centre, INFRATEL Data Centre, Backup Facility, INFRATEL Data Centre, Disaster Recovery.
95% residents to 5% visitors across a year. 1,266,000 international arrivals in 2019 against 21,913,874 people who live here (2025, World Bank / UN Tourism).
Where a visitor dollar goes in Zambia
502k
Visitors a year
0.0
Visitors per resident
How deep in debt is Zambia?· for every $100 Zambia earns in a year, it owes…
Pay to the order of: the creditorsmemo · the 2000 peak
$ 261The worst year on the IMF record. Zambia owed $261 for every $100 it earned.
IMF World Economic Outlook, 2000signed, the creditors
Pay to the order of: the creditorsmemo · today
$ 86What is owed now, for every $100 of national income (2025).
IMF World Economic Outlook, 2025signed, the creditors
For every $100 Zambia earns in a year, it owes $86 (2025, IMF World Economic Outlook). The interest on that is paid before schools, clinics or coastline get their turn.
Where does a tourist dollar actually go in Zambia?
Play one tourist dollar around the board. Every square is a measured fact from this page.
START!
1
GO: a visitor lands
$100 goes on the table. 1,266,000 international arrivals in 2019 against 21,913,874 residents, one visitor a year for every 17 residents (World Bank / UN Tourism).
$100 in play
2
The bed
Who owns the largest places to stay in Zambia is not published in the records we can check, so this square is left open rather than guessed. Where a listing names its owner, it is shown in the ownership table below.
not published
3
The plate
Food is only 7.8% of everything Zambia imports (2024, World Bank), so most of a meal is bought from producers inside the country. Eating what the land here actually grows, sugarcane, cassava, maize, soybeans, vegetables, wheat, groundnuts, sweet potatoes, keeps that money with the grower.
mostly home-grown
4
The power
92% of the electricity is renewable (2021, World Bank), so the energy on the bill is mostly generated inside the country rather than shipped in.
made at home
5
What actually stays
Of the two parts of a visitor's bill that can be measured here, the plate and the power stay inside Zambia. This is not an economy where a visitor's money drains away, and the board is shorter for it.
most of it
6
Pay the bank first
Zambia owes $86 for every $100 it earns (2025, IMF World Economic Outlook). The interest is paid before anything else on this board.
$86 per $100
7
No plan B
64.5% of everything Zambia sells abroad is copper (2023, UN Comtrade). One market moving takes the whole board with it.
64.5% one export
8
The flight
Getting here is usually the biggest single line on the bill. From Los Angeles a return economy seat is 2.90 t CO2, on the UK Government's published conversion factors. It is the one part of the trip this board cannot reduce.
2.90 t CO2
9
Back to GO
The economy turns over about US$41 billion a year (IMF World Economic Outlook, 2026 projection). Every lap of this board is a choice about how much of it stays.
US$41bn
GDPUS$28.9bn
Agriculture, share of GDP4.1%
Visitors a year502,000
Visitors per resident0
Residents~21,913,874
Agriculture
Farming is 4.1% of the economy. Farming underpins the economy and Zambia is usually self sufficient in its maize staple, nshima, sometimes exporting surplus to neighbours.
Natural materials
Zambia keeps living craft traditions in basketry and reed and grass weaving, and grows cotton that feeds the ubiquitous chitenge printed cloth. The crafts are genuine but localised rather than a defining national industry.
Energy
Zambia's electricity is overwhelmingly renewable, with hydropower supplying roughly 84 per cent of generation, chiefly from the Kafue Gorge and Kariba stations. Emissions per person are very low at around 0.54 tonnes of CO2 a year, among the lowest in the world.
Who owns the biggest hotels in Zambia?
By rooms · company records and press.
Taj Pamodzi, Lusaka · ~193 roomsASB Hospitality (Albwardy Group, Dubai), bought a 90% stake from Tata International Singapore for US$18mforeign
InterContinental Lusaka · ~224 roomsQG Africa Hotel LP, a Mauritius-based fund, bought it from Saudi-owned Kingdom Hotel Investments for US$35.9mforeign
Protea Hotels ZambiaUnion Gold Holdings Limited of Zambia, operated under Marriott's Protea brandlocally owned
Visitors, over time
2015932k
2016956k
20171,009k
20181,072k
20191,266k
2020502k
How much of your money actually stays here?
Tap the holiday you are planning.
All-inclusive resortForeign-owned hotel and tourist restaurantsLocally owned stay and local restaurantsGuesthouse, markets and public transport
Resort guest, villa renter, family, nomad or backpacker. The honest playbook for each, from the same sourced numbers.
Already booked a resort? · the rescue list
Five swaps that move your money back on-island
1. Eat where the country eats Choose kitchens cooking nshima (maize meal), beans, groundnuts, cooked greens such as rape and pumpkin leaves, sweet potato and cassava over imported menus. The checked list →
2. Book with a local operator Never the lobby desk. The margin on a tour is the part that stays. Eco tours →
3. Stay somewhere locally owned Ownership decides where the room rate books. Eco stays →
4. Use the transport residents use Charter and scheduled flights to remote parks, 4x4 self drive or transfers, and long distance buses between towns
5. Buy the craft, not the souvenir Natural-materials work made here pays the maker directly; imported gifts pay a shipping line.
swipe →
First time here
A landlocked, water rich country that protects over 40% of its land for wildlife and invented the walking safari, though mining pollution and drought hit hydropower are real strains.
Best time: The dry season for wildlife
Getting around
Charter and scheduled flights to remote parks, 4x4 self drive or transfers, and long distance buses between towns
Transport is where the fare either stays or leaves.
Eating here
The everyday plate is nshima (maize meal), beans, groundnuts, cooked greens such as rape and pumpkin leaves, sweet potato and cassava. The everyday Zambian plate is plant based by default: nshima made from maize meal, served with beans, groundnuts and cooked greens such as rape, pumpkin leaves and cassava leaves, plus sweet potato and cassava.
Eating what the country grows is the cheapest way to cut the import bill.
Good to know
Cash widely used; ZMW. USD accepted at top lodges.
Rate my hotel. Tap yours for the honest verdict.
Ownership from company records and press.
Taj Pamodzi, LusakaInterContinental LusakaProtea Hotels Zambia
.
Who owns the big hotels
Taj Pamodzi, LusakaASB Hospitality (Albwardy Group, Dubai), bought a 90% stake from Tata International Singapore for US$18m · 193 rooms
InterContinental LusakaQG Africa Hotel LP, a Mauritius-based fund, bought it from Saudi-owned Kingdom Hotel Investments for US$35.9m · 224 rooms
Protea Hotels ZambiaUnion Gold Holdings Limited of Zambia, operated under Marriott's Protea brand
Society and Governance in Zambia.
How well is Zambia actually run?
Governance, measured · World Bank WGI
Four measured answers, none of them opinion. Averaged across corruption control, delivery and accountability, Zambia scores 43 out of 100 (2024, World Bank Worldwide Governance Indicators). That matters here because every pledge on this page is only as good as the machinery meant to deliver it.
How well is Zambia run? · each scored out of 100, higher is better
Clean government, scored 39 of 100
Control of corruption scores 38.6 out of 100 (2024, World Bank Worldwide Governance Indicators). That is below the halfway mark of governments measured.
39
Freedom and rights, scored 50 of 100
Voice and accountability, which measures free expression, free media and the ability to choose a government, scores 49.7 out of 100 (2024, World Bank WGI). Citizens have some room to question their government.
50
Government effectiveness, scored 41 of 100
Government effectiveness, which measures the quality of public services and how well policy is actually delivered, scores 41 out of 100 (2024, World Bank WGI). Delivery is rated below average, so a pledge on paper is not the same as a pledge kept.
41
Income equality, scored 52 of 100
The Gini index of income inequality reads 51.5 (2022, World Bank). Zero is perfect equality and 100 is one person holding everything. Above 40 is the level usually treated as socially strained, and Zambia sits above it.
52
LGBTQ+ status: IllegalSolo female travel: Take care71.8% adult literacyIndustry to avoid: Copperbelt smelting and the lead contaminated town of Kabwe
What is daily life in Zambia really like? Measured
Getting around, breathing, throwing away, learning. The honest checklist.
TransportAirWaterWastePower
✓How you get around Charter and scheduled flights to remote parks, 4x4 self drive or transfers, and long distance buses between towns
✓Air quality, measured Modelled annual mean 20.2. The WHO guideline is 5 µg/m³.
✓Where the air is cleanest The remote national parks and Northern Province
·Tap water Not drinkable
✓What to drink Bottled water; treat all drinking water on safari.
✓Plastic rules Ban on plastic carrier and flat bags that do not meet the Zambian Standard, under Statutory Instrument 65 of 2018
✓Sockets and voltage Type C/D/M, 230V
71.8%
literacy. Public spending on education runs at 4.1% of GDP and 14.5% of all government spending, and secondary enrolment stands at 56.8% gross (UNESCO Institute for Statistics, 2023 to 2025).
Made in Zambia.
Zambia keeps living craft traditions in basketry and reed and grass weaving, and grows cotton that feeds the ubiquitous chitenge printed cloth. The crafts are genuine but localised rather than a defining national industry. Every step of processing done at home is value that stops leaving the country.
What Zambia actually sells the world
The single biggest thing Zambia sells the world is copper, 64.5% of all exports in 2023 (about US$6.73 billion, UN Comtrade). The next four are salt, sulphur, stone and cement at 4.9%, mineral fuels and oils at 4.0%, ores, slag and ash at 2.4%, iron and steel at 1.9%.
Sells now · 64.5% of exports
Copper
Copper is 64.5% of everything Zambia sold abroad in 2023, worth about US$6.73 billion. UN Comtrade.
Sells now · 4.9% of exports
Salt, sulphur, stone and cement
Salt, sulphur, stone and cement is 4.9% of everything Zambia sold abroad in 2023, worth about US$0.51 billion. UN Comtrade.
Sells now · 4.0% of exports
Mineral fuels and oils
Mineral fuels and oils is 4.0% of everything Zambia sold abroad in 2023, worth about US$0.42 billion. UN Comtrade.
Sells now · 2.4% of exports
Ores, slag and ash
Ores, slag and ash is 2.4% of everything Zambia sold abroad in 2023, worth about US$0.25 billion. UN Comtrade.
Sells now · 1.9% of exports
Iron and steel
Iron and steel is 1.9% of everything Zambia sold abroad in 2023, worth about US$0.19 billion. UN Comtrade.
Buys in · 12.2% of imports
Machinery and mechanical appliances
Zambia imported US$1.24 billion of machinery and mechanical appliances in 2023, 12.2% of everything it bought abroad, and sells none of it back. Every point of that is a business that could be built at home rather than shipped in. UN Comtrade.
Buys in · 6.8% of imports
Fertilisers
Zambia imported US$0.69 billion of fertilisers in 2023, 6.8% of everything it bought abroad, and sells none of it back. Every point of that is a business that could be built at home rather than shipped in. UN Comtrade.
Buys in · 4.4% of imports
Plastics
Zambia imported US$0.44 billion of plastics in 2023, 4.4% of everything it bought abroad, and sells none of it back. Every point of that is a business that could be built at home rather than shipped in. UN Comtrade.
Buys in · 3.6% of imports
Electrical machinery and electronics
Zambia imported US$0.36 billion of electrical machinery and electronics in 2023, 3.6% of everything it bought abroad, and sells none of it back. Every point of that is a business that could be built at home rather than shipped in. UN Comtrade.
The maths for an entrepreneur. Zambia produces about US$29 billion a year, which is roughly US$1,318 per person (2025, World Bank). Farming is 4.1% of that, while food is 7.8% of everything the country imports. The country buys in more food than its own farms contribute to the economy, and every point of that gap is a business someone could build here rather than ship in. With 5.1% of the land arable, the raw material for that is already in the ground.
A living tradition of Zambia, still practised rather than archived.
Nc'wala first fruits ceremony of the Ngoni
A living tradition of Zambia, still practised rather than archived.
Mutomboko of the Lunda
A living tradition of Zambia, still practised rather than archived.
Ukusefya Pa Ng'wena of the Bemba
A living tradition of Zambia, still practised rather than archived.
Likumbi Lya MizeA living tradition of Zambia, still practised rather than archived.
Makishi masquerade of the LuvaleA living tradition of Zambia, still practised rather than archived.
Does Zambia protect its heritage by law?
Partly, and the gaps say as much as the protections.
What is kept alive. Zambia sustains a calendar of living traditional ceremonies that remain central to community and spiritual life. The Lozi Kuomboka sees the Litunga move by royal barge from the flooding Barotse plain, while the Ngoni Nc'wala gives first fruits thanks to the ancestors for the harvest. Other living observances include the Lunda Mutomboko, the Bemba Ukusefya Pa Ng'wena and the Luvale Likumbi Lya Mize with its Makishi masquerade.
Who it belongs to. Zambia has more than 70 living ethnic groups and vivid traditional ceremonies such as the Lozi Kuomboka, and community based tourism and conservancies operate around the major parks. South Luangwa is the birthplace of the walking safari, and community partnerships channel some tourism income to local people, though a share still concentrates with operators.
Only here. The Kasanka bat migration, about 850,000 straw coloured fruit bats at an automated camera count in November 2019, far fewer than the 10 million long quoted from manual counts, a gap the researchers attribute to counting method rather than a fall in numbers.
Three futures for Zambia, every one run forward from measured data.
Where the making actually happens
Named cultural and craft sites on the open map: st Joseph Home Craft Centre New Kanyama (Lusaka), The Livingstone Museum (Livingstone), Lusaka National Museum (Lusaka), Copperbelt museum (Ndola), Excavation Museum (Livingstone). OpenStreetMap. Named craft workshops on the open map: Curio Stand Mukuni Park, Mukuni Curio Market, Mukuni Park Curio 48, Mukuni Park Curio Office, Mukuni Park Curio Shop-23, Will J Nduna Arts.
Every measured trend on one line
Run forward at the pace already recorded.
-6%
Forest cover
1995: 63.5 % → 2023: 59.5 %
-7%
Renewable electricity
1995: 99.3 % → 2021: 92 %
+103%
CO2 per person
1995: 0.268 t → 2024: 0.543 t
+208%
Tourist arrivals
1995: 163 k → 2020: 502 k
+9%
Protected land
2013: 38 % → 2025: 41.3 %
-27%
Farm workforce
1995: 74.9 % → 2025: 54.5 %
-5%
Renewable energy use
1995: 87.1 % → 2021: 83 %
+21%
Energy per person
1995: 663.3 kg → 2023: 804.2 kg
+9%
Protected area, total
2013: 38 % → 2025: 41.3 %
+44%
Life expectancy
1995: 46.1 yrs → 2024: 66.5 yrs
+76%
Cereal yield
1995: 1331 ha → 2023: 2344 ha
+300%
Fertiliser use
1995: 19.3 ha → 2023: 77.3 ha
-12%
Rural population
1995: 61.6 % → 2025: 54.1 %
+317%
Water productivity
1995: 4 $/m3 → 2022: 16.7 $/m3
+45%
Health spending
2000: 4.12 % → 2023: 5.98 %
-6%
Forest area
1995: 472330 km2 → 2023: 442494 km2
-1%
Electric power use
1995: 734.4 kWh → 2023: 726.7 kWh
+20%
Emissions: Agriculture
1990: 19.9 e → 2023: 23.9 e
+117%
Emissions: Building
1990: 2.69 e → 2023: 5.83 e
+1838%
Emissions: Electricity/Heat
1990: 0.16 e → 2023: 3.1 e
+210%
Emissions: Energy
1990: 5.1 e → 2023: 15.8 e
+370%
Emissions: Industrial Processes
1990: 0.27 e → 2023: 1.27 e
+161%
Emissions: Manufacturing/Construction
1990: 1.34 e → 2023: 3.5 e
+239%
Emissions: Transportation
1990: 0.8 e → 2023: 2.71 e
World Bank open data, recorded series
How much forest is left?
Forest cover moved from 63.5% to 59.5% across 28 recorded years.
World Bank AG.LND.FRST.ZS
How clean is the grid?
Renewable electricity moved from 99.3% to 92.0% across 26 recorded years.
World Bank EG.ELC.RNEW.ZS
How much climate pollution per person?
CO2 per person moved from 0.3 t to 0.5 t across 29 recorded years.
World Bank EN.GHG.CO2.PC.CE.AR5
How many people visit?
Tourist arrivals moved from 163k to 502k across 25 recorded years.
World Bank ST.INT.ARVL
How much land is protected?
Protected land moved from 38.0% to 41.3% across 12 recorded years.
World Bank ER.LND.PTLD.ZS
How many people still farm?
Farm workforce moved from 74.9% to 54.5% across 30 recorded years.
World Bank SL.AGR.EMPL.ZS
What share of all energy is renewable?
Renewable energy use moved from 87.1% to 83% across 26 recorded years.
World Bank EG.FEC.RNEW.ZS
How much energy does one person use?
Energy per person moved from 663.32 kg to 804.22 kg across 28 recorded years.
World Bank EG.USE.PCAP.KG.OE
How much land and sea is protected together?
Protected area, total moved from 38% to 41.3% across 12 recorded years.
World Bank ER.PTD.TOTL.ZS
How long do people live?
Life expectancy moved from 46.05 yrs to 66.53 yrs across 29 recorded years.
World Bank SP.DYN.LE00.IN
How much does a hectare of cereal produce?
Cereal yield moved from 1331 kg/ha to 2344 kg/ha across 28 recorded years.
World Bank AG.YLD.CREL.KG
How much fertiliser goes on the land?
Fertiliser use moved from 19.34 kg/ha to 77.27 kg/ha across 28 recorded years.
World Bank AG.CON.FERT.ZS
How many people still live rurally?
Rural population moved from 61.6% to 54.08% across 30 recorded years.
World Bank SP.RUR.TOTL.ZS
How much value per cubic metre of water?
Water productivity moved from 3.99 $/m3 to 16.65 $/m3 across 27 recorded years.
World Bank ER.GDP.FWTL.M3.KD
How much goes on health?
Health spending moved from 4.12% to 5.98% across 23 recorded years.
World Bank SH.XPD.CHEX.GD.ZS
How much forest is there in total?
Forest area moved from 472330 km2 to 442494 km2 across 28 recorded years.
World Bank AG.LND.FRST.K2
How much electricity per person?
Electric power use moved from 734.37 kWh to 726.74 kWh across 28 recorded years.
World Bank EG.USE.ELEC.KH.PC
How have agriculture emissions moved?
Agriculture emissions moved from 19.92 to 23.86 MtCO2e across 33 recorded years.
Climate Watch (WRI), historical emissions
How have building emissions moved?
Building emissions moved from 2.69 to 5.83 MtCO2e across 33 recorded years.
Climate Watch (WRI), historical emissions
How have electricity/heat emissions moved?
Electricity/Heat emissions moved from 0.16 to 3.1 MtCO2e across 33 recorded years.
Climate Watch (WRI), historical emissions
How have energy emissions moved?
Energy emissions moved from 5.11 to 15.83 MtCO2e across 33 recorded years.
Climate Watch (WRI), historical emissions
How have industrial processes emissions moved?
Industrial Processes emissions moved from 0.27 to 1.27 MtCO2e across 33 recorded years.
Climate Watch (WRI), historical emissions
How have manufacturing/construction emissions moved?
Manufacturing/Construction emissions moved from 1.34 to 3.5 MtCO2e across 33 recorded years.
Climate Watch (WRI), historical emissions
How have transportation emissions moved?
Transportation emissions moved from 0.8 to 2.71 MtCO2e across 33 recorded years.
Climate Watch (WRI), historical emissions
Worst caseCurrent pathBest case
Worst case
Every measured decline continues at the pace already recorded. The weakest pillar, organic farming at 1/5, is the one that gives way first.
Computed from: recorded series extended with no policy change
Current path
Every line above is a recorded World Bank series for this country. The current path is simply those series continuing at the pace already measured.
Computed from: recorded series, no policy change assumed
Best case
The pledges are met on their own stated timetables and the weakest pillars are lifted to match the strongest. Zambia already shows it can do this: heritage scores 5/5.
Computed from: each published target delivered on its own date
What the best case actually asks for
Lift organic farming
It scores 1 out of 5 today, among the weakest parts of Zambia's record. Certified organic farmland is negligible, around 0.003% of agricultural land (FiBL, 2020). As across much of the region, many smallholders farm with few synthetic inputs out of necessity, but almost none of this is certified organic. Lifting it toward the 5/5 the strongest pillars already reach is what the best case turns on.
measured each year
Costs: spending and enforcement, not new technology
Lift recycling
It scores 1 out of 5 today, among the weakest parts of Zambia's record. There is no meaningful formal municipal recycling system and no reliable published rate. Recovery is minimal and informal, limited to some scrap metal and PET collection in the larger cities. Lifting it toward the 5/5 the strongest pillars already reach is what the best case turns on.
measured each year
Costs: spending and enforcement, not new technology
Lift pollution
It scores 2 out of 5 today, among the weakest parts of Zambia's record. The national PM2.5 annual mean is moderate, around 20 micrograms per cubic metre (World Bank, 2023), and Zambia has banned thin single use plastic bags, though enforcement is patchy. The bigger issue is severe localised pollution: copper smelting on the Copperbelt and the notorious legacy lead contamination at Kabwe, one of the most polluted places on Earth. Lifting it toward the 5/5 the strongest pillars already reach is what the best case turns on.
measured each year
Costs: spending and enforcement, not new technology
Government and Goals in Zambia.
Who is in charge of Zambia now · Office-holders from the UN Protocol and Liaison Service public list of Heads of State and Heads of Government, 8 September 2026. Legislature and election dates from IFES ElectionGuide. Constitution dates from the Constitute Project. Governance scores from the World Bank Worldwide Governance Indicators 2024.
Hakainde Hichilema
President
Hakainde Hichilema is the head of government of Zambia, in office since 24 August 2021. Every climate, protection and energy pledge on this page is delivered, or not, under this administration.
Public opinion, measured
Voice and accountability, the freedom to question government: 49.7 / 100. Below the halfway mark of governments measured. World Bank WGI 2024
Control of corruption: 38.6 / 100. Below the halfway mark of governments measured. World Bank WGI 2024
Political stability and absence of violence: 64.2 / 100. Above the halfway mark of governments measured. World Bank WGI 2024
Rule of law: 47.3 / 100. Below the halfway mark of governments measured. World Bank WGI 2024
Regulatory quality: 48.2 / 100. Below the halfway mark of governments measured. World Bank WGI 2024
Hakainde HichilemaPresident
National AssemblyLegislature, unicameral
Last election13 August 2026
Constitution1991, as revised to 2016
Government typepresidential republic
Zambia national goals: what has been pledged, and how far it has got · each pledge measured against this country's own recorded delivery
2030
30% of land protected
✓ delivered
Target 3 of the Kunming-Montreal Global Biodiversity Framework, adopted by more than 190 parties in December 2022. Zambia currently protects 41.3% of its land, which is 138% of the way to the pledge. ↗
2030
Paris Agreement pledge
on record
Zambia has a Nationally Determined Contribution lodged with the UNFCCC. The registry holds the current text, its target year and the sectors it covers. ↗
Plastic policy
in force, weakly enforced
Ban on plastic carrier and flat bags that do not meet the Zambian Standard, under Statutory Instrument 65 of 2018.
Grid, as it stands
92% renewable
Recorded renewable share of electricity output, the number every energy pledge is measured against. ↗
Plain Answers About Zambia.
The questions people actually type, answered in full sentences from the sourced data above.
swipe →
Is Zambia sustainable?
Zambia scores 65 out of 100 on the Throne Eco Index, across twelve equally weighted pillars. A landlocked, water rich country that protects over 40% of its land for wildlife and invented the walking safari, though mining pollution and drought hit hydropower are real strains.
Is the water in Zambia safe and plentiful?
Zambia is exceptionally water rich on paper, with the Zambezi, Kafue and Luangwa rivers, Lake Tanganyika, the huge Kariba reservoir, the Bangweulu wetlands and Victoria Falls. Access is the weak point: about 73% of people have at least basic drinking water (World Bank and JMP, 2024), safely managed coverage is lower, and tap water is generally unsafe. Heavy reliance on Kariba hydro also left supply exposed during the 2024 drought.
Can Zambia feed itself?
Farming underpins the economy and Zambia is usually self sufficient in its maize staple, nshima, sometimes exporting surplus to neighbours. Production is dominated by smallholders, but the system is narrow and rain dependent, and the 2024 drought turned a normal surplus into an emergency maize deficit.
Is it easy to eat plant-based in Zambia?
The everyday Zambian plate is plant based by default: nshima made from maize meal, served with beans, groundnuts and cooked greens such as rape, pumpkin leaves and cassava leaves, plus sweet potato and cassava. Fresh produce is cheap in township markets, so unprocessed plant eating is the norm.
How much of Zambia is actually protected?
Zambia protects about 41.3% of its land (World Bank, 2025) through vast national parks such as Kafue, one of Africa's largest, plus South Luangwa and Lower Zambezi, and a ring of Game Management Areas. The headline figure is undercut by funding: many Game Management Areas are under resourced and poaching remains a real pressure, so paper coverage exceeds effective protection.
What wildlife is left in Zambia?
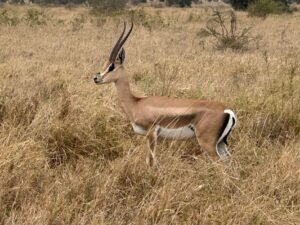
Zambia offers iconic African megafauna and genuine endemics: Kafue and black lechwe, the Thornicroft's giraffe of the Luangwa Valley and the shoebill of the Bangweulu wetlands. South Luangwa is famous for its leopards and one of the densest hippo populations in Africa, and the country lists 148 IUCN threatened species (2023).
Is Zambia on clean energy?
Zambia's electricity is overwhelmingly renewable, with hydropower supplying roughly 84 per cent of generation, chiefly from the Kafue Gorge and Kariba stations. Emissions per person are very low at around 0.54 tonnes of CO2 a year, among the lowest in the world. The country's NDC 3.0, submitted in 2025, pledges to cut emissions by 25 per cent unconditionally and up to 47 per cent with international support by 2030, anchored in the National Policy on Climate Change and Vision 2030.
How polluted is Zambia?
The national PM2.5 annual mean is moderate, around 20 micrograms per cubic metre (World Bank, 2023), and Zambia has banned thin single use plastic bags, though enforcement is patchy. The bigger issue is severe localised pollution: copper smelting on the Copperbelt and the notorious legacy lead contamination at Kabwe, one of the most polluted places on Earth.
Does recycling work in Zambia?
There is no meaningful formal municipal recycling system and no reliable published rate. Recovery is minimal and informal, limited to some scrap metal and PET collection in the larger cities.
Is the farming in Zambia organic?
Certified organic farmland is negligible, around 0.003% of agricultural land (FiBL, 2020). As across much of the region, many smallholders farm with few synthetic inputs out of necessity, but almost none of this is certified organic.
Are there natural materials and craft in Zambia?
Zambia keeps living craft traditions in basketry and reed and grass weaving, and grows cotton that feeds the ubiquitous chitenge printed cloth. The crafts are genuine but localised rather than a defining national industry.
Is there living culture in Zambia?
Zambia has more than 70 living ethnic groups and vivid traditional ceremonies such as the Lozi Kuomboka, and community based tourism and conservancies operate around the major parks. South Luangwa is the birthplace of the walking safari, and community partnerships channel some tourism income to local people, though a share still concentrates with operators.
What heritage does Zambia keep alive?
Zambia sustains a calendar of living traditional ceremonies that remain central to community and spiritual life. The Lozi Kuomboka sees the Litunga move by royal barge from the flooding Barotse plain, while the Ngoni Nc'wala gives first fruits thanks to the ancestors for the harvest. Other living observances include the Lunda Mutomboko, the Bemba Ukusefya Pa Ng'wena and the Luvale Likumbi Lya Mize with its Makishi masquerade.
So is Zambia actually green? The measured answer
What is working: land protected at 41.3%, renewable electricity at 92%.
What is not: the gaps are narrower here than in most of the directory, and each remaining one is named below.
Zambia sits 49 of 77 at 65/100. Every name links to its own destination page, built exactly like this one. The full ranking →
What is Zambia particularly good at?
✓Energy, scored 5/5. Zambia's electricity is overwhelmingly renewable, with hydropower supplying roughly 84 per cent of generation, chiefly from the Kafue Gorge and Kariba stations. Emissions per person are very low at around 0.54 tonnes of CO2 a year, among the lowest in the world. The country's NDC 3.0, submitted in 2025, pledges to cut emissions by 25 per cent unconditionally and up to 47 per cent with international support by 2030, anchored in the National Policy on Climate Change and Vision 2030. Severe drought has recently cut Kariba output and exposed the grid's dependence on rainfall, prompting a pivot towards solar. On balance Zambia is a very low emitter running on clean power with credible policy.
✓Heritage, scored 5/5. Zambia sustains a calendar of living traditional ceremonies that remain central to community and spiritual life. The Lozi Kuomboka sees the Litunga move by royal barge from the flooding Barotse plain, while the Ngoni Nc'wala gives first fruits thanks to the ancestors for the harvest. Other living observances include the Lunda Mutomboko, the Bemba Ukusefya Pa Ng'wena and the Luvale Likumbi Lya Mize with its Makishi masquerade. Kalindula music and drumming carry these gatherings, and ancestral thanksgiving and remembrance remain widely practised. This is deep, widely alive heritage held across many peoples.
✓Conservation, scored 4/5. Zambia protects about 41.3% of its land (World Bank, 2025) through vast national parks such as Kafue, one of Africa's largest, plus South Luangwa and Lower Zambezi, and a ring of Game Management Areas. The headline figure is undercut by funding: many Game Management Areas are under resourced and poaching remains a real pressure, so paper coverage exceeds effective protection.
Where does Zambia score worst?
✕Water, scored 2/5. Zambia is exceptionally water rich on paper, with the Zambezi, Kafue and Luangwa rivers, Lake Tanganyika, the huge Kariba reservoir, the Bangweulu wetlands and Victoria Falls. Access is the weak point: about 73% of people have at least basic drinking water (World Bank and JMP, 2024), safely managed coverage is lower, and tap water is generally unsafe. Heavy reliance on Kariba hydro also left supply exposed during the 2024 drought.
✕Organic farming, scored 1/5. Certified organic farmland is negligible, around 0.003% of agricultural land (FiBL, 2020). As across much of the region, many smallholders farm with few synthetic inputs out of necessity, but almost none of this is certified organic.
✕Recycling, scored 1/5. There is no meaningful formal municipal recycling system and no reliable published rate. Recovery is minimal and informal, limited to some scrap metal and PET collection in the larger cities.
Similar countries doing it better and worse
TanzaniaScored on the same twelve pillars as Zambia.73
EthiopiaScored on the same twelve pillars as Zambia.72
UgandaScored on the same twelve pillars as Zambia.68
EgyptScored on the same twelve pillars as Zambia.60
BotswanaScored on the same twelve pillars as Zambia.57
SeychellesScored on the same twelve pillars as Zambia.57
A note from the lens of mother natureswipe →
Energy, 5/5
Zambia's electricity is overwhelmingly renewable, with hydropower supplying roughly 84 per cent of generation, chiefly from the Kafue Gorge and Kariba stations. Emissions per person are very low at around 0.54 tonnes of CO2 a year, among the lowest in the world.
Food and farming, 4/5
Farming underpins the economy and Zambia is usually self sufficient in its maize staple, nshima, sometimes exporting surplus to neighbours. Production is dominated by smallholders, but the system is narrow and rain dependent, and the 2024 drought turned a normal surplus into an emergency maize deficit.
Heritage, 5/5
Zambia sustains a calendar of living traditional ceremonies that remain central to community and spiritual life. The Lozi Kuomboka sees the Litunga move by royal barge from the flooding Barotse plain, while the Ngoni Nc'wala gives first fruits thanks to the ancestors for the harvest.
The Zambia Directory.
Everything on Hold The Throne that sits in Zambia, checked and listed.
How the rest of the world scores Zambia
Independent global indices, for calibration.
Forest cover
59.5
Recorded figure, sourced on this page.
Protected land
41.3
Recorded figure, sourced on this page.
Renewable grid
92.0
Recorded figure, sourced on this page.
CO2 per person
~0.54
Recorded figure, sourced on this page.
Threatened species
148
Recorded figure, sourced on this page.
Control of corruption
38.6 / 100
World Bank Worldwide Governance Indicators, 2024. Percentile among all governments measured.
Government effectiveness
41 / 100
World Bank Worldwide Governance Indicators, 2024. Percentile among all governments measured.
Rule of law
47.3 / 100
World Bank Worldwide Governance Indicators, 2024. Percentile among all governments measured.
Political stability
64.2 / 100
World Bank Worldwide Governance Indicators, 2024. Percentile among all governments measured.
Voice and accountability
49.7 / 100
World Bank Worldwide Governance Indicators, 2024. Percentile among all governments measured.
Environmental Performance Index
46.7 / 100 · 84 of 180
Yale Environmental Performance Index 2024, ranked 84 of 180 countries assessed.
Ecosystem vitality
67.0 / 100 · 25 of 180
Yale Environmental Performance Index 2024, ranked 25 of 180 countries assessed.
Biodiversity and habitat
83.7 / 100 · 3 of 180
Yale Environmental Performance Index 2024, ranked 3 of 180 countries assessed.
Air pollution
75.4 / 100 · 78 of 180
Yale Environmental Performance Index 2024, ranked 78 of 180 countries assessed.
Terrestrial biomes protected
99.2 / 100 · 14 of 180
Yale Environmental Performance Index 2024, ranked 14 of 180 countries assessed.
How Zambia Is Scored. The Throne Standard.
Every destination on the index is scored the same way, so a 4 in Barbados means exactly what a 4 means in Iceland. No self-declared data and no brochure claims are accepted. Every figure on this page carries its named source and year, and the history on each page names what empire took as plainly as it scores the present.
The 12 pillars every destination is scored on, equally weighted
01
Conservation
Land and sea actually protected, not pledged
02
Wildlife
What survives, what is endemic, what is lost
03
Water
Fresh water per person, and the ocean’s health
04
Food & farming
Whether the place can feed itself
05
Organic & clean
Certified land and pesticide reality
06
Climate & energy
Emissions per person, how the grid is powered
07
Waste
Where the rubbish goes, what comes back
08
Health
What people eat and die of
09
Heritage
Living culture, and what the law keeps standing
10
Ownership
Who owns the economy, how much of a dollar stays
11
Governance
Freedom, honesty, promises kept
12
Future
Measured trends run forward, pledges against pace
What each 0 to 5 pillar score means, in plain words
The institutions above are the ones cited on this page, ranked by how many of its figures they carry. This same sectioned page renders for all 77 scored destinations, each with its own researched history, comparison charts and three-way future. Read the full methodology
Every figure on this page, and where it came from: 56 sources across 25 institutions
World Bank23 FIGURES
Forest area (% of land area) AG.LND.FRST.ZS, 2023 check
Terrestrial protected areas (% of land) ER.LND.PTLD.ZS, 2025 check
Renewable electricity output (% of total) EG.ELC.RNEW.ZS, 2021 check
PM2.5 mean annual exposure (micrograms per cubic metre) EN.ATM.PM25.MC.M3, 2023 check
CO2 emissions per capita EN.GHG.CO2.PC.CE.AR5, 2024 check
Terrestrial protected areas (% of total land area), indicator ER.LND.PTLD.ZS, Zambia, Zambia protects about 41% of its land (World Bank, 2025) through vast national parks such as Kafue, one of Afr check
Terrestrial protected areas (% of total land area), indicator ER.LND.PTLD.ZS, Zambia corroboration check
Terrestrial protected areas (% of total land area), indicator ER.LND.PTLD.ZS, Zambia corroboration check
PM2.5 air pollution, mean annual exposure (micrograms per cubic metre), indicator EN.ATM.PM25.MC.M3, Zambia, The national PM2.5 annual mean is moderate, around 20 micrograms per cubic metre (World Bank, 2023), and Zambi check
PM2.5 air pollution, mean annual exposure (micrograms per cubic metre), indicator EN.ATM.PM25.MC.M3, Zambia corroboration check
Carbon dioxide emissions per capita, indicator EN.GHG.CO2.PC.CE.AR5, Zambia, Emissions per person are very low at around 0.54 tonnes of CO2 a year, among the lowest in the world. check
Carbon dioxide emissions per capita, indicator EN.GHG.CO2.PC.CE.AR5, Zambia corroboration check
Government expenditure on education as a percentage of GDP (XGDP.FSGOV), Zambia, Public spending on education runs at 4.1% of GDP and 14.5% of all government spending, and secondary enrolment check
Government expenditure on education as a percentage of GDP (XGDP.FSGOV), Zambia corroboration check
Government expenditure on education as a percentage of GDP (XGDP.FSGOV), Zambia corroboration check
Government expenditure on education as a percentage of GDP (XGDP.FSGOV), Zambia corroboration check
Government expenditure on education as a percentage of GDP (XGDP.FSGOV), Zambia corroboration check
FAO, Global Forest Resources Assessment3 FIGURES
UN SDG Global Database, forest area (% of land area) AG_LND_FRST, Zambia, 2025 (60.4%), country-reported check
UN SDG Global Database, forest area under a long-term management plan (%) AG_LND_FRSTMGT, Zambia, 2025 (82.5%), country-reported check
UN SDG Global Database, forest area inside legally established protected areas (%) AG_LND_FRSTPRCT, Zambia, 2025 (82.5%), country-reported check
BirdLife International, IUCN and UNEP-WCMC2 FIGURES
UN SDG Global Database, terrestrial Key Biodiversity Areas covered by protected areas (%) ER_PTD_TERR, Zambia, 2025 (46.1%), country-reported check
UN SDG Global Database, freshwater Key Biodiversity Areas covered by protected areas (%) ER_PTD_FRHWTR, Zambia, 2025 (56.8%), country-reported check
FAO2 FIGURES
FAOSTAT, Production: Crops and livestock products (QCL), Africa bulk dataset, By tonnage, the largest crops grown in Zambia are sugarcane, cassava and maize (FAO, FAOSTAT crop production check
FAOSTAT, Production: Crops and livestock products (QCL), Africa bulk dataset corroboration check
000 bats at the 2019 automated count (Koger et al., Ecosphere, 2023); the 10 million figure came from manual counts around 2005 and the superlative no longer holds check
CBD1 FIGURE
Kunming-Montreal Global Biodiversity Framework Target 3 check
the straw coloured fruit bat migration in Kasanka National Park check
Odubote I.K. (2023)1 FIGURE
Trends and Status of Rabbit Production and Research in Lusaka District, Journal of Agriculture and Biomedical Sciences 7(3), University of Zambia, Oryctolagus cuniculus range check

 TanzaniaScored on the same twelve pillars as Zambia.73
 EthiopiaScored on the same twelve pillars as Zambia.72
 UgandaScored on the same twelve pillars as Zambia.68
 EgyptScored on the same twelve pillars as Zambia.60
 BotswanaScored on the same twelve pillars as Zambia.57
 SeychellesScored on the same twelve pillars as Zambia.57