Destinations › South America · The Destination Index · universal template · every figure sourced
Peru.
Western South America, bordering the South Pacific Ocean, between Chile and Ecuador. 1,285,216 sq km and 34,576,665 people, 2,414 km of coastline, varies from tropical in east to dry desert in west; temperate to frigid in Andes.
Region · South AmericaPopulation · ~34,576,665Languages · Spanish, Quechua (official), Aymara (official), and around 45 Amazonian languagesEco Index · 78/100 · Good
The Eco Index across 12 pillars · scored 0 to 5 · World Bank, OWID, WHO/UNICEF JMP, FiBL, Protected Planet, IUCN, UNESCO (2023-24)
Conservation
Wildlife
Water
Food & farming
Organic & clean
Climate & energy
Waste
Health
Heritage
Ownership
Governance
Future
The History of Peru.
Peru sustains one of the richest living heritages in the Americas, rooted in Quechua and Aymara Andean culture alongside Amazonian and Afro-Peruvian traditions. Music and dance such as the huayno, the national marinera and the Afro-Peruvian festejo are widely performed, and the danza de las tijeras, the scissors dance, is inscribed by UNESCO.
Where the name comes from
Usually traced to Birú, the name of a leader or a river near the Spanish landing point, which they then applied to an empire that called itself Tawantinsuyu. Source: national and regional toponymic records.
The land itself: the coastal plain, the high Andes through the centre, and the Amazon lowland to the east. Its high point is Nevado Huascarán, 6,746 m. Source: national mapping and survey records.
Where it starts
The oldest civilisation in the Americas
Highland caves record occupation soon after the last ice age, and the potato was domesticated in the Andes around 8,000 years ago, with more than 4,000 varieties still grown here. Between 3000 and 1800 BC, Caral in the Supe valley built pyramids, sunken plazas and planned settlements, making it the oldest known centre of civilisation anywhere in the Americas, a society that arose independently of the Old World, traded with coastal, highland and Amazonian neighbours, and left no defensive walls and no weapons.
How it got here
Chavín to Tawantinsuyu
A religious and artistic tradition spread from Chavín de Huántar across the highlands. The Nazca lines were drawn on the desert floor between about 500 BC and AD 500. Moche metalwork and portrait ceramics and the Wari road system followed. From 1438 the Inca state, Tawantinsuyu, ran from Colombia to Chile with terraces, storehouses, roads and knotted-cord records. Spanish conquest in 1532 brought nearly three centuries of colonial rule and forced labour in the mines. Peru declared independence in 1821.
The timeline
c. 12,000 years ago
Pikimachay and the first Andeans.
Highland cave sites record occupation soon after the last ice age. ↗
c. 8000 years ago
Potatoes.
The potato is domesticated in the Andes, and more than 4,000 varieties are still grown here. ↗
c. 3000 to 1800 BC
Caral.
Pyramids, sunken plazas and planned settlements in the Supe valley, the oldest known centre of civilisation in the Americas. ↗
c. 900 to 200 BC
Chavín.
A religious and artistic tradition spreads across the highlands from Chavín de Huántar. ↗
c. 500 BC to AD 500
The Nazca lines.
Enormous figures and straight lines are drawn on the desert floor, visible whole only from the surrounding hills and the air. ↗
c. AD 100 to 800
Moche and Wari.
Moche metalwork and portrait ceramics, and the Wari state with its road system. ↗
1438 to 1533
Tawantinsuyu.
The Inca state runs from Colombia to Chile, with terraces, storehouses, roads and knotted-cord records. ↗
1532 to 1821
Spanish rule.
Spanish conquest and nearly three centuries of colonial rule, with forced labour in the mines. ↗
1821
Independence.
Independence from Spain is proclaimed at Lima in 1821 by Jose de San Martin. ↗
Terrestrial protected areas cover about 22.3 percent of the land (World Bank, 2021), managed by SERNANP and including Manu, Tambopata, Huascaran and Paracas, and Peru created the vast Nazca Ridge (Dorsal de Nasca) marine reserve in 2021. The system is strong on paper, but illegal gold mining, logging and coca cultivation erode parts of the Amazon. Marine protection registered a low 0.5 percent in the 2021 dataset, before the new reserve is fully reflected.
Is wild Peru protected? 22.1% of the land is, against a 30% target for 2030
How protected is nature in Peru?
Forest cover56.2%
Terrestrial protected area22.27%
Marine protected area7.9%
802 (mammals, birds, fish & plants) listed as threatened.
Found only here. Vicuna, Andean condor, spectacled bear, giant otter and many endemic Andean birds
The watchlist
ThreatenedAndean Titi (Plecturocebus oenanthe)Critically Endangered on the IUCN Red List, and recorded in Peru in GBIF occurrence data (mammal).
ThreatenedWaved Albatross (Phoebastria irrorata)Critically Endangered on the IUCN Red List, and recorded in Peru in GBIF occurrence data (bird).
ThreatenedLima Leaf-toed Gecko (Phyllodactylus sentosus)Critically Endangered on the IUCN Red List, and recorded in Peru in GBIF occurrence data (reptile).
ThreatenedPeruphasma schulteiCritically Endangered on the IUCN Red List, and recorded in Peru in GBIF occurrence data (insect).
ThreatenedHaageocereus tenuisCritically Endangered on the IUCN Red List, and recorded in Peru in GBIF occurrence data (plant, Haageocereus tenuis only; Carex acutata is Not Evaluated on the IUCN Red List and should be removed from this watchlist).
ThreatenedYellow-tailed Woolly Monkey (Lagothrix flavicauda)Critically Endangered on the IUCN Red List, and recorded in Peru in GBIF occurrence data (mammal).
ThreatenedWhite-bellied Cinclodes (Cinclodes palliatus)Critically Endangered on the IUCN Red List, and recorded in Peru in GBIF occurrence data (bird).
Critically Endangered, the last IUCN category before Extinct in the Wild, and still recorded in Peru. GBIF holds 27 verified occurrence records.
Waved Albatross (Phoebastria irrorata)
Critically Endangered, the last IUCN category before Extinct in the Wild, and still recorded in Peru. GBIF holds 233 verified occurrence records.
Lima Leaf-toed Gecko (Phyllodactylus sentosus)
Critically Endangered, the last IUCN category before Extinct in the Wild, and still recorded in Peru. GBIF holds 3 verified occurrence records.
Peruphasma schultei
Critically Endangered, the last IUCN category before Extinct in the Wild, and still recorded in Peru. GBIF holds 2 verified occurrence records.
Species named here are drawn from GBIF occurrence records for Peru filtered to the IUCN Red List threatened categories. Species are listed where GBIF holds occurrence records for them in this country. Record counts are not published here because the figure cannot be reproduced from a public GBIF query.
National park, mapped and named in the open record for Peru. OpenStreetMap.
Water and Ocean in Peru.
Nationally Peru is water rich through the Amazon basin, Andean glaciers and Lake Titicaca, but the resource is badly matched to the people: most Peruvians live on the arid Pacific coast, and Lima is one of the world's largest desert cities, dependent on rivers fed by shrinking glaciers. WHO/UNICEF JMP and World Bank data put safely managed drinking water at about 51.3 percent of the population in 2020. Coastal water stress and glacial retreat are real pressures, and tap water is not reliably safe for visitors.
Does Peru have enough fresh water? Yes, with headroom
49.4% of people here have safely managed drinking water at home (2024, WHO/UNICEF JMP). Coverage is well short of universal, so a visitor should not assume the tap is safe.
Cleanest water: High Andean lakes such as Laguna 69 and Amazon headwaters
How much fresh water does Peru have, per person?
49,021 m³
Peru
1,000 m³
the UN “water scarce” line
Peru withdraws about 25,919 million cubic metres of fresh water a year (2022). That is 4.8% of the fresh water actually available to it, which FAO counts as no water stress. Of what is taken, farming takes 81%, homes and towns 12%, industry 6%. Source: FAO AQUASTAT.
What are the rules on Peru beaches?
✕Tap water: Not drinkable.
✓Plastic rules: Yes, single use plastics regulated and phased out under Law 30884 of 2018.
✕Solo travel: rated take care on the record for this destination.
✕Marine protection: 0.48% of the sea is protected. The 30x30 pledge for 2030 is not met yet.
Named on the open map: Playa Chorrillos, Playa Hermosa, Playa Kon Tiki, Playa La Calichera, Playa La Ensenada, Playa La Estrella, Playa La Joya, Playa La Vina. That is 16 named beaches in the public record for Peru, each one a place you can look up before you go. OpenStreetMap.
Where does the sewage go?
56.5%
of people have safely managed sanitation
56.5% of people here use a safely managed sanitation service, meaning waste is contained, emptied and treated rather than reaching the ground or the sea untreated (2024, World Bank / WHO-UNICEF JMP, SDG 6.2.1). The rest is what the rivers and the coast receive.
How is the sea around Peru doing?
One cross-section, every answer measured.
Surface
What the coast carries
Andes: dry May–Sep, wet Nov–Mar; Amazon is hot and humid all year, wettest Nov–May.
Nearshore
Protected water
7.9% of territorial waters are protected, against the 30% pledged for 2030 under the Global Biodiversity Framework.
Cleanest
Where the water is cleanest
High Andean lakes such as Laguna 69 and Amazon headwaters.
The record
Measured
Nationally Peru is water rich through the Amazon basin, Andean glaciers and Lake Titicaca, but the resource is badly matched to the people: most Peruvians live on the arid Pacific coast, and Lima is one of the world's largest desert cities, dependent on rivers fed by shrinking glaciers. WHO/UNICEF JMP and World Bank data put safely managed drinking water at about 51.3 percent of the population in 2020.
Sea protected
0.48%
Against the 30% pledged for 2030 under the Global Biodiversity Framework.
Threatened species
802 (mammals, birds, fish & plants)
Mammals, birds, fish and higher plants on the IUCN list.
Cleanest water
here
High Andean lakes such as Laguna 69 and Amazon headwaters.
Is the tap water safe in Peru?
49.4% of people have safely managed drinking water at home (2024, WHO/UNICEF JMP). Renewable fresh water works out at about 49,021 cubic metres per person a year (World Bank).
How hard is the water supply being pushed?
Of every 10 buckets nature refills, 0 are already taken. Withdrawals run at 4.8% of what Peru renews internally each year (2022, World Bank / FAO AQUASTAT). That is inside the 25% mark generally treated as water stress, so the supply has headroom.
When is the best time to visit Peru? Tap your month.
Tap your month.
JanFebMarAprMayJunJulAugSepOctNovDec
.
How much fresh water does Peru actually have?
Nature renews about 49,021 cubic metres of fresh water per person per year here. That ranks Peru 198 of 208 countries measured, placing it among the 20 best-watered countries measured. The UN treats anything under 1,000 cubic metres as water scarce, and this is above that line. World Bank / FAO AQUASTAT.
Peru is a centre of crop origin and an agricultural powerhouse, home to thousands of native potato varieties plus maize, quinoa, beans and aji, and a leading exporter of avocado, blueberry, asparagus and grape. Staple self sufficiency in native crops is high and markets brim with domestic produce, though wheat and feed grains are imported.
Where does the food in Peru come from?
11.9% imported
about US$7,231m a year
On the plate: Native potatoes, maize varieties, quinoa, beans, aji peppers, rice, tropical fruit
How often each food is on the plate
Share of people eating each one regularly. These overlap, so they do not add up to 100%.
Native potatoes60%
Maize varieties51%
Quinoa42%
Beans33%
Aji peppers24%
Rice15%
1 of 10
bites are imported
The island buys in more food energy than it eats. About US$7,231m a year leaves the country to pay for it. The green slice is roughly what still grows here.
About 11.9% of everything Peru buys in from abroad is food, roughly 1 in every 10 imported items on the dock (2024, World Bank). Farming itself is 7.5% of the economy and 19.1% of the land is agricultural, of which 3.1% is arable. The green slice is roughly what still grows here.
What is killing people in Peru? The imported diet.
Cause of death, and the diet behind it.
Non-communicable diseases, all combined41.6%
Diabetes6.4%
Adults living with overweight or obesity. 68.1%.
Can Peru feed itself?
3.1%
Arable land
19.1%
Agricultural land
4,451,673
Farmers
9,682,639
Arable acres
7.5%
Agriculture, share of GDP
Harvest: Andean potato and maize harvest around May to July; coffee April to September; Amazon fruit varies
Feeding itself
Peru is a centre of crop origin and an agricultural powerhouse, home to thousands of native potato varieties plus maize, quinoa, beans and aji, and a leading exporter of avocado, blueberry, asparagus and grape. Staple self sufficiency in native crops is high and markets brim with domestic produce, though wheat and feed grains are imported.
Certification
FiBL records about 1.5 percent of agricultural land as certified organic in 2020, roughly 343,000 hectares, and Peru is a top global exporter of organic coffee, cacao and banana grown by smallholder cooperatives.
Water for crops
Nationally Peru is water rich through the Amazon basin, Andean glaciers and Lake Titicaca, but the resource is badly matched to the people: most Peruvians live on the arid Pacific coast, and Lima is one of the world's largest desert cities, dependent on rivers fed by shrinking glaciers. WHO/UNICEF JMP and World Bank data put safely managed drinking water at about 51.3 percent of the population in 2020.
Why the organic number looks like that. Certified-organic farmland is not separately reported for Peru, and that is a certification gap rather than proof nothing is grown cleanly. What the official land record does show: 19.1% of the country is agricultural land and 3.1% is arable (2023, World Bank). Certification is paid for per farm per year by a foreign body, which prices out smallholders, so the organic number reads worse than the practice.
The plant-based kitchen here is not an import. By tonnage, the largest crops grown in Peru are sugar cane, potatoes, rice, bananas and maize (FAO, FAOSTAT crop production, 2024). That is what the land itself puts on a plate.
Buy direct where residents buy: Mercado "La Parada, Mercado Artesanal, Mercado Cautivo de Ayabaca, Mercado Central de Cajabamba, Mercado Convento, Mercado Cooperativo Reynoso. Each is a mapped, named marketplace, so the money stays with the seller rather than the importer. OpenStreetMap.
Is this grown in Peru?
Tap a food for the honest answer.
Native potatoesMaize varietiesQuinoaBeansAji peppersRiceTropical fruit
.
Native potatoesMaize varietiesQuinoaBeansAji peppersRiceTropical fruit
Roughly 60% of Peru's electricity comes from renewables, overwhelmingly hydropower which supplies close to half of generation, with natural gas making up most of the rest. Fossil carbon dioxide emissions are low at about 2.05 tonnes per person in 2024. Peru has committed to net zero greenhouse gas emissions by 2050 and released an updated National Climate Change Strategy to 2050 in late 2024, although the Climate Action Tracker notes that political instability has slowed delivery. A target of 20% wind and solar in the power mix by 2030 aims to broaden the renewable base beyond hydro.
What powers Peru?
Renewable 63.7%Fossil 36.4%
Climate pollution per person
The safe amount, what the planet can absorb
2 tonnes
One person here
2.02 tonnes
The world average, for comparison
4.7 tonnes
The worst it ever got
2.02 tonnes
The grid
Roughly 60% of Peru's electricity comes from renewables, overwhelmingly hydropower which supplies close to half of generation, with natural gas making up most of the rest. Fossil carbon dioxide emissions are low at about 2.05 tonnes per person in 2024.
Pollution
Peru's Law 30884 of 2018 progressively bans single use plastics and prohibited plastic bags and straws immediately in natural and cultural protected areas, a genuine national policy. Against that, ambient PM2.5 averaged about 24.8 micrograms per cubic metre (World Bank, 2017), high and driven by Lima traffic, and illegal Amazon gold mining releases mercury.
Water stress
Nationally Peru is water rich through the Amazon basin, Andean glaciers and Lake Titicaca, but the resource is badly matched to the people: most Peruvians live on the arid Pacific coast, and Lima is one of the world's largest desert cities, dependent on rivers fed by shrinking glaciers. WHO/UNICEF JMP and World Bank data put safely managed drinking water at about 51.3 percent of the population in 2020.
What pollutes most here
1The gridThe share of electricity still generated from fossil fuel.37%
2IndustryIllegal gold mining in Madre de Dios (La Pampa), which drives Amazon deforestation and mercury pollution; Amazon oil spills.named
3AirModelled annual mean against a WHO guideline of 5 µg/m³.24.8
4On the recordPeru's Law 30884 of 2018 progressively bans single use plastics and prohibited plastic bags and straws immediately in natural and cultural protected areas, a genuine national policy.
What has Peru promised on climate?
Net zero, whole economy2050
Electricity renewable today61.8% (2021)
Land protected, against a 30% target22.1% by 2025
Sea protected, against a 30% target7.9% by 2025
The net-zero target year on file with Climate Watch is 2050, status: in policy document. Measured against it, 61.8% of electricity is already renewable (2021, World Bank), so 38.2% of the grid is still to be converted. The pledge on file is measured here against what has actually been delivered, not taken on its own (UNFCCC NDC Registry, CBD Kunming-Montreal Target 3).
The biggest line item
One return flight against a whole year of living.
A resident's entire year2.02 t CO2e
Safe-climate budget, per year2 t CO2e
Singapore return, economy3.39 t CO2e
Dubai return, economy2.67 t CO2e
Sydney return, economy2.31 t CO2e
Johannesburg return, economy1.96 t CO2e
Frankfurt return, economy1.93 t CO2e
How much CO2 does flying to Peru emit?
Tap where you would fly from. One return flight, economy.
Every prompt runs on a machine in a building on somebody’s grid. What that costs the planet depends less on the prompt than on what is burning to power it. Here is what would power one in Peru.
Data centres
15
Registered colocation and interconnection facilities, PeeringDB, 2026
Grid renewable
63.7 %
What a machine here runs on.
What powers a data centre in Peru?
A machine here runs mostly on renewables, but not entirely.
Renewable 63.7%Fossil 36.3%
Cooling water. Every one of those halls runs on the national grid, which is 61.8% renewable today (World Bank). A data centre is only as clean as the electricity behind it, so the same figure that decides this country's climate score also decides the footprint of the AI running inside it. Cooling water use is not separately published by facility, and no operator here reports it.
The rules. Peru has 15 colocation and interconnection facilities on the public PeeringDB register, concentrated in Lima (8), Santiago de Surco (2), Arequipa (2), alongside 14 internet exchanges (Nap Peru, PIT - Peru, Lima, JumboIX Peru, PIT - Peru, Arequipa). Named sites include Internexa Lima San Juan, Internexa Lima Surco, IPTP, San Isidro, Lima, Peru, Cirion Lima, LIM1.
Where the cables land. 3 landing points · Ilo, Lurin, Mancora
87% residents to 13% visitors across a year. 5,275,000 international arrivals in 2019 against 34,576,665 people who live here (2025, World Bank / UN Tourism).
Where a visitor dollar goes in Peru
1,119k
Visitors a year
0.0
Visitors per resident
How deep in debt is Peru?· for every $100 Peru earns in a year, it owes…
Pay to the order of: the creditorsmemo · the 2003 peak
$ 49The worst year on the IMF record. Peru owed $49 for every $100 it earned.
IMF World Economic Outlook, 2003signed, the creditors
Pay to the order of: the creditorsmemo · today
$ 30What is owed now, for every $100 of national income (2026).
IMF World Economic Outlook, 2026signed, the creditors
Pay to the order of: the creditorsmemo · projected 2031
$ 32The IMF's own forecast has this rising to $32 by 2031.
IMF World Economic Outlook projection, 2031signed, the forecast
For every $100 Peru earns in a year, it owes $30 (2026, IMF World Economic Outlook). The interest on that is paid before schools, clinics or coastline get their turn.
Where does a tourist dollar actually go in Peru?
Play one tourist dollar around the board. Every square is a measured fact from this page.
START!
1
GO: a visitor lands
$100 goes on the table. 5,275,000 international arrivals in 2019 against 34,576,665 residents, one visitor a year for every 7 residents (World Bank / UN Tourism).
$100 in play
2
The bed
Who owns the largest places to stay in Peru is not published in the records we can check, so this square is left open rather than guessed. Where a listing names its owner, it is shown in the ownership table below.
not published
3
The plate
Food is only 11.9% of everything Peru imports (2024, World Bank), so most of a meal is bought from producers inside the country. Eating what the land here actually grows, sugarcane, potatoes, rice, bananas, maize, oil palm fruit, cassava, grapes, keeps that money with the grower.
mostly home-grown
4
The power
61.8% of the electricity is renewable (2021, World Bank), so the energy on the bill is mostly generated inside the country rather than shipped in.
made at home
5
What actually stays
Of the two parts of a visitor's bill that can be measured here, the plate and the power stay inside Peru. This is not an economy where a visitor's money drains away, and the board is shorter for it.
most of it
6
Pay the bank first
Peru owes $30 for every $100 it earns (IMF World Economic Outlook, 2026 projection). The interest is paid before anything else on this board.
$30 per $100
7
No plan B
41.9% of everything Peru sells abroad is ores, slag and ash (2023, UN Comtrade). One market moving takes the whole board with it.
41.9% one export
8
Community chest
Tourism earns 2.2% of everything Peru makes from exports (2020, World Bank / UN Tourism). That is how much of the economy depends on the game continuing.
2.2% of exports
9
The flight
Getting here is usually the biggest single line on the bill. From Singapore a return economy seat is 3.39 t CO2, on the UK Government's published conversion factors. It is the one part of the trip this board cannot reduce.
3.39 t CO2
10
Back to GO
The economy turns over about US$381 billion a year (IMF World Economic Outlook, 2026 projection). Every lap of this board is a choice about how much of it stays.
US$381bn
GDPUS$334.9bn
Agriculture, share of GDP7.5%
Visitors a year1,119,000
Visitors per resident0
Residents~34,576,665
Agriculture
Farming is 7.5% of the economy. Peru is a centre of crop origin and an agricultural powerhouse, home to thousands of native potato varieties plus maize, quinoa, beans and aji, and a leading exporter of avocado, blueberry, asparagus and grape.
Natural materials
Peru sustains a world renowned natural fibre tradition: alpaca and the ultra fine vicuna, the finest animal fibre in the world, plus pima and native coloured cotton, all woven on backstrap looms in communities such as Chinchero and on Taquile island, whose textile art is UNESCO listed. These are living, daily crafts and a serious export.
Energy
Roughly 60% of Peru's electricity comes from renewables, overwhelmingly hydropower which supplies close to half of generation, with natural gas making up most of the rest. Fossil carbon dioxide emissions are low at about 2.05 tonnes per person in 2024.
Who owns the biggest hotels in Peru?
By rooms · company records and press.
Inkaterra Reserva Amazonica · ~35 roomsIndependentnot published
Las Qolqas · ~16 roomsIndependentnot published
Refugio Amazonas · ~32 roomsIndependentnot published
Visitors, over time
20154,381k
20164,718k
20174,992k
20185,384k
20195,275k
20201,119k
International tourism receipts run at about US$1.00 billion in 2020 (World Bank / UN Tourism). That is 2.2% of everything the country earns from exports.
How much of your money actually stays here?
Tap the holiday you are planning.
All-inclusive resortForeign-owned hotel and tourist restaurantsLocally owned stay and local restaurantsGuesthouse, markets and public transport
Resort guest, villa renter, family, nomad or backpacker. The honest playbook for each, from the same sourced numbers.
Already booked a resort? · the rescue list
Five swaps that move your money back on-island
1. Eat where the country eats Choose kitchens cooking what the land here grows, native potatoes, maize varieties, quinoa, beans, aji peppers, rice, tropical fruit, over an imported menu. The checked list →
2. Book with a local operator Never the lobby desk. The margin on a tour is the part that stays. Eco tours →
3. Stay somewhere locally owned Ownership decides where the room rate books. Eco stays →
4. Use the transport residents use Long distance buses (Cruz del Sur and others), domestic flights, colectivos, trains to Machu Picchu and boats on Lake Titicaca
5. Buy the craft, not the souvenir Natural-materials work made here pays the maker directly; imported gifts pay a shipping line.
swipe →
First time here
Peru runs from Pacific desert over the high Andes into the Amazon, a megadiverse country and crop origin heartland with strong protected areas and living Quechua and Amazonian cultures.
Best time: Andean and Amazon dry season for trekking and clear views
Getting around
Long distance buses (Cruz del Sur and others), domestic flights, colectivos, trains to Machu Picchu and boats on Lake Titicaca
Transport is where the fare either stays or leaves.
Eating here
The everyday plate that actually grows here is native potatoes, maize varieties, quinoa, beans, aji peppers, rice, tropical fruit. Ordering those keeps the money with the grower and cuts the imported share of the meal.
Eating what the country grows is the cheapest way to cut the import bill.
Good to know
Cards in cities, cash in the highlands and Amazon; soles.
None of the 3 properties listed here publishes who ultimately owns it, so no claim is made either way. Ownership is what decides how much of a room rate stays in the country, which is why we show it when a listing states it.
Society and Governance in Peru.
How well is Peru actually run?
Governance, measured · World Bank WGI
Four measured answers, none of them opinion. Averaged across corruption control, delivery and accountability, Peru scores 46 out of 100 (2024, World Bank Worldwide Governance Indicators). That matters here because every pledge on this page is only as good as the machinery meant to deliver it.
How well is Peru run? · each scored out of 100, higher is better
Clean government, scored 33 of 100
Control of corruption scores 33.3 out of 100 (2024, World Bank Worldwide Governance Indicators). That is below the halfway mark of governments measured.
33
Freedom and rights, scored 58 of 100
Voice and accountability, which measures free expression, free media and the ability to choose a government, scores 57.6 out of 100 (2024, World Bank WGI). Citizens have some room to question their government.
58
Government effectiveness, scored 47 of 100
Government effectiveness, which measures the quality of public services and how well policy is actually delivered, scores 47.4 out of 100 (2024, World Bank WGI). Delivery is rated below average, so a pledge on paper is not the same as a pledge kept.
47
Income equality, scored 40 of 100
The Gini index of income inequality reads 40.1 (2024, World Bank). Zero is perfect equality and 100 is one person holding everything. Above 40 is the level usually treated as socially strained, and Peru sits above it.
40
LGBTQ+ status: MixedSolo female travel: Take care93.7% adult literacyIndustry to avoid: Illegal gold mining in Madre de Dios (La Pampa), which drives Amazon deforestation and mercury pollution; Amazon oil spills
Getting around, breathing, throwing away, learning. The honest checklist.
TransportAirWaterWastePower
✓How you get around Long distance buses (Cruz del Sur and others), domestic flights, colectivos, trains to Machu Picchu and boats on Lake Titicaca
✓Air quality, measured Modelled annual mean 24.8. The WHO guideline is 5 µg/m³.
✓Where the air is cleanest Remote Amazon interior and high Andes away from Lima
·Tap water Not drinkable
✓What to drink Bottled water; in the Amazon and Cusco the altitude and climate make hydration a priority.
✓Plastic rules Yes, single use plastics regulated and phased out under Law 30884 of 2018
✓Sockets and voltage Type A/B/C, 220V (Brazil 127/220V)
93.7%
literacy. Public spending on education runs at 4.4% of GDP and 19.2% of all government spending, and secondary enrolment stands at 108.3% gross (UNESCO Institute for Statistics, 2024).
Made in Peru.
Peru sustains a world renowned natural fibre tradition: alpaca and the ultra fine vicuna, the finest animal fibre in the world, plus pima and native coloured cotton, all woven on backstrap looms in communities such as Chinchero and on Taquile island, whose textile art is UNESCO listed. These are living, daily crafts and a serious export. Every step of processing done at home is value that stops leaving the country.
What Peru actually sells the world
The single biggest thing Peru sells the world is ores, slag and ash, 41.9% of all exports in 2023 (about US$26.95 billion, UN Comtrade). The next four are pearls, gemstones and precious metals at 13.5%, fruit and nuts at 8.5%, mineral fuels and oils at 6.8%, copper at 5.6%.
Made now · natural materials
Chinchero
Worked in Peru from local material, and still a working craft rather than a museum piece.
Made now · natural materials
On Taquile island
Worked in Peru from local material, and still a working craft rather than a museum piece.
Made now · natural materials
Daily crafts
Worked in Peru from local material, and still a working craft rather than a museum piece.
Made now · natural materials
Serious export
Worked in Peru from local material, and still a working craft rather than a museum piece.
Buys in · 12.9% of imports
Machinery and mechanical appliances
Peru imported US$6.73 billion of machinery and mechanical appliances in 2023, 12.9% of everything it bought abroad, and sells none of it back. Every point of that is a business that could be built at home rather than shipped in. UN Comtrade.
Buys in · 9.3% of imports
Vehicles
Peru imported US$4.85 billion of vehicles in 2023, 9.3% of everything it bought abroad, and sells none of it back. Every point of that is a business that could be built at home rather than shipped in. UN Comtrade.
Buys in · 8.0% of imports
Electrical machinery and electronics
Peru imported US$4.19 billion of electrical machinery and electronics in 2023, 8.0% of everything it bought abroad, and sells none of it back. Every point of that is a business that could be built at home rather than shipped in. UN Comtrade.
Buys in · 4.2% of imports
Plastics
Peru imported US$2.20 billion of plastics in 2023, 4.2% of everything it bought abroad, and sells none of it back. Every point of that is a business that could be built at home rather than shipped in. UN Comtrade.
The maths for an entrepreneur. Peru produces about US$335 billion a year, which is roughly US$9,684 per person (2025, World Bank). Farming is 7.5% of that, while food is 11.9% of everything the country imports. The country buys in more food than its own farms contribute to the economy, and every point of that gap is a business someone could build here rather than ship in.
A living tradition of Peru, still practised rather than archived.
Marinera national dance
A living tradition of Peru, still practised rather than archived.
Danza de las tijeras (scissors dance)
A living tradition of Peru, still practised rather than archived.
Afro-Peruvian festejo
A living tradition of Peru, still practised rather than archived.
Inti RaymiA living tradition of Peru, still practised rather than archived.
Qoyllur Riti pilgrimageA living tradition of Peru, still practised rather than archived.
Does Peru protect its heritage by law?
Partly, and the gaps say as much as the protections.
What is kept alive. Peru sustains one of the richest living heritages in the Americas, rooted in Quechua and Aymara Andean culture alongside Amazonian and Afro-Peruvian traditions. Music and dance such as the huayno, the national marinera and the Afro-Peruvian festejo are widely performed, and the danza de las tijeras, the scissors dance, is inscribed by UNESCO. Andean spirituality endures through reverence for Pachamama and the mountain apus, expressed in pilgrimages such as Qoyllur Riti and the Inti Raymi sun festival.
Who it belongs to. Peru has deep living indigenous cultures: Quechua and Aymara communities across the Andes and numerous Amazonian peoples such as the Shipibo and Ashaninka, with everyday language, dress, farming and weaving traditions intact. Community based tourism thrives on Lake Titicaca's Taquile and Amantani islands and in Sacred Valley weaving villages, keeping income local, even as Machu Picchu draws mass, more extractive tourism.
Only here. The Potato Park (Parque de la Papa) near Cusco, where Quechua communities safeguard over 1,300 native potato varieties.
Three futures for Peru, every one run forward from measured data.
Where the making actually happens
Named cultural and craft sites on the open map: Larco Herrera Museum (Pueblo Libre), National Museum of Archaeology (Pueblo Libre), Museum of the Nation (San Borja), Italian Art Museum (Lima), Gold Museum of Peru (Santiago de Surco). OpenStreetMap. Named craft workshops on the open map: Ardilla Art, Artesanía Awaq Awaqki Ohuay, Atenea, Charicrafts, Compra de conchilla, El Arte Peruano.
Every measured trend on one line
Run forward at the pace already recorded.
-5%
Forest cover
1995: 59.3 % → 2023: 56.1 %
-23%
Renewable electricity
1995: 80.3 % → 2021: 61.8 %
+90%
CO2 per person
1995: 1.06 t → 2024: 2.02 t
-32%
Tourist arrivals
2004: 1650 k → 2020: 1119 k
-29%
Protected land
2013: 31.3 % → 2025: 22.1 %
-26%
Farm workforce
1995: 31.4 % → 2025: 23.1 %
+1217%
Protected sea
2013: 0.6 % → 2025: 7.9 %
+9%
Agricultural land
1995: 17.5 % → 2023: 19.1 %
+21%
Urban population
1995: 70.9 % → 2025: 85.6 %
-53%
Air pollution
1995: 65.9 µg/m³ → 2023: 31.1 µg/m³
-27%
Fresh water per person
1995: 67395.2 m³ → 2022: 49021 m³
+64%
Adult overweight
1995: 41.4 % → 2022: 68.1 %
+43%
Electricity access
1995: 67.4 % → 2024: 96.5 %
+342%
GDP per person
1995: 2190 → 2025: 9684
+42%
Population
1995: 24349 k → 2025: 34577 k
-8%
Renewable energy use
1995: 33.3 % → 2021: 30.6 %
+83%
Energy per person
1995: 450.6 kg → 2023: 823.4 kg
-14%
Protected area, total
2013: 19.2 % → 2025: 16.5 %
+16%
Life expectancy
1995: 67.2 yrs → 2024: 77.9 yrs
+84%
Cereal yield
1995: 2641 ha → 2024: 4851 ha
+162%
Fertiliser use
1995: 35.7 ha → 2023: 93.5 ha
-51%
Rural population
1995: 29.1 % → 2025: 14.4 %
-15%
Water productivity
2008: 10.1 $/m3 → 2022: 8.6 $/m3
+28%
Health spending
2000: 4.41 % → 2023: 5.64 %
-5%
Forest area
1995: 758732 km2 → 2023: 718119 km2
+196%
Electric power use
1995: 539.4 kWh → 2023: 1595 kWh
+47%
Emissions: Agriculture
1990: 18.7 e → 2023: 27.5 e
+22%
Emissions: Building
1990: 5.88 e → 2023: 7.17 e
+311%
Emissions: Electricity/Heat
1990: 4 e → 2023: 16.4 e
+165%
Emissions: Energy
1990: 24.6 e → 2023: 65.1 e
+549%
Emissions: Industrial Processes
1990: 1.23 e → 2023: 7.98 e
+140%
Emissions: Manufacturing/Construction
1990: 4.1 e → 2023: 9.83 e
World Bank open data, recorded series
How much forest is left?
Forest cover moved from 59.3% to 56.1% across 28 recorded years.
World Bank AG.LND.FRST.ZS
How clean is the grid?
Renewable electricity moved from 80.3% to 61.8% across 26 recorded years.
World Bank EG.ELC.RNEW.ZS
How much climate pollution per person?
CO2 per person moved from 1.1 t to 2.0 t across 29 recorded years.
World Bank EN.GHG.CO2.PC.CE.AR5
How many people visit?
Tourist arrivals moved from 1650k to 1119k across 16 recorded years.
World Bank ST.INT.ARVL
How much land is protected?
Protected land moved from 31.3% to 22.1% across 12 recorded years.
World Bank ER.LND.PTLD.ZS
How many people still farm?
Farm workforce moved from 31.4% to 23.1% across 30 recorded years.
World Bank SL.AGR.EMPL.ZS
How much sea is protected?
Protected sea moved from 0.6% to 7.9% across 12 recorded years.
World Bank ER.MRN.PTMR.ZS
How much land is farmed?
Agricultural land moved from 17.5% to 19.1% across 28 recorded years.
World Bank AG.LND.AGRI.ZS
How fast is it urbanising?
Urban population moved from 70.9% to 85.6% across 30 recorded years.
World Bank SP.URB.TOTL.IN.ZS
Is the air getting cleaner?
Air pollution moved from 65.9 µg/m³ to 31.1 µg/m³ across 28 recorded years.
World Bank EN.ATM.PM25.MC.M3
Is water getting scarcer?
Fresh water per person moved from 67395.2 m³ to 49021.0 m³ across 27 recorded years.
World Bank ER.H2O.INTR.PC
Is diet-related disease rising?
Adult overweight moved from 41.4% to 68.1% across 27 recorded years.
World Bank SH.STA.OWAD.ZS
Who has power?
Electricity access moved from 67.4% to 96.5% across 29 recorded years.
World Bank EG.ELC.ACCS.ZS
Is income rising?
GDP per person moved from 2190 to 9684 across 30 recorded years.
World Bank NY.GDP.PCAP.CD
How fast is it growing?
Population moved from 24349k to 34577k across 30 recorded years.
World Bank SP.POP.TOTL
What share of all energy is renewable?
Renewable energy use moved from 33.3% to 30.6% across 26 recorded years.
World Bank EG.FEC.RNEW.ZS
How much energy does one person use?
Energy per person moved from 450.6 kg to 823.37 kg across 28 recorded years.
World Bank EG.USE.PCAP.KG.OE
How much land and sea is protected together?
Protected area, total moved from 19.2% to 16.5% across 12 recorded years.
World Bank ER.PTD.TOTL.ZS
How long do people live?
Life expectancy moved from 67.22 yrs to 77.94 yrs across 29 recorded years.
World Bank SP.DYN.LE00.IN
How much does a hectare of cereal produce?
Cereal yield moved from 2641 kg/ha to 4851 kg/ha across 29 recorded years.
World Bank AG.YLD.CREL.KG
How much fertiliser goes on the land?
Fertiliser use moved from 35.74 kg/ha to 93.47 kg/ha across 28 recorded years.
World Bank AG.CON.FERT.ZS
How many people still live rurally?
Rural population moved from 29.11% to 14.4% across 30 recorded years.
World Bank SP.RUR.TOTL.ZS
How much value per cubic metre of water?
Water productivity moved from 10.12 $/m3 to 8.62 $/m3 across 14 recorded years.
World Bank ER.GDP.FWTL.M3.KD
How much goes on health?
Health spending moved from 4.41% to 5.64% across 23 recorded years.
World Bank SH.XPD.CHEX.GD.ZS
How much forest is there in total?
Forest area moved from 758732 km2 to 718119 km2 across 28 recorded years.
World Bank AG.LND.FRST.K2
How much electricity per person?
Electric power use moved from 539.41 kWh to 1595 kWh across 28 recorded years.
World Bank EG.USE.ELEC.KH.PC
How have agriculture emissions moved?
Agriculture emissions moved from 18.73 to 27.54 MtCO2e across 33 recorded years.
Climate Watch (WRI), historical emissions
How have building emissions moved?
Building emissions moved from 5.88 to 7.17 MtCO2e across 33 recorded years.
Climate Watch (WRI), historical emissions
How have electricity/heat emissions moved?
Electricity/Heat emissions moved from 3.99 to 16.4 MtCO2e across 33 recorded years.
Climate Watch (WRI), historical emissions
How have energy emissions moved?
Energy emissions moved from 24.55 to 65.06 MtCO2e across 33 recorded years.
Climate Watch (WRI), historical emissions
How have industrial processes emissions moved?
Industrial Processes emissions moved from 1.23 to 7.98 MtCO2e across 33 recorded years.
Climate Watch (WRI), historical emissions
How have manufacturing/construction emissions moved?
Manufacturing/Construction emissions moved from 4.1 to 9.83 MtCO2e across 33 recorded years.
Climate Watch (WRI), historical emissions
Worst caseCurrent pathBest case
Worst case
Every measured decline continues at the pace already recorded. The weakest pillar, recycling at 2/5, is the one that gives way first.
Computed from: recorded series extended with no policy change
Current path
Every line above is a recorded World Bank series for this country. The current path is simply those series continuing at the pace already measured.
Computed from: recorded series, no policy change assumed
Best case
The pledges are met on their own stated timetables and the weakest pillars are lifted to match the strongest. Peru already shows it can do this: wildlife scores 5/5.
Computed from: each published target delivered on its own date
What the best case actually asks for
Lift recycling
It scores 2 out of 5 today, among the weakest parts of Peru's record. Formal municipal recycling rates are low, in the order of a few percent, though Peru legally recognises informal recicladores who recover a meaningful share of materials. Segregation and collection remain limited outside pilot districts. Lifting it toward the 5/5 the strongest pillars already reach is what the best case turns on.
measured each year
Costs: spending and enforcement, not new technology
Lift water
It scores 2 out of 5 today, among the weakest parts of Peru's record. Nationally Peru is water rich through the Amazon basin, Andean glaciers and Lake Titicaca, but the resource is badly matched to the people: most Peruvians live on the arid Pacific coast, and Lima is one of the world's largest desert cities, dependent on rivers fed by shrinking glaciers. WHO/UNICEF JMP and World Bank data put safely managed drinking water at about 51.3 percent of the population in 2020. Coastal water stress and glacial retreat are real pressures, and tap water is not reliably safe for visitors. Lifting it toward the 5/5 the strongest pillars already reach is what the best case turns on.
measured each year
Costs: spending and enforcement, not new technology
Lift organic farming
It scores 3 out of 5 today, among the weakest parts of Peru's record. FiBL records about 1.5 percent of agricultural land as certified organic in 2020, roughly 343,000 hectares, and Peru is a top global exporter of organic coffee, cacao and banana grown by smallholder cooperatives. Lifting it toward the 5/5 the strongest pillars already reach is what the best case turns on.
measured each year
Costs: spending and enforcement, not new technology
Government and Goals in Peru.
Who is in charge of Peru now · Office-holders from the UN Protocol and Liaison Service public list of Heads of State and Heads of Government, 8 September 2026. Legislature and election dates from IFES ElectionGuide. Constitution dates from the Constitute Project. Governance scores from the World Bank Worldwide Governance Indicators 2024.
Keiko Fujimori
President
Keiko Fujimori is the head of government of Peru, in office since 28 July 2026. Every climate, protection and energy pledge on this page is delivered, or not, under this administration.
Public opinion, measured
Voice and accountability, the freedom to question government: 57.6 / 100. Above the halfway mark of governments measured. World Bank WGI 2024
Control of corruption: 33.3 / 100. Below the halfway mark of governments measured. World Bank WGI 2024
Political stability and absence of violence: 54.7 / 100. Above the halfway mark of governments measured. World Bank WGI 2024
Rule of law: 48.3 / 100. Below the halfway mark of governments measured. World Bank WGI 2024
Regulatory quality: 56.2 / 100. Above the halfway mark of governments measured. World Bank WGI 2024
Keiko FujimoriPresident
Congress of the Republic (Congreso de la República)Legislature, bicameral
Last election12 April 2026
Constitution1993, as revised to 2023
Government typepresidential republic
Peru national goals: climate commitments on record · as recorded by Climate Watch, World Resources Institute
2050
Net zero
In Policy Document
Net-zero target as recorded by Climate Watch. Status: In Policy Document (12/18/2020) ↗
The questions people actually type, answered in full sentences from the sourced data above.
swipe →
Is Peru sustainable?
Peru scores 80 out of 100 on the Throne Eco Index, across twelve equally weighted pillars. Peru runs from Pacific desert over the high Andes into the Amazon, a megadiverse country and crop origin heartland with strong protected areas and living Quechua and Amazonian cultures.
Is the water in Peru safe and plentiful?
Nationally Peru is water rich through the Amazon basin, Andean glaciers and Lake Titicaca, but the resource is badly matched to the people: most Peruvians live on the arid Pacific coast, and Lima is one of the world's largest desert cities, dependent on rivers fed by shrinking glaciers. WHO/UNICEF JMP and World Bank data put safely managed drinking water at about 51.3 percent of the population in 2020. Coastal water stress and glacial retreat are real pressures, and tap water is not reliably safe for visitors.
Can Peru feed itself?
Peru is a centre of crop origin and an agricultural powerhouse, home to thousands of native potato varieties plus maize, quinoa, beans and aji, and a leading exporter of avocado, blueberry, asparagus and grape. Staple self sufficiency in native crops is high and markets brim with domestic produce, though wheat and feed grains are imported.
Is it easy to eat plant-based in Peru?
Few countries make unprocessed plant eating easier: markets overflow with native potatoes, maize varieties, quinoa, beans, squash, aji and tropical fruit, and Andean cuisine is built on them. Meat, fish and cuy feature, but the plant base is exceptional and cheap. Peru's biodiversity of edible plants is world leading.
How much of Peru is actually protected?
Terrestrial protected areas cover about 22.3 percent of the land (World Bank, 2021), managed by SERNANP and including Manu, Tambopata, Huascaran and Paracas, and Peru created the vast Nazca Ridge (Dorsal de Nasca) marine reserve in 2021. The system is strong on paper, but illegal gold mining, logging and coca cultivation erode parts of the Amazon. Marine protection registered a low 0.5 percent in the 2021 dataset, before the new reserve is fully reflected.
What wildlife is left in Peru?
Peru is one of the planet's most biodiverse countries, ranking near the top for bird and butterfly species, with Manu among the richest protected areas on Earth. Iconic and often endemic species include the vicuna, Andean condor, spectacled bear, giant otter, pink river dolphin and many range restricted Andean birds. The World Bank and IUCN list about 51 threatened mammal and 93 threatened bird species (2022).
Is Peru on clean energy?
Roughly 60% of Peru's electricity comes from renewables, overwhelmingly hydropower which supplies close to half of generation, with natural gas making up most of the rest. Fossil carbon dioxide emissions are low at about 2.05 tonnes per person in 2024. Peru has committed to net zero greenhouse gas emissions by 2050 and released an updated National Climate Change Strategy to 2050 in late 2024, although the Climate Action Tracker notes that political instability has slowed delivery.
How polluted is Peru?
Peru's Law 30884 of 2018 progressively bans single use plastics and prohibited plastic bags and straws immediately in natural and cultural protected areas, a genuine national policy. Against that, ambient PM2.5 averaged about 24.8 micrograms per cubic metre (World Bank, 2017), high and driven by Lima traffic, and illegal Amazon gold mining releases mercury. Policy is real but air and mining pollution weigh it down.
Does recycling work in Peru?
Formal municipal recycling rates are low, in the order of a few percent, though Peru legally recognises informal recicladores who recover a meaningful share of materials. Segregation and collection remain limited outside pilot districts.
Is the farming in Peru organic?
FiBL records about 1.5 percent of agricultural land as certified organic in 2020, roughly 343,000 hectares, and Peru is a top global exporter of organic coffee, cacao and banana grown by smallholder cooperatives.
Are there natural materials and craft in Peru?
Peru sustains a world renowned natural fibre tradition: alpaca and the ultra fine vicuna, the finest animal fibre in the world, plus pima and native coloured cotton, all woven on backstrap looms in communities such as Chinchero and on Taquile island, whose textile art is UNESCO listed. These are living, daily crafts and a serious export.
Is there living culture in Peru?
Peru has deep living indigenous cultures: Quechua and Aymara communities across the Andes and numerous Amazonian peoples such as the Shipibo and Ashaninka, with everyday language, dress, farming and weaving traditions intact. Community based tourism thrives on Lake Titicaca's Taquile and Amantani islands and in Sacred Valley weaving villages, keeping income local, even as Machu Picchu draws mass, more extractive tourism.
What heritage does Peru keep alive?
Peru sustains one of the richest living heritages in the Americas, rooted in Quechua and Aymara Andean culture alongside Amazonian and Afro-Peruvian traditions. Music and dance such as the huayno, the national marinera and the Afro-Peruvian festejo are widely performed, and the danza de las tijeras, the scissors dance, is inscribed by UNESCO. Andean spirituality endures through reverence for Pachamama and the mountain apus, expressed in pilgrimages such as Qoyllur Riti and the Inti Raymi sun festival.
So is Peru actually green? The measured answer
What is working: renewable electricity at 61.8%.
What is not: sea protected at 7.9% against a 30% mark.
Peru sits 3 of 77 at 78/100. Every name links to its own destination page, built exactly like this one. The full ranking →
What is Peru particularly good at?
✓Culture, scored 5/5. Peru has deep living indigenous cultures: Quechua and Aymara communities across the Andes and numerous Amazonian peoples such as the Shipibo and Ashaninka, with everyday language, dress, farming and weaving traditions intact. Community based tourism thrives on Lake Titicaca's Taquile and Amantani islands and in Sacred Valley weaving villages, keeping income local, even as Machu Picchu draws mass, more extractive tourism.
✓Food and farming, scored 5/5. Peru is a centre of crop origin and an agricultural powerhouse, home to thousands of native potato varieties plus maize, quinoa, beans and aji, and a leading exporter of avocado, blueberry, asparagus and grape. Staple self sufficiency in native crops is high and markets brim with domestic produce, though wheat and feed grains are imported.
✓Heritage, scored 5/5. Peru sustains one of the richest living heritages in the Americas, rooted in Quechua and Aymara Andean culture alongside Amazonian and Afro-Peruvian traditions. Music and dance such as the huayno, the national marinera and the Afro-Peruvian festejo are widely performed, and the danza de las tijeras, the scissors dance, is inscribed by UNESCO. Andean spirituality endures through reverence for Pachamama and the mountain apus, expressed in pilgrimages such as Qoyllur Riti and the Inti Raymi sun festival. Amazonian peoples including the Shipibo and Ashaninka maintain their own languages, cosmology and craft.
Where does Peru score worst?
✕Pollution, scored 3/5. Peru's Law 30884 of 2018 progressively bans single use plastics and prohibited plastic bags and straws immediately in natural and cultural protected areas, a genuine national policy. Against that, ambient PM2.5 averaged about 24.8 micrograms per cubic metre (World Bank, 2017), high and driven by Lima traffic, and illegal Amazon gold mining releases mercury. Policy is real but air and mining pollution weigh it down.
✕Recycling, scored 2/5. Formal municipal recycling rates are low, in the order of a few percent, though Peru legally recognises informal recicladores who recover a meaningful share of materials. Segregation and collection remain limited outside pilot districts.
✕Water, scored 2/5. Nationally Peru is water rich through the Amazon basin, Andean glaciers and Lake Titicaca, but the resource is badly matched to the people: most Peruvians live on the arid Pacific coast, and Lima is one of the world's largest desert cities, dependent on rivers fed by shrinking glaciers. WHO/UNICEF JMP and World Bank data put safely managed drinking water at about 51.3 percent of the population in 2020. Coastal water stress and glacial retreat are real pressures, and tap water is not reliably safe for visitors.
Similar countries doing it better and worse
BrazilScored on the same twelve pillars as Peru.73
EcuadorScored on the same twelve pillars as Peru.73
ColombiaScored on the same twelve pillars as Peru.72
ChileScored on the same twelve pillars as Peru.65
A note from the lens of mother natureswipe →
Energy, 4/5
Roughly 60% of Peru's electricity comes from renewables, overwhelmingly hydropower which supplies close to half of generation, with natural gas making up most of the rest. Fossil carbon dioxide emissions are low at about 2.05 tonnes per person in 2024.
Food and farming, 5/5
Peru is a centre of crop origin and an agricultural powerhouse, home to thousands of native potato varieties plus maize, quinoa, beans and aji, and a leading exporter of avocado, blueberry, asparagus and grape. Staple self sufficiency in native crops is high and markets brim with domestic produce, though wheat and feed grains are imported.
Heritage, 5/5
Peru sustains one of the richest living heritages in the Americas, rooted in Quechua and Aymara Andean culture alongside Amazonian and Afro-Peruvian traditions. Music and dance such as the huayno, the national marinera and the Afro-Peruvian festejo are widely performed, and the danza de las tijeras, the scissors dance, is inscribed by UNESCO.
The Peru Directory.
Everything on Hold The Throne that sits in Peru, checked and listed.
World Bank Worldwide Governance Indicators, 2024. Percentile among all governments measured.
Government effectiveness
47.4 / 100
World Bank Worldwide Governance Indicators, 2024. Percentile among all governments measured.
Rule of law
48.3 / 100
World Bank Worldwide Governance Indicators, 2024. Percentile among all governments measured.
Political stability
54.7 / 100
World Bank Worldwide Governance Indicators, 2024. Percentile among all governments measured.
Voice and accountability
57.6 / 100
World Bank Worldwide Governance Indicators, 2024. Percentile among all governments measured.
Environmental Performance Index
46.5 / 100 · 85 of 180
Yale Environmental Performance Index 2024, ranked 85 of 180 countries assessed.
Ecosystem vitality
56.0 / 100 · 66 of 180
Yale Environmental Performance Index 2024, ranked 66 of 180 countries assessed.
Biodiversity and habitat
48.6 / 100 · 93 of 180
Yale Environmental Performance Index 2024, ranked 93 of 180 countries assessed.
Air pollution
74.7 / 100 · 83 of 180
Yale Environmental Performance Index 2024, ranked 83 of 180 countries assessed.
Terrestrial biomes protected
71.8 / 100 · 53 of 180
Yale Environmental Performance Index 2024, ranked 53 of 180 countries assessed.
Marine protected areas
53.4 / 100 · 89 of 131
Yale Environmental Performance Index 2024, ranked 89 of 131 countries assessed.
How Peru Is Scored. The Throne Standard.
Every destination on the index is scored the same way, so a 4 in Barbados means exactly what a 4 means in Iceland. No self-declared data and no brochure claims are accepted. Every figure on this page carries its named source and year, and the history on each page names what empire took as plainly as it scores the present.
The 12 pillars every destination is scored on, equally weighted
01
Conservation
Land and sea actually protected, not pledged
02
Wildlife
What survives, what is endemic, what is lost
03
Water
Fresh water per person, and the ocean’s health
04
Food & farming
Whether the place can feed itself
05
Organic & clean
Certified land and pesticide reality
06
Climate & energy
Emissions per person, how the grid is powered
07
Waste
Where the rubbish goes, what comes back
08
Health
What people eat and die of
09
Heritage
Living culture, and what the law keeps standing
10
Ownership
Who owns the economy, how much of a dollar stays
11
Governance
Freedom, honesty, promises kept
12
Future
Measured trends run forward, pledges against pace
What each 0 to 5 pillar score means, in plain words
The institutions above are the ones cited on this page, ranked by how many of its figures they carry. This same sectioned page renders for all 77 scored destinations, each with its own researched history, comparison charts and three-way future. Read the full methodology
Every figure on this page, and where it came from: 71 sources across 29 institutions
World Bank18 FIGURES
Terrestrial protected areas (percent of total land area) ER.LND.PTLD.ZS, 2021. check
Marine protected areas (% of territorial waters) ER.MRN.PTMR.ZS, 2025 check
PM2.5 air pollution, mean annual exposure (micrograms per cubic metre) EN.ATM.PM25.MC.M3, 2017. check
Threatened species (mammals EN.MAM.THRD.NO, birds EN.BIR.THRD.NO, fish EN.FSH.THRD.NO, higher plants EN.HPT.THRD.NO), 2022 check
Renewable electricity output (% of total) EG.ELC.RNEW.ZS, 2021 check
CO2 emissions per capita EN.GHG.CO2.PC.CE.AR5, 2024 check
Peru, IUCN Red List category Critically Endangered, class Mammalia, Critically Endangered on the IUCN Red List, and recorded in Peru in GBIF occurrence data (mammal). check
Peru, IUCN Red List category Critically Endangered, class Mammalia corroboration check
Peru, IUCN Red List category Critically Endangered, class Mammalia corroboration check
Peru, IUCN Red List category Critically Endangered, class Aves, Critically Endangered on the IUCN Red List, and recorded in Peru in GBIF occurrence data (bird). check
Peru, IUCN Red List category Critically Endangered, class Aves corroboration check
Peru, IUCN Red List category Critically Endangered, classes Squamata and Testudines, Critically Endangered on the IUCN Red List, and recorded in Peru in GBIF occurrence data (reptile). check
Peru, IUCN Red List category Critically Endangered, classes Squamata and Testudines corroboration check
Peru, IUCN Red List category Critically Endangered, class Insecta, Critically Endangered on the IUCN Red List, and recorded in Peru in GBIF occurrence data (insect). check
Peru, IUCN Red List category Critically Endangered, class Insecta corroboration check
Other published sources7 FIGURES
The Zona Arqueologica Caral (Ministerio de Cultura) states the finds show a peaceful society, because no walls or weapons were found, and that it interrelated with other cultures of the coast, highlands and jungle; its own research presents Spondylus shell from the Ecuadorian coast at Caral, so "no outside contact" is wrong while "no sign of warfare" is sourced check
Carrying passengers again: the MTC restarted it on 17 March 2023 and again from 20 December 2024, free, Mondays and Fridays over the 57 km Chilca to Cuenca section, and Ositran reports the modernisation concession contract signed 28 May 2025, running to 2055 check
UNESCO Representative List of the Intangible Cultural Heritage of Humanity, 'Taquile and its textile art' (Peru, inscribed 2008), Peru sustains a world renowned natural fibre tradition: alpaca and the ultra fine vicuna, the finest animal fi check
UNESCO Representative List of the Intangible Cultural Heritage of Humanity, 'Taquile and its textile art' (Peru, inscribed 2008) corroboration check
UNESCO Representative List of the Intangible Cultural Heritage of Humanity, 'Taquile and its textile art' (Peru, inscribed 2008) corroboration check
UNESCO Representative List of the Intangible Cultural Heritage of Humanity, 'Taquile and its textile art' (Peru, inscribed 2008) corroboration check
UNESCO Representative List of the Intangible Cultural Heritage of Humanity, 'Scissors dance' (Peru, inscribed 2010), Music and dance such as the huayno, the national marinera and the Afro-Peruvian festejo are widely performed check
Autoridad Nacional del Agua (ANA)4 FIGURES
Peru, Politica y Estrategia Nacional de los Recursos Hidricos al 2050, segundo entregable (2026), Nationally Peru is water rich through the Amazon basin, Andean glaciers and Lake Titicaca, but the resource is check
Peru, Politica y Estrategia Nacional de los Recursos Hidricos al 2050, segundo entregable (2026) corroboration check
Peru, Politica y Estrategia Nacional de los Recursos Hidricos al 2050, segundo entregable (2026) corroboration check
Peru, Politica y Estrategia Nacional de los Recursos Hidricos al 2050, segundo entregable (2026) corroboration check
BirdLife International, IUCN and UNEP-WCMC3 FIGURES
UN SDG Global Database, terrestrial Key Biodiversity Areas covered by protected areas (%) ER_PTD_TERR, Peru, 2025 (22.6%), country-reported check
UN SDG Global Database, marine Key Biodiversity Areas covered by protected areas (%) ER_MRN_MPA, Peru, 2025 (51.2%), country-reported check
UN SDG Global Database, freshwater Key Biodiversity Areas covered by protected areas (%) ER_PTD_FRHWTR, Peru, 2025 (24.7%), country-reported check
UNESCO Institute for Statistics3 FIGURES
UIS public data API, Peru, 2024, Public spending on education runs at 4.4% of GDP and 19.2% of all government spending, and secondary enrolment check
UIS public data API, Peru, 2024 corroboration check
UIS public data API, Peru, 2024 corroboration check
FAO, Global Forest Resources Assessment2 FIGURES
UN SDG Global Database, forest area (% of land area) AG_LND_FRST, Peru, 2025 (52.5%), country-reported check
UN SDG Global Database, forest area inside legally established protected areas (%) AG_LND_FRSTPRCT, Peru, 2025 (26.5%), country-reported check
UNESCO2 FIGURES
Taquile and its textile art, and Manu and Huascaran national parks. check
Sacred City of Caral-Supe (Peru, inscribed 2009), Pyramids, sunken plazas and planned settlements in the Supe valley, the oldest known centre of civilisation in check
Sacred City of Caral-Supe (Peru, inscribed 2009) corroboration check
WHO/UNICEF Joint Monitoring Programme2 FIGURES
UN SDG Global Database, population using safely managed drinking water (%) SH_H2O_SAFE, Peru, 2024 (49.4%), modelled estimate check
UN SDG Global Database, population using safely managed sanitation (%) SH_SAN_SAFE, Peru, 2024 (56.5%), modelled estimate check
Forest area (percent of land area) AG.LND.FRST.ZS, 2022. check
FAOSTAT 2024 for Peru: sugar cane 121 FIGURE
038,562 t, potatoes 6,579,754 t, rice 3,640,432 t, bananas 2,343,311 t, maize 1,686,077 t; the item "Plantains and cooking bananas" is blank for Peru in 2022, 2023 and 2024, so it cannot be one of the largest crops check
FiBL1 FIGURE
The World of Organic Agriculture 2022 (2020 data), organic farmland share. check
Haageocereus tenuis is Critically Endangered1 FIGURE
but Carex acutata Boott is Not Evaluated and has no Red List assessment at all (checked against the IUCN Red List checklist published 28 July 2026) check


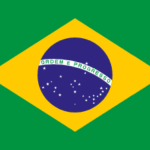 BrazilScored on the same twelve pillars as Peru.73
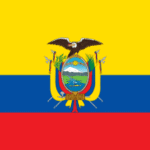 EcuadorScored on the same twelve pillars as Peru.73
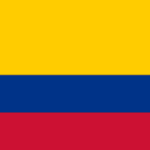 ColombiaScored on the same twelve pillars as Peru.72
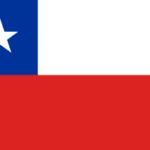 ChileScored on the same twelve pillars as Peru.65