Destinations › Africa · The Destination Index · recorded destination information · verify source dates and scope

Rwanda.

Central Africa, east of the Democratic Republic of the Congo, north of Burundi. 26,338 sq km and 14,569,341 people, landlocked, with no coastline at all, temperate; two rainy seasons (February to April, November to January); mild in mountains with frost and snow possible.
Region · Africa Population · ~14,569,341 Languages · Kinyarwanda, spoken by almost everyone. English, French and Swahili are also official Eco Index · 57/100 · Weak · ranked 65 of 77
1,634,000 visitors a year · 14,569,341 residents
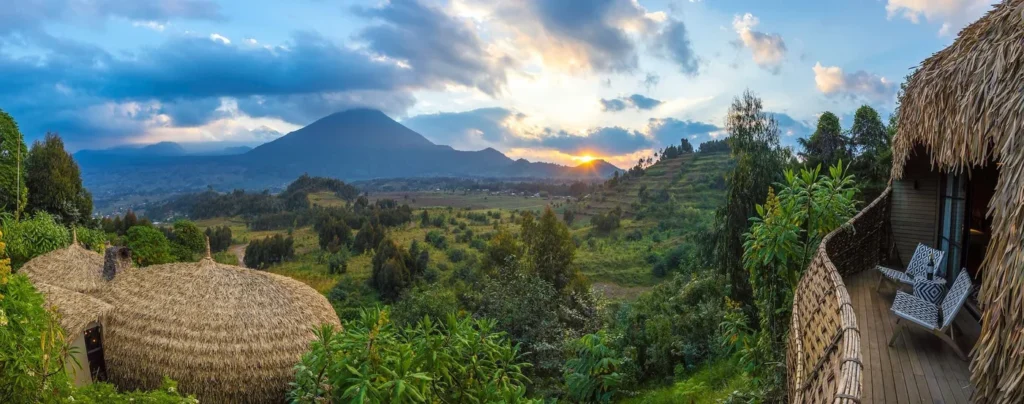
Header photo · Ana Kenk

Every figure below carries its named source and year. The Eco Index scores twelve pillars on the same scale everywhere; seven are measured from published data with fixed thresholds, five are assessed from the named sources.

Rwanda at a Glance.

The score, and the four numbers that set the tone. 12 equally-weighted pillars, every pillar sourced.
Compare with:
Eco IndexWeak
57/100
12 pillars, all sourced, scored below All 77 ranked
Renewable power
50%
of electricity
Food imported
22%
of merchandise imports · ~US$1,138m a year
The Eco Index across 12 pillars · scored 0 to 5 · World Bank, OWID, WHO/UNICEF JMP, FiBL, Protected Planet, IUCN, UNESCO (2023-24)
Water
Food & farming
Plant-based
Organic
Conservation
Wildlife
Materials
Pollution
Recycling
Energy
Culture
Heritage

Facts That Surprise People About Rwanda.

The numbers and firsts that change how you see Rwanda, the sobering and the remarkable. Every one is dated and linked to its source.
SoberingFood
More than a quarter of young children are stunted
The 2025 Rwanda Demographic and Health Survey found 27% of children under five are stunted, down from 33% in 2019 to 2020. The fall of about one point a year is slower than the national target of three.
SoberingHealth
Teenage pregnancy is rising
Teenage pregnancy among girls aged 15 to 19 rose from 5% in 2019 to 2020 to 8% in the 2025 national health survey.
SoberingNature
Lions were poisoned out of the country
After the 1994 genocide, returning refugees settled in Akagera and poisoned predators to protect livestock, and lions vanished from Rwanda. They were reintroduced from South Africa in 2015, about 15 years later.
RemarkablePeople
Women hold almost two thirds of seats in parliament
After the 2024 election, women hold 63.8% of seats in Rwanda's Chamber of Deputies, up from 61.3% in 2018. The constitution requires at least 30%.
RemarkableEnvironment
Plastic bags have been illegal since 2008
Rwanda banned non biodegradable polythene bags in 2008. Shops switched to paper and other packaging, though a black market for plastic bags persists.
RemarkableNature
Nyungwe is the region's largest natural forest block
Nyungwe National Park became a World Heritage Site in September 2023. Its 101,900 hectares hold more than a dozen primate species and 322 bird species.
Worth knowingHistory
Genocide memorials are now World Heritage Sites
In 2023 UNESCO added four memorials to the 1994 genocide against the Tutsi, at Nyamata, Murambi, Gisozi and Bisesero, to the World Heritage List. UNESCO had paused listing sites of atrocity in 2018 while it debated them.

The History of Rwanda.

Living heritage is strong and actively practised, not archived. Intore dance and ingoma drumming are performed by working troupes, imigongo geometric art is a distinct regional tradition still made in the east, and agaseke basketry carries real cultural weight.
The land itself: grassy uplands and hills, mountainous in relief, with altitude falling from west to east. Its high point is Volcán Karisimbi, 4,519 m. Source: UK Permanent Committee on Geographical Names toponymic factfile.
Where it starts
Ironworkers long before the kingdom
The Urewe culture dominates the archaeology of the Great Lakes region from about 500 BC to AD 800. A Urewe burial found in Rwanda, dating to the middle of the first millennium AD, held products of iron working and an object from long-distance exchange, the first such iron technology from this period to be analysed scientifically. Much later, around the middle of the 17th century, the Nyiginya kingdom was founded, and it went on to shape the hills that became Rwanda.
How it got here
Indirect rule, identity cards, 1994
The reign of Mwami Kigeli Rwabugiri from 1867 to 1895 centralised power through purges and the promotion of the king's men, and Hutu and Tutsi hardened into opposed social categories. At the Berlin Conference of 1884 to 1885 Rwanda was assigned to the German zone. Belgium defeated Germany there in 1916 and introduced identity cards with an ethnic designation. Rwanda became independent on 1 July 1962. In 1994 more than one million people were killed in about one hundred days in the genocide against the Tutsi.
The timeline
c. 500 BC to AD 800
Urewe ironworking.
The Urewe culture dominates the archaeology of the Great Lakes region from about 500 BC to AD 800. A Urewe burial found in Rwanda, dating to the middle of the first millennium AD, held products of iron working and an object from long-distance exchange. Source
17th century onward
The Kingdom of Rwanda.
Historians place the founding of the Nyiginya kingdom around the middle of the 17th century. Source
1867 to 1895
Consolidation under Rwabugiri.
The reign of Mwami Kigeli Rwabugiri centralises power through repeated purges and the promotion of the king's men, while the line between Hutu and Tutsi hardens. Source
1884 to 1885
German colonisation.
At the Berlin Conference, Rwanda is assigned to the German zone, and its borders are later reduced. Source
1916 to 1962
Belgian rule.
Belgium defeats Germany in Rwanda during the First World War and takes control, later introducing identity cards with an ethnic designation. Source
1962
Independence.
Rwanda becomes independent on 1 July 1962, ending Belgian administration under a United Nations trusteeship. Source
1994
The genocide against the Tutsi.
More than one million people were killed in about one hundred days. Source

Nature and Biodiversity in Rwanda.

About 9.1% of Rwanda's land is protected (World Bank, 2025), which is thin by regional standards and reflects how little spare land a country this densely farmed has. What is protected is significant: Volcanoes National Park in the Virungas, Nyungwe National Park, inscribed on the UNESCO World Heritage List in September 2023 as one of Rwanda's first two World Heritage Sites, and Akagera, where African Parks has restored lion and rhino to a savannah that had lost them.
Is wild Rwanda protected? 9.1% of the land is, against a 30% target for 2030
How protected is nature in Rwanda?
Forest cover26.1%
Terrestrial protected area9.1%
185 (mammals, birds, fish & plants) listed as threatened.
Found only here. Albertine Rift endemics; the mountain gorilla, shared with Uganda and the DRC
The watchlist
ThreatenedBlack Rhino (Diceros bicornis) Critically Endangered on the IUCN Red List, and recorded in Rwanda in GBIF occurrence data (mammal).
ThreatenedNecrosyrtes monachus Critically Endangered on the IUCN Red List, and recorded in Rwanda in GBIF occurrence data (bird).
ThreatenedAfrican Pygmy Elephant (Loxodonta cyclotis) Critically Endangered on the IUCN Red List, and recorded in Rwanda in GBIF occurrence data (mammal).
ThreatenedLoxodonta africana Endangered on the IUCN Red List, and recorded in Rwanda in GBIF occurrence data (mammal).
ThreatenedTrigonoceps occipitalis Critically Endangered on the IUCN Red List, and recorded in Rwanda in GBIF occurrence data (bird).
ThreatenedRuppell's griffon (Gyps rueppellii) Critically Endangered on the IUCN Red List, and recorded in Rwanda in GBIF occurrence data (bird).
ThreatenedGyps africanus Critically Endangered on the IUCN Red List, and recorded in Rwanda in GBIF occurrence data (bird).
What is still here, and what is gone?
Tap a species for the honest status.
Closest to being lost, by name
Black Rhino (Diceros bicornis)
Critically Endangered, the last IUCN category before Extinct in the Wild, and still recorded in Rwanda. GBIF holds 2 verified occurrence records.
Necrosyrtes monachus
Critically Endangered, the last IUCN category before Extinct in the Wild, and still recorded in Rwanda. GBIF holds 513 verified occurrence records.
African Pygmy Elephant (Loxodonta cyclotis)
Critically Endangered, the last IUCN category before Extinct in the Wild, and still recorded in Rwanda. GBIF holds 2 verified occurrence records.
Species named here are drawn from GBIF occurrence records for Rwanda filtered to the IUCN Red List threatened categories. Species are listed where GBIF holds occurrence records for them in this country. Record counts are not published here because the figure cannot be reproduced from a public GBIF query.
Who is putting it back
Rwanda
National park in Northern Province, mapped and named in the open record for Rwanda. OpenStreetMap.
National park in Western Province, mapped and named in the open record for Rwanda. OpenStreetMap.
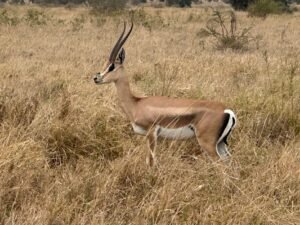
A Grant's gazelle standing in the dry grassland of Serengeti National Park, Tanzania.
National park in Eastern Province, mapped and named in the open record for Rwanda. OpenStreetMap.
National park in Western Province, mapped and named in the open record for Rwanda. OpenStreetMap.

Water and Ocean in Rwanda.

Rwanda is well watered for its size, fed by reliable rainfall across the hills, Lake Kivu and the headwaters that feed the Nile basin, so raw supply is rarely the binding constraint. The gap is treatment and delivery: tap water is not drinkable anywhere, and rural households still walk for it. Steep terrain also means heavy rain moves soil into rivers, which is what the terracing programmes are fighting.
Does Rwanda have enough fresh water? Yes, with headroom
Bottled or filtered water; altitude and dry air mean drink more than you think.
Cleanest water: Streams off the Virunga volcanoes and the Nyungwe highlands
How much fresh water does Rwanda have, per person?
696 m³
Rwanda
1,000 m³
the UN “water scarce” line
Rwanda withdraws about 610 million cubic metres of fresh water a year (2022). That is 20.2% of the fresh water actually available to it, which FAO counts as medium water stress. Of what is taken, farming takes 60%, homes and towns 38%, industry 2%. Source: FAO AQUASTAT.
Where does the sewage go?
81.3%
of people have at least basic sanitation
81.3% of people here use at least a basic toilet not shared with other households (2024, World Bank / WHO UNICEF JMP). No figure is published for how much of that waste is safely treated, so the share reaching the ground or the water untreated is unknown.
Is the tap water safe in Rwanda?
Infrastructure minister Jimmy Gasore told the Senate in November 2025 that treated water leaving the plants meets safety standards, but that quality cannot yet be guaranteed all the way to the household. WASAC's chief executive said contamination mainly enters during transport, through old pipes and leaks, and 39.5 per cent of water is lost before it reaches customers. Public advisories still say to boil water before drinking, and the government's target is for tap water to be safe to drink by 2029. In March 2026 the Senate also called for regular quality testing of all suppliers, noting that some private rural operators test little because of the cost. Boil or filter tap water.
How hard is the water supply being pushed?
Of every 10 buckets nature refills, 2 are already taken. Withdrawals run at 20.2% of what Rwanda renews internally each year (2022, World Bank / FAO AQUASTAT). That is inside the 25% mark generally treated as water stress, so the supply has headroom.
When is the best time to visit Rwanda? Tap your month.
Tap your month.
How much fresh water does Rwanda actually have?
Nature renews about 696 cubic metres of fresh water per person per year here. That ranks Rwanda 40 of 208 countries measured, placing it among the 40 driest countries on Earth per person. The UN treats anything under 1,000 cubic metres as water scarce, and this is below that line. World Bank / FAO AQUASTAT.

Food and Drink in Rwanda.

Farming still employs about 35% of Rwandan workers (World Bank, 2025). Under the national land consolidation programme, farmers jointly cultivate large areas for selected crops while keeping ownership of their own plots, which has given them better access to subsidised inputs, irrigation and machinery (FAO GIEWS). Beans, sweet potato, maize, cassava and sorghum are among the crops households plant most (NISR Agricultural Household Survey).
Where does the food in Rwanda come from?
22.4% imported
about US$1,138m a year
On the plate: Beans, sweet potato, cassava, plantain (igitoki), maize, sorghum and cooked greens (isombe)
2 of 10
bites are imported
The island buys in more food energy than it eats. About US$1,138m a year leaves the country to pay for it. The green slice is roughly what still grows here.
About 22.4% of everything Rwanda buys in from abroad is food, roughly 2 in every 10 imported items on the dock (2022, World Bank). Farming itself is 20.3% of the economy and 76.3% of the land is agricultural, of which 47% is arable. The green slice is roughly what still grows here.
What is killing people in Rwanda? The imported diet.
Cause of death, and the diet behind it.
Non-communicable diseases, all combined50.3%
Diabetes2.1%
Adults living with overweight or obesity. 19.8%.
Can Rwanda feed itself?
48.9%
Arable land
76.3%
Agricultural land
2,048,147
Farmers
2,864,122
Arable acres
20.3%
Agriculture, share of GDP
Harvest: Two main harvests, around January to February and June to July
Feeding itself
Farming still employs about 35% of Rwandan workers (World Bank, 2025) on some of the most intensively cultivated land in Africa. The country grows most of what it eats on smallholdings, terraced up hillsides, and beans, sweet potato, cassava, plantain and maize carry the everyday plate.
Certification
There is no reliable published figure for certified organic farmland in Rwanda, so this pillar is scored on practice rather than certification. In practice most Rwandan smallholdings are low-input by economics rather than by choice, with limited access to synthetic fertiliser, but there is no national certifier and no organic premium reaching farmers at scale.
Water for crops
Rwanda is well watered for its size, fed by reliable rainfall across the hills, Lake Kivu and the headwaters that feed the Nile basin, so raw supply is rarely the binding constraint. The gap is treatment and delivery: tap water is not drinkable anywhere, and rural households still walk for it.
Why the organic number looks like that. Certified-organic farmland is not separately reported for Rwanda, and that is a certification gap rather than proof nothing is grown cleanly. What the official land record does show: 76.3% of the country is agricultural land and 47% is arable (2023, World Bank). Certification is paid for per farm per year by a foreign body, which prices out smallholders, so the organic number reads worse than the practice.
What actually grows here
BananasCassavaSweet potatoesPlantainsPotatoesMaizeBeansPumpkins/squashTaroSorghum
The food that already fits
The plant-based kitchen here is not an import. By tonnage, the largest crops grown in Rwanda are bananas, sweet potatoes, cassava, potatoes and maize (FAO, FAOSTAT crop production, 2024). That is what the land itself puts on a plate.
Buy direct where residents buy: Bugarama Market, Buhinga Market, Buringa Market, Cyizi Market, Cyome Market, Gasarenda Market. Each is a mapped, named marketplace, so the money stays with the seller rather than the importer. OpenStreetMap.
Not yet checked by us. Plant based kitchens listed publicly: Hi Pima Restaurant, vegan hotel restaurant in Kigali: a rotating plant based menu; SZY, vegan restaurant in Kigali: brunch, burgers, pizza and pasta; Bhakti Food Plus, vegetarian restaurant in Kigali: mostly Indian food, some dishes made vegan on request; Preet Fast Food, vegetarian kitchen in Kigali: Gujarati and Saurashtra style food, vegan on request. Tell us how they are.
Is this grown in Rwanda?
Tap a food for the honest answer.
BeansSweet potatoCassavaMaizeSorghum

Climate and Energy in Rwanda.

About 60% of Rwanda's electricity is renewable (World Bank, 2021), from hydropower plus the unusual case of methane extracted from Lake Kivu. That is a good share but not a leading one, and only about 72% of Rwandans had electricity access as of 2024 (World Bank), so a lot of household energy is still charcoal and firewood, which is what shows up in the air quality figure.
What powers Rwanda?
Renewable 49.6%Fossil 50.4%
The grid is run by a state owned, vertically integrated utility. Rwanda Energy Group, set up in July 2014, is the holding company, and its subsidiary EUCL generates, transmits, distributes and sells electricity and has a monopoly on supply to grid customers, while EDCL plans and builds new infrastructure. Independent power producers sell bulk power to EUCL. The regulator is RURA, which licenses generation, transmission, distribution and trade, sets end user tariffs and reviews power purchase agreements. In September 2025 the cabinet said electricity tariffs were under review for the first time since 2020, with access having risen to 85 per cent of the population in 2025.
Climate pollution per person
The safe amount, what the planet can absorb
2 tonnes
One person here
0.16 tonnes
The world average, for comparison
4.7 tonnes
The worst it ever got
0.16 tonnes
The grid
About 60% of Rwanda's electricity is renewable (World Bank, 2021), from hydropower plus the unusual case of methane extracted from Lake Kivu. That is a good share but not a leading one, and only about 72% of Rwandans had electricity access as of 2024 (World Bank), so a lot of household energy is still charcoal and firewood, which is what shows up in the air quality figure.
Pollution
This is the sharpest split on the page. Rwanda has arguably the world's strictest plastic policy: bags were banned in 2008 and Law 17/2019 extended it to single-use plastics, with bags searched for at the border.
Water stress
Rwanda is well watered for its size, fed by reliable rainfall across the hills, Lake Kivu and the headwaters that feed the Nile basin, so raw supply is rarely the binding constraint. The gap is treatment and delivery: tap water is not drinkable anywhere, and rural households still walk for it.
What pollutes most here
1The grid The share of electricity still generated from fossil fuel.40.1%
2Industry Charcoal and biomass cooking smoke, and artisanal mining pressure near forest edges.named
3Air Modelled annual mean against a WHO guideline of 5 µg/m³.36.0 µg/m³ (PM2.5)
4On the record This is the sharpest split on the page.
What has Rwanda promised on climate?
Net zero, whole economy2050
Electricity renewable today59.9% (2021)
Land protected, against a 30% target9.1% by 2025
The net-zero target year on file with Climate Watch is 2050, status: in political pledge. Measured against it, 59.9% of electricity is already renewable (2021, World Bank), so 40.1% of the grid is still to be converted. The pledge on file is measured here against what has actually been delivered, not taken on its own (UNFCCC NDC Registry, CBD Kunming-Montreal Target 3).
The biggest line item
One return flight against a whole year of living.
A resident's entire year0.16 t CO2e
Safe-climate budget, per year2 t CO2e
Los Angeles return, economy2.74 t CO2e
Sydney return, economy2.29 t CO2e
New York return, economy2.04 t CO2e
Singapore return, economy1.48 t CO2e
London return, economy1.19 t CO2e
How much CO2 does flying to Rwanda emit?
Tap where you would fly from. One return flight, economy.
Firsts on climate finance. In December 2022 the IMF approved about US$319 million for Rwanda under its new Resilience and Sustainability Facility, and said Rwanda was the first African and low income country to secure access to it. In November 2022, at COP27 in Egypt, Rwanda launched Ireme Invest, a green investment facility of over US$100 million. In September 2023 the Development Bank of Rwanda listed its first sustainability linked bond, targeting 30 billion Rwandan francs, about US$24.8 million, on the Rwanda Stock Exchange. The World Bank says it was the first such bond by a national development bank globally and in East Africa.

AI and Data Centres in Rwanda.

Every prompt runs on a machine in a building on somebody’s grid. What that costs the planet depends less on the prompt than on what is burning to power it. Here is what would power one in Rwanda.
Data centres
4
Registered colocation and interconnection facilities, PeeringDB, 2026
Grid renewable
49.6 %
What a machine here runs on.
What powers a data centre in Rwanda?
Most of the power behind a machine here is still burned.
Renewable 49.6%Fossil 50.4%
Cooling water. Every one of those halls runs on the national grid, which is 59.9% renewable today (World Bank). A data centre is only as clean as the electricity behind it, so the same figure that decides this country's climate score also decides the footprint of the AI running inside it. Cooling water use is not separately published by facility, and no operator here reports it.
The rules. Rwanda has 4 colocation and interconnection facilities on the public PeeringDB register, concentrated in Kigali (4), alongside 1 internet exchange (RINEX). Named sites include Telecom House Kigali, MTN Centre Kigali, TrAC CDC - B.Secure, AOS Ltd.

Economy and Tourism in Rwanda.

90% residents to 10% visitors across a year. 1,634,000 international arrivals in 2019 against 14,569,341 people who live here (2025, World Bank / UN Tourism).
Where a visitor dollar goes in Rwanda
1,634k
Visitors a year
0.1
Visitors per resident
How deep in debt is Rwanda?· for every $100 Rwanda earns in a year, it owes…
Pay to the order of: the creditorsmemo · the 1995 peak
$ 102The worst year on the IMF record. Rwanda owed $102 for every $100 it earned.
IMF World Economic Outlook, 1995signed, the creditors
Pay to the order of: the creditorsmemo · today
$ 67What is owed now, for every $100 of national income (2026).
IMF World Economic Outlook, 2026signed, the creditors
Pay to the order of: the creditorsmemo · projected 2031
$ 62The IMF's own forecast has this falling to $62 by 2031.
IMF World Economic Outlook projection, 2031signed, the forecast
For every $100 Rwanda earns in a year, it owes $67 (2026, IMF World Economic Outlook). The interest on that is paid before schools, clinics or coastline get their turn.
$Where does a tourist dollar actually go in Rwanda?
Play one tourist dollar around the board. Every square is a measured fact from this page.
START!
1
GO: a visitor lands
$100 goes on the table. 1,634,000 international arrivals in 2019 against 14,569,341 residents, one visitor a year for every 9 residents (World Bank / UN Tourism).
$100 in play
2
The bed
Who owns the largest places to stay in Rwanda is not published in the records we can check, so this square is left open rather than guessed. Where a listing names its owner, it is shown in the ownership table below.
not published
3
The plate
Food is 22.4% of everything Rwanda imports (2022, World Bank), so a large part of every restaurant bill is paid to a supplier abroad. Eating what the land here actually grows, bananas, cassava, sweet potatoes, plantains, potatoes, maize, beans, pumpkins/squash, taro, sorghum, keeps that money with the grower.
sails in
4
The power
59.9% of the electricity is renewable (2021, World Bank), so the energy on the bill is mostly generated inside the country rather than shipped in.
made at home
5
What actually stays
On the parts that can be measured, the plate leaves and the power stays. It is genuinely a coin toss, decided by what you book.
split
6
Pay the bank first
Rwanda owes $67 for every $100 it earns (IMF World Economic Outlook, 2026 projection). The interest is paid before anything else on this board.
$67 per $100
7
Community chest
Tourism earns 11% of everything Rwanda makes from exports (2020, World Bank / UN Tourism). That is how much of the economy depends on the game continuing.
11% of exports
8
The flight
Getting here is usually the biggest single line on the bill. From Los Angeles a return economy seat is 2.74 t CO2, on the UK Government's published conversion factors. It is the one part of the trip this board cannot reduce.
2.74 t CO2
9
Back to GO
The economy turns over about US$17 billion a year (IMF World Economic Outlook, 2026 projection). Every lap of this board is a choice about how much of it stays.
US$17bn
GDPUS$16.4bn
Agriculture, share of GDP20.3%
Visitors a year1,634,000
Visitors per resident0.1
Residents~14,569,341
Agriculture
Farming is 20.3% of the economy. Farming still employs about 35% of Rwandan workers (World Bank, 2025) on some of the most intensively cultivated land in Africa.
Natural materials
Natural-materials craft is genuinely alive here. Agaseke peace baskets are woven from sisal and sweetgrass and have become a national symbol, imigongo panels are made from cow dung and earth pigments, and banana fibre and papyrus are worked into mats and homeware.
Energy
About 60% of Rwanda's electricity is renewable (World Bank, 2021), from hydropower plus the unusual case of methane extracted from Lake Kivu. That is a good share but not a leading one, and only about 72% of Rwandans had electricity access as of 2024 (World Bank), so a lot of household energy is still charcoal and firewood, which is what shows up in the air quality figure.
Who owns the biggest hotels in Rwanda?
By rooms · company records and press.
Wilderness Bisate · ~6 roomsIndependentnot published
Visitors, over time
20141,220k
20151,298k
20161,377k
20171,570k
20181,711k
20191,634k
International tourism receipts run at about US$0.21 billion in 2020 (World Bank / UN Tourism). That is 11% of everything the country earns from exports.
How much of your money actually stays here?
Tap the holiday you are planning.

Visiting Rwanda, whoever you are.

Resort guest, villa renter, family, nomad or backpacker. The honest playbook for each, from the same sourced numbers.
Already booked a resort? · the rescue list
Five swaps that move your money back on-island
1. Eat where the country eats Choose kitchens cooking beans, sweet potato, cassava, plantain (igitoki), maize, sorghum and cooked greens (isombe) over imported menus.
2. Book with a local operator Never the lobby desk. The margin on a tour is the part that stays.
3. Stay somewhere locally owned Ownership decides where the room rate books. Eco stays
4. Use the transport residents use Kigali is compact and walkable; coaches between towns, moto-taxis in the city, 4x4 with a driver for the parks
5. Buy the craft, not the souvenir Natural-materials work made here pays the maker directly; imported gifts pay a shipping line.
Swipe
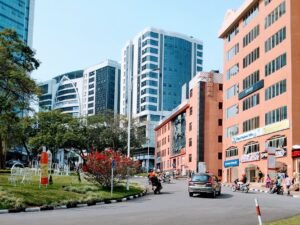
Vibrant cityscape of Kigali showcasing modern high-rise buildings on a sunny day.
First time here
A dense, hill-farmed country that banned plastic bags in 2008 and single-use plastics outright in 2019, mobilises the whole population for community work one Saturday a month, and protects the mountain gorillas of the Virungas. The honest gaps are air quality, thin protected area coverage and a grid still only two thirds renewable.
Best time: The long dry season, June to September
Getting around
Kigali is compact and walkable; coaches between towns, moto-taxis in the city, 4x4 with a driver for the parks
Transport is where the fare either stays or leaves.
Eating here
The everyday plate is beans, sweet potato, cassava, plantain (igitoki), maize, sorghum and cooked greens (isombe). Everyday Rwandan food is plant-led almost by default: beans and sweet potato at most meals, plus cassava, plantain, maize, sorghum and isombe (cassava leaves).
Eating what the country grows is the cheapest way to cut the import bill.
Good to know
Mobile money is everywhere; RWF. Plastic bags are illegal and bags are searched at the airport. Gorilla permits are limited and sell out ahead.
Rate my hotel. Tap yours for the honest verdict.
Ownership from company records and press.
Who owns the place to stay
Wilderness BisateIndependent · 6 rooms
The one property listed here does not publish who ultimately owns it, so no claim is made either way. Ownership is what decides how much of a room rate stays in the country, which is why we show it when a listing states it.

Society and Governance in Rwanda.

How well is Rwanda actually run?
Governance, measured · World Bank WGI
Four measured answers, none of them opinion. Averaged across corruption control, delivery and accountability, Rwanda scores 55 out of 100 (2024, World Bank Worldwide Governance Indicators). That matters here because every pledge on this page is only as good as the machinery meant to deliver it.
What is daily life in Rwanda really like? Measured
Getting around, breathing, throwing away, learning. The honest checklist.
TransportAirWaterWastePower
✓How you get around Kigali is compact and walkable; coaches between towns, moto-taxis in the city, 4x4 with a driver for the parks
78.8%
literacy. Public spending on education runs at 4.6% of GDP and 13.9% of all government spending, and secondary enrolment stands at 48.8% gross (UNESCO Institute for Statistics, 2024 to 2025).

Made in Rwanda.

Natural-materials craft is genuinely alive here. Agaseke peace baskets are woven from sisal and sweetgrass and have become a national symbol, imigongo panels are made from cow dung and earth pigments, and banana fibre and papyrus are worked into mats and homeware. Every step of processing done at home is value that stops leaving the country.
What Rwanda actually sells the world
NISR figures show Rwanda earned about US$1.59 billion from domestic goods exports in 2025, down from about US$2.31 billion in 2024, while it spent about US$5.54 billion on imports, roughly three and a half times as much. Most of the fall came from the category NISR lists as other commodities and transactions, which dropped from US$438 million in the last quarter of 2024 to US$53 million a year later. In the last quarter of 2025 food and live animals was the largest export group at US$115 million, followed by crude materials at US$108 million. The top export markets that quarter were the DR Congo, China, the United Arab Emirates, Egypt and Uganda.
Made now · natural materials
Sweetgrass
Worked in Rwanda from local material, and still a working craft rather than a museum piece.
Made now · natural materials
Earth pigments
Worked in Rwanda from local material, and still a working craft rather than a museum piece.
Made now · natural materials
Banana fibre
Worked in Rwanda from local material, and still a working craft rather than a museum piece.
Could make · grown here already
Beans
Grown in Rwanda and mostly sold raw. Processing it here would keep the margin here.
Could make · grown here already
Sweet potato
Grown in Rwanda and mostly sold raw. Processing it here would keep the margin here.
Could make · grown here already
Cassava
Grown in Rwanda and mostly sold raw. Processing it here would keep the margin here.
The maths for an entrepreneur. Rwanda produces about US$16 billion a year, which is roughly US$1,124 per person (2025, World Bank). Farming is 20.3% of that, while food is 22.4% of everything the country imports. The country buys in more food than its own farms contribute to the economy, and every point of that gap is a business someone could build here rather than ship in. With 47% of the land arable, the raw material for that is already in the ground.
See the verified makers

Culture in Rwanda.

Intore warrior dance
Dance once performed only for the royal court by trained dancers, known as the chosen ones, who wear grass wigs and carry spears. UNESCO inscribed it as intangible heritage in 2024.
Ingoma royal drumming
An ensemble of eight to ten drummers, each with their own ingoma drum. Drums of this shape once played an important part in the cult of the king.
Imigongo cow-dung geometric art from the east
Cow dung paintings in black, brown and white whirls and geometric shapes, made by a co-operative in Nyakarambi near the Tanzanian border.
Agaseke peace baskets
Woven baskets, also called peace pots, used to store food and medicines and given to mark weddings or welcome guests.
since 2005Once a year. The 2026 ceremony was held on 4 September.Kwita IzinaRwanda names its newborn mountain gorillas at the foothills of Volcanoes National Park, modelled on the tradition of naming children before family and friends.
Does Rwanda protect its heritage by law?
Partly, and the gaps say as much as the protections.
What is kept alive. Living heritage is strong and actively practised, not archived. Intore dance and ingoma drumming are performed by working troupes, imigongo geometric art is a distinct regional tradition still made in the east, and agaseke basketry carries real cultural weight. Kwita Izina, the annual gorilla naming ceremony, has become a genuine national event rather than a tourist set piece.
Who it belongs to. Rwanda has an unusually strong civic culture around the environment. Umuganda brings the whole adult population out for community work on the last Saturday of every month, and much of that work is drainage, tree planting and clearing. Tourism revenue sharing sends a fixed share of park income to communities around Volcanoes and Nyungwe, which is why anti-poaching has local backing.
Only here. Umuganda, mandatory nationwide community work on the last Saturday of every month, 08:00 to 11:00.

The Future of Rwanda.

Three futures for Rwanda, every one run forward from measured data.
Where the making actually happens
Named cultural and craft sites on the open map: Campaign Against Genocide Museum (City of Kigali), Kandt House Museum (City of Kigali), Ethnographic Museum (Southern Province), Rwanda Art Museum (City of Kigali), Parking of National Museum of Rwanda (Southern Province). OpenStreetMap.
Every measured trend on one line
Run forward at the pace already recorded.
+52%
Forest cover
1995: 17.1% to 2024: 26.1%
1995202426.1%
-6%
Renewable electricity
2000: 63.5% to 2021: 59.9%
2000202159.9%
+96%
CO2 per person
1995: 0.083 t to 2024: 0.16 t
199520240.2 t
+208%
Tourist arrivals
2006: 531k to 2019: 1,634k
200620191,634k
-15%
Protected land
2013: 10.7% to 2025: 9.1%
201320259.1%
-56%
Farm workforce
1995: 80.4% to 2025: 35.1%
1995202535.1%
+16%
Agricultural land
1995: 65.2% to 2024: 75.7%
1995202475.7%
+251%
Urban population
1995: 8.82% to 2025: 30.9%
1995202530.9%
-8%
Air pollution
1995: 39.1 µg/m³ to 2023: 36 µg/m³
1995202336 µg/m³
-58%
Fresh water per person
1995: 1,674 m³ to 2022: 696 m³
19952022695.9 m³
+164%
Adult overweight
1995: 7.5% to 2022: 19.8%
1995202219.8%
+6905%
Electricity access
1997: 1.03% to 2024: 72%
1997202472%
+393%
GDP per person
1995: 228 to 2025: 1,124
199520251,123.7
+157%
Population
1995: 5,674k to 2025: 14,569k
1995202514,569.3k
-10%
Renewable energy use
1995: 88.4% to 2022: 79.9%
1995202279.9%
-71%
Energy per person
1995: 1,242 kg to 2024: 359 kg
19952024359.5 kg
-15%
Protected area, total
2013: 10.7% to 2025: 9.1%
201320259.1%
+64%
Life expectancy
1995: 41.5 yrs to 2024: 68 yrs
1995202468 yrs
+57%
Cereal yield
1995: 1,140 kg/ha to 2024: 1,784 kg/ha
199520241,784 kg/ha
+7835%
Fertiliser use
1996: 0.4 kg/ha to 2024: 31.7 kg/ha
1996202431.7 kg/ha
-24%
Rural population
1995: 91.2% to 2025: 69.1%
1995202569.1%
+16%
Water productivity
2000: 18.1 $/m3 to 2022: 20.9 $/m3
2000202220.9 $/m3
+43%
Health spending
2000: 3.58% to 2023: 5.13%
200020235.1%
+50%
Forest area
1995: 4,230 km2 to 2025: 6,346 km2
199520256,346.3 km2
+178%
Electric power use
1995: 28.6 kWh to 2024: 79.3 kWh
1995202479.3 kWh
+122%
Emissions: Agriculture
1990: 1.39 MtCO2e to 2023: 3.09 MtCO2e
199020233.1 MtCO2e
+84%
Emissions: Building
1990: 1.59 MtCO2e to 2023: 2.92 MtCO2e
199020232.9 MtCO2e
+125%
Emissions: Energy
1990: 2.08 MtCO2e to 2023: 4.69 MtCO2e
199020234.7 MtCO2e
+1667%
Emissions: Industrial Processes
1990: 0.03 MtCO2e to 2023: 0.53 MtCO2e
199020230.5 MtCO2e
+255%
Emissions: Manufacturing/Construction
1990: 0.11 MtCO2e to 2023: 0.39 MtCO2e
199020230.4 MtCO2e
+139%
Emissions: Transportation
1990: 0.36 MtCO2e to 2023: 0.86 MtCO2e
199020230.9 MtCO2e
World Bank open data, recorded series
How much forest is left?
1995202426.1%
Forest cover moved from 17.1% to 26.1% across 29 recorded years.
How clean is the grid?
2000202159.9%
Renewable electricity moved from 63.5% to 59.9% across 21 recorded years.
How much climate pollution per person?
199520240.2 t
CO2 per person moved from 0.083 t to 0.16 t across 29 recorded years.
How many people visit?
200620191,634k
Tourist arrivals moved from 531k to 1,634k across 13 recorded years.
How much land is protected?
201320259.1%
Protected land moved from 10.7% to 9.1% across 12 recorded years.
How many people still farm?
1995202535.1%
Farm workforce moved from 80.4% to 35.1% across 30 recorded years.
How much land is farmed?
1995202475.7%
Agricultural land moved from 65.2% to 75.7% across 29 recorded years.
How fast is it urbanising?
1995202530.9%
Urban population moved from 8.82% to 30.9% across 30 recorded years.
Is the air getting cleaner?
1995202336 µg/m³
Air pollution moved from 39.1 µg/m³ to 36 µg/m³ across 28 recorded years.
Is water getting scarcer?
19952022695.9 m³
Fresh water per person moved from 1,674 m³ to 696 m³ across 27 recorded years.
Is diet-related disease rising?
1995202219.8%
Adult overweight moved from 7.5% to 19.8% across 27 recorded years.
Who has power?
1997202472%
Electricity access moved from 1.03% to 72% across 27 recorded years.
Is income rising?
199520251,123.7
GDP per person moved from 228 to 1,124 across 30 recorded years.
How fast is it growing?
1995202514,569.3k
Population moved from 5,674k to 14,569k across 30 recorded years.
What share of all energy is renewable?
1995202279.9%
Renewable energy use moved from 88.4% to 79.9% across 27 recorded years.
How much energy does one person use?
19952024359.5 kg
Energy per person moved from 1,242 kg to 359 kg across 29 recorded years.
How much land and sea is protected together?
201320259.1%
Protected area, total moved from 10.7% to 9.1% across 12 recorded years.
How long do people live?
1995202468 yrs
Life expectancy moved from 41.5 yrs to 68 yrs across 29 recorded years.
How much does a hectare of cereal produce?
199520241,784 kg/ha
Cereal yield moved from 1,140 kg/ha to 1,784 kg/ha across 29 recorded years.
How much fertiliser goes on the land?
1996202431.7 kg/ha
Fertiliser use moved from 0.4 kg/ha to 31.7 kg/ha across 28 recorded years.
How many people still live rurally?
1995202569.1%
Rural population moved from 91.2% to 69.1% across 30 recorded years.
How much value per cubic metre of water?
2000202220.9 $/m3
Water productivity moved from 18.1 $/m3 to 20.9 $/m3 across 22 recorded years.
How much goes on health?
200020235.1%
Health spending moved from 3.58% to 5.13% across 23 recorded years.
How much forest is there in total?
199520256,346.3 km2
Forest area moved from 4,230 km2 to 6,346 km2 across 30 recorded years.
How much electricity per person?
1995202479.3 kWh
Electric power use moved from 28.6 kWh to 79.3 kWh across 29 recorded years.
How have agriculture emissions moved?
199020233.1 MtCO2e
Agriculture emissions moved from 1.39 to 3.09 MtCO2e across 33 recorded years.
Climate Watch (WRI), historical emissions
How have building emissions moved?
199020232.9 MtCO2e
Building emissions moved from 1.59 to 2.92 MtCO2e across 33 recorded years.
Climate Watch (WRI), historical emissions
How have energy emissions moved?
199020234.7 MtCO2e
Energy emissions moved from 2.08 to 4.69 MtCO2e across 33 recorded years.
Climate Watch (WRI), historical emissions
How have industrial processes emissions moved?
199020230.5 MtCO2e
Industrial Processes emissions moved from 0.03 to 0.53 MtCO2e across 33 recorded years.
Climate Watch (WRI), historical emissions
How have manufacturing/construction emissions moved?
199020230.4 MtCO2e
Manufacturing/Construction emissions moved from 0.11 to 0.39 MtCO2e across 33 recorded years.
Climate Watch (WRI), historical emissions
How have transportation emissions moved?
199020230.9 MtCO2e
Transportation emissions moved from 0.36 to 0.86 MtCO2e across 33 recorded years.
Climate Watch (WRI), historical emissions
Worst caseCurrent pathBest case
Worst case
Every measured decline continues at the pace already recorded. The weakest pillar, food and farming at 1/5, is the one that gives way first.
Computed from: recorded series extended with no policy change
What the best case actually asks for
Lift food and farming
It scores 1 out of 5 today, among the weakest parts of Rwanda's record. Farming still employs about 35% of Rwandan workers (World Bank, 2025) on some of the most intensively cultivated land in Africa.
measured each year
Costs: spending and enforcement, not new technology
Lift organic farming
It scores 2 out of 5 today, among the weakest parts of Rwanda's record. There is no reliable published figure for certified organic farmland in Rwanda, so this pillar is scored on practice rather than certification.
measured each year
Costs: spending and enforcement, not new technology
Lift conservation
It scores 2 out of 5 today, among the weakest parts of Rwanda's record. About 9.1% of Rwanda's land is protected (World Bank, 2025), which is thin by regional standards and reflects how little spare land a country this densely farmed has.
measured each year
Costs: spending and enforcement, not new technology

Government and Goals in Rwanda.

Who is in charge of Rwanda now · Office-holders from the UN Protocol and Liaison Service public list of Heads of State and Heads of Government, 20 October 2026. Legislature and election dates from IFES ElectionGuide. Constitution dates from the Constitute Project. Governance scores from the World Bank Worldwide Governance Indicators 2024.
Justin Nsengiyumva
Prime Minister
Justin Nsengiyumva is the head of government of Rwanda, in office since 23 July 2025. Every climate, protection and energy pledge on this page is delivered, or not, under this administration.
Public opinion, measured
Voice and accountability, the freedom to question government scores 43.7 out of 100 in 2025. On this World Bank scale, 100 is the strongest governance measured. Down from 44.0 in 2024. World Bank Worldwide Governance Indicators, 2025 data (updated 25 September 2026)
Control of corruption scores 60.9 out of 100 in 2025. On this World Bank scale, 100 is the strongest governance measured. Up from 60.5 in 2024. World Bank Worldwide Governance Indicators, 2025 data (updated 25 September 2026)
Political stability and absence of violence scores 67.7 out of 100 in 2025. On this World Bank scale, 100 is the strongest governance measured. Up from 64.5 in 2024. World Bank Worldwide Governance Indicators, 2025 data (updated 25 September 2026)
Rule of law scores 60.2 out of 100 in 2025. On this World Bank scale, 100 is the strongest governance measured. Up from 60.1 in 2024. World Bank Worldwide Governance Indicators, 2025 data (updated 25 September 2026)
Regulatory quality scores 59.9 out of 100 in 2025. On this World Bank scale, 100 is the strongest governance measured. Down from 60.0 in 2024. World Bank Worldwide Governance Indicators, 2025 data (updated 25 September 2026)
Justin NsengiyumvaPrime Minister
Parlement (Parliament)Legislature, bicameral
Last election15 July 2024
Constitution2003, as revised to 2015
Government typepresidential republic
Rwanda national goals: climate commitments on record · as recorded by Climate Watch, World Resources Institute
2050
Net zero
In Political Pledge
Net-zero target as recorded by Climate Watch. Status: In Political Pledge (11/2/2021) Source
Gases covered
Unclear or Undecided Source
Sectors covered
Unclear or Undecided Source
International offsets
Unclear or Undecided Source

Plain Answers About Rwanda.

The questions people actually type, answered in full sentences from the sourced data above.
Swipe
Is Rwanda sustainable?
Rwanda scores 57 out of 100 on the Throne Eco Index, across twelve equally weighted pillars. A dense, hill-farmed country that banned plastic bags in 2008 and single-use plastics outright in 2019, mobilises the whole population for community work one Saturday a month, and protects the mountain gorillas of the Virungas. The honest gaps are air quality, thin protected area coverage and a grid still only two thirds renewable.
Is the water in Rwanda safe and plentiful?
Rwanda is well watered for its size, fed by reliable rainfall across the hills, Lake Kivu and the headwaters that feed the Nile basin, so raw supply is rarely the binding constraint. The gap is treatment and delivery: tap water is not drinkable anywhere, and rural households still walk for it. Steep terrain also means heavy rain moves soil into rivers, which is what the terracing programmes are fighting.
Can Rwanda feed itself?
Farming still employs about 35% of Rwandan workers (World Bank, 2025) on some of the most intensively cultivated land in Africa. The country grows most of what it eats on smallholdings, terraced up hillsides, and beans, sweet potato, cassava, plantain and maize carry the everyday plate. Land pressure is the honest constraint: plots are small and getting smaller.
Is it easy to eat plant-based in Rwanda?
Everyday Rwandan food is plant-led almost by default: beans and sweet potato at most meals, plus cassava, plantain, maize, sorghum and isombe (cassava leaves). Meat is occasional rather than daily for most households. A visitor eating what Rwandans eat is eating plants, and Kigali now has explicit vegetarian and vegan kitchens on top of that.
How much of Rwanda is actually protected?
About 9.1% of Rwanda's land is protected (World Bank, 2025), which is thin by regional standards and reflects how little spare land a country this densely farmed has. What is protected is significant: Volcanoes National Park in the Virungas, Nyungwe National Park, inscribed on the UNESCO World Heritage List in September 2023 as one of Rwanda's first two World Heritage Sites, and Akagera, where African Parks has restored lion and rhino to a savannah that had lost them.
What wildlife is left in Rwanda?
Rwanda holds a share of the world's remaining mountain gorillas in Volcanoes National Park, alongside golden monkeys in the same forest and chimpanzees and thirteen primate species in Nyungwe. Akagera has been rebuilt into a Big Five park. Set against that, 185 species are listed as threatened (World Bank, 2022), the great majority of them plants, which is what intensive hillside cultivation does to a flora.
Is Rwanda on clean energy?
About 60% of Rwanda's electricity is renewable (World Bank, 2021), from hydropower plus the unusual case of methane extracted from Lake Kivu. That is a good share but not a leading one, and only about 72% of Rwandans had electricity access as of 2024 (World Bank), so a lot of household energy is still charcoal and firewood, which is what shows up in the air quality figure.
How polluted is Rwanda?
This is the sharpest split on the page. Rwanda has arguably the world's strictest plastic policy: bags were banned in 2008 and Law 17/2019 extended it to single-use plastics, with bags searched for at the border. Kigali is repeatedly named among Africa's cleanest cities.
Does recycling work in Rwanda?
Formal municipal recycling is limited and most recovery is informal, though Rwanda's plastic ban means far less of the packaging that dominates waste streams elsewhere ever enters the country. Kigali runs organised collection and the city is visibly clean; what is weak is what happens after collection, with landfill still the endpoint for most of it.
Is the farming in Rwanda organic?
There is no reliable published figure for certified organic farmland in Rwanda, so this pillar is scored on practice rather than certification. In practice most Rwandan smallholdings are low-input by economics rather than by choice, with limited access to synthetic fertiliser, but there is no national certifier and no organic premium reaching farmers at scale.
Are there natural materials and craft in Rwanda?
Natural-materials craft is genuinely alive here. Agaseke peace baskets are woven from sisal and sweetgrass and have become a national symbol, imigongo panels are made from cow dung and earth pigments, and banana fibre and papyrus are worked into mats and homeware. What is missing is a domestic textile industry at scale, so most clothing is imported.
Is there living culture in Rwanda?
Rwanda has an unusually strong civic culture around the environment. Umuganda brings the whole adult population out for community work on the last Saturday of every month, and much of that work is drainage, tree planting and clearing. Tourism revenue sharing sends a fixed share of park income to communities around Volcanoes and Nyungwe, which is why anti-poaching has local backing.
What heritage does Rwanda keep alive?
Living heritage is strong and actively practised, not archived. Intore dance and ingoma drumming are performed by working troupes, imigongo geometric art is a distinct regional tradition still made in the east, and agaseke basketry carries real cultural weight. Kwita Izina, the annual gorilla naming ceremony, has become a genuine national event rather than a tourist set piece.
So is Rwanda actually green? The measured answer
What is working: renewable electricity at 59.9%.
What is not: land protected at 9.1% against a 30% mark.

How Rwanda Ranks, region and world.

Where Rwanda sits on the Eco Index, against its Africa neighbours and the 77 destinations scored worldwide.
How does Rwanda compare in Africa?
Scored Africa destinations, Eco Index.
The global top 10 of the 77 destinations scored
10Spain73
Rwanda sits 65 of 77 at 57/100. Every name links to its own destination page, built exactly like this one. The full ranking
What is Rwanda particularly good at?
✓ Heritage, scored 5/5. Living heritage is strong and actively practised, not archived. Intore dance and ingoma drumming are performed by working troupes, imigongo geometric art is a distinct regional tradition still made in the east, and agaseke basketry carries real cultural weight. Kwita Izina, the annual gorilla naming ceremony, has become a genuine national event rather than a tourist set piece.
✓ Plant-based eating, scored 4/5. Everyday Rwandan food is plant-led almost by default: beans and sweet potato at most meals, plus cassava, plantain, maize, sorghum and isombe (cassava leaves). Meat is occasional rather than daily for most households. A visitor eating what Rwandans eat is eating plants, and Kigali now has explicit vegetarian and vegan kitchens on top of that.
✓ Wildlife, scored 4/5. Rwanda holds a share of the world's remaining mountain gorillas in Volcanoes National Park, alongside golden monkeys in the same forest and chimpanzees and thirteen primate species in Nyungwe. Akagera has been rebuilt into a Big Five park. Set against that, 185 species are listed as threatened (World Bank, 2022), the great majority of them plants, which is what intensive hillside cultivation does to a flora.
Where does Rwanda score worst?
✕ Food and farming, scored 1/5. Farming still employs about 35% of Rwandan workers (World Bank, 2025) on some of the most intensively cultivated land in Africa. The country grows most of what it eats on smallholdings, terraced up hillsides, and beans, sweet potato, cassava, plantain and maize carry the everyday plate. Land pressure is the honest constraint: plots are small and getting smaller.
✕ Organic farming, scored 2/5. There is no reliable published figure for certified organic farmland in Rwanda, so this pillar is scored on practice rather than certification. In practice most Rwandan smallholdings are low-input by economics rather than by choice, with limited access to synthetic fertiliser, but there is no national certifier and no organic premium reaching farmers at scale.
✕ Conservation, scored 2/5. About 9.1% of Rwanda's land is protected (World Bank, 2025), which is thin by regional standards and reflects how little spare land a country this densely farmed has. What is protected is significant: Volcanoes National Park in the Virungas, Nyungwe National Park, inscribed on the UNESCO World Heritage List in September 2023 as one of Rwanda's first two World Heritage Sites, and Akagera, where African Parks has restored lion and rhino to a savannah that had lost them.
A note from the lens of mother natureSwipe
Food and farming, 1/5
Farming still employs about 35% of Rwandan workers (World Bank, 2025) on some of the most intensively cultivated land in Africa. The country grows most of what it eats on smallholdings, terraced up hillsides, and beans, sweet potato, cassava, plantain and maize carry the everyday plate.
Consequence: It is the lowest-scoring part of Rwanda's record, so it is where the score moves first.
Organic farming, 2/5
There is no reliable published figure for certified organic farmland in Rwanda, so this pillar is scored on practice rather than certification.
Conservation, 2/5
About 9.1% of Rwanda's land is protected (World Bank, 2025), which is thin by regional standards and reflects how little spare land a country this densely farmed has.

The Rwanda Directory.

Everything on Hold The Throne that sits in Rwanda, checked and listed.
How the rest of the world scores Rwanda
Independent global indices, for calibration.
Forest cover
26.1
World Bank, 2024.
Protected land
9.1
World Bank, 2025.
Renewable grid
59.9
World Bank, 2021.
CO2 per person
0.16 t (2024)
World Bank, 2024.
Threatened species
185 (mammals, birds, fish & plants)
Recorded figure, sourced on this page.
Control of corruption
60.9 / 100
World Bank Worldwide Governance Indicators, 2025. Score from 0 to 100, where 100 is the strongest governance.
Government effectiveness
59.7 / 100
World Bank Worldwide Governance Indicators, 2025. Score from 0 to 100, where 100 is the strongest governance.
Rule of law
60.2 / 100
World Bank Worldwide Governance Indicators, 2025. Score from 0 to 100, where 100 is the strongest governance.
Political stability
67.7 / 100
World Bank Worldwide Governance Indicators, 2025. Score from 0 to 100, where 100 is the strongest governance.
Voice and accountability
43.7 / 100
World Bank Worldwide Governance Indicators, 2025. Score from 0 to 100, where 100 is the strongest governance.
Environmental Performance Index
26.4 / 100 · 167 of 177
Yale Environmental Performance Index 2026, ranked 167 of 177 countries assessed.
Ecosystem vitality
27.8 / 100 · 161 of 177
Yale Environmental Performance Index 2026, ranked 161 of 177 countries assessed.
Biodiversity and habitat
34.3 / 100 · 122 of 177
Yale Environmental Performance Index 2026, ranked 122 of 177 countries assessed.
Air quality
24.1 / 100 · 140 of 177
Yale Environmental Performance Index 2026, ranked 140 of 177 countries assessed.
Terrestrial biomes protected
29.8 / 100 · 138 of 177
Yale Environmental Performance Index 2026, ranked 138 of 177 countries assessed.

How Rwanda Is Scored. The Throne Standard.

Every destination on the index is scored the same way, so a 4 in Barbados means exactly what a 4 means in Iceland. No self-declared data and no brochure claims are accepted. Seven pillars are scored from published measurements with the same fixed thresholds everywhere: energy (low-carbon share of electricity, 90% or more scores 5, 70% 4, 50% 3, 25% 2), conservation (land and sea protected), water (safe drinking water, wastewater treated, water stress), organic farmland, recycling, food import dependence and air quality. Where a measurement is not published for a place, that pillar keeps its source-assessed score and is labelled as such. Wildlife, culture, heritage, materials and plant-based eating have no comparable measurement and are assessed from the named sources. The Eco Index is the average of the twelve pillar scores multiplied by 20. Every figure on this page carries its named source and year, and the history on each page names what empire took as plainly as it scores the present.
The 12 pillars every destination is scored on, equally weighted
01
Water
Safe drinking water, wastewater treated and water stress. Measured.
02
Food & farming
How much of the import bill is food: whether the place feeds itself. Measured.
03
Plant-based
How easy it is to eat plant-based, from documented sources.
04
Organic
Certified organic share of farmland. Measured.
05
Conservation
Land and sea legally protected, against the 30 by 30 goal. Measured.
06
Wildlife
What survives, what is endemic, what is lost, from documented sources.
07
Materials
Local natural fibres and craft, from documented sources.
08
Pollution
Air quality (PM2.5, measured) and plastics and waste policy.
09
Recycling
Share of municipal waste recycled. Measured.
10
Energy
Low-carbon share of electricity, nuclear included. Measured.
11
Culture
Living culture and community-led visits, from documented sources.
12
Heritage
What the law keeps standing, from documented sources.
What each 0 to 5 pillar score means, in plain words
0
Absent
nothing verifiable exists
1
Failing
measurably going the wrong way
2
Weak
claims outrun delivery
3
Fair
real effort, mixed results
4
Strong
genuinely good, evidence named
5
Leading
world class, and the trend holds
Where the numbers come from.
World Bank logo
FAO logo
IUCN logo
UNESCO logo
BirdLife International logo
UNEP-WCMC logo
Climate Watch (WRI) logo
UN SDG Global Database logo
The institutions above are the ones cited on this page, ranked by how many of its figures they carry. This same sectioned page renders for all 77 scored destinations, each with its own researched history, comparison charts and three-way future. Read the full methodology
Every figure on this page, and where it came from: 70 sources across 18 institutions
Other published sources26 FIGURES
  • The only published radiocarbon dates for the Mutwarubona furnaces are Ly-2667 at 2020 +/- 330 BP and Ly-2668 at 1380 +/- 170 BP (calibrated AD 245 to 1005), which the excavator places in a range of 1 BC to AD 700, roughly a thousand years later than the page claims and not among the oldest in sub-equatorial Africa check
  • The academic literature says Rwanda's 2008 action was 'among the strictest in the continent'; no source found supports a world ranking check
  • Law n° 53/2007 establishing Community Works in Rwanda (Umuganda), Official Gazette n° 2 of 15 January 2008, on RwandaLII, A dense, hill-farmed country that banned plastic bags in 2008 and single-use plastics outright in 2019, mobili check
  • Law n° 53/2007 establishing Community Works in Rwanda (Umuganda), Official Gazette n° 2 of 15 January 2008, on RwandaLII corroboration check
  • Law n° 53/2007 establishing Community Works in Rwanda (Umuganda), Official Gazette n° 2 of 15 January 2008, on RwandaLII corroboration check
  • Law n° 53/2007 establishing Community Works in Rwanda (Umuganda), Official Gazette n° 2 of 15 January 2008, on RwandaLII corroboration check
  • GBIF occurrence records for Gorilla beringei (eastern gorilla) in Rwanda, Critically Endangered on the IUCN Red List, and recorded in Rwanda in GBIF occurrence data (mammal). check
  • GBIF occurrence records for Gorilla beringei (eastern gorilla) in Rwanda corroboration check
  • GBIF occurrence records for Gorilla beringei (eastern gorilla) in Rwanda corroboration check
  • GBIF occurrence records for Gorilla beringei (eastern gorilla) in Rwanda corroboration check
  • GBIF occurrence records for Necrosyrtes monachus (hooded vulture) in Rwanda, Critically Endangered on the IUCN Red List, and recorded in Rwanda in GBIF occurrence data (bird). check
  • GBIF occurrence records for Necrosyrtes monachus (hooded vulture) in Rwanda corroboration check
  • GBIF occurrence records for Necrosyrtes monachus (hooded vulture) in Rwanda corroboration check
  • GBIF occurrence records for Necrosyrtes monachus (hooded vulture) in Rwanda corroboration check
  • GBIF occurrence records for Stemodiopsis ruandensis in Rwanda, Critically Endangered on the IUCN Red List, and recorded in Rwanda in GBIF occurrence data (plant). check
  • GBIF occurrence records for Stemodiopsis ruandensis in Rwanda corroboration check
  • GBIF occurrence records for Stemodiopsis ruandensis in Rwanda corroboration check
  • GBIF occurrence records for Stemodiopsis ruandensis in Rwanda corroboration check
  • GBIF occurrence records for Loxodonta africana (African savanna elephant) in Rwanda, Endangered on the IUCN Red List, and recorded in Rwanda in GBIF occurrence data (mammal). check
  • GBIF occurrence records for Loxodonta africana (African savanna elephant) in Rwanda corroboration check
  • GBIF occurrence records for Loxodonta africana (African savanna elephant) in Rwanda corroboration check
  • GBIF occurrence records for Loxodonta africana (African savanna elephant) in Rwanda corroboration check
  • ICOMOS Advisory Body Evaluation of the nomination 'Memorial sites of the Genocide: Nyamata, Murambi, Gisozi and Bisesero' (Rwanda), UNESCO World Heritage Centre, 2023, recording the State Party of Rwanda's own submission, Belgium took it during the First World War and issued identity cards that fixed ethnic classification by law. check
  • ICOMOS Advisory Body Evaluation of the nomination 'Memorial sites of the Genocide: Nyamata, Murambi, Gisozi and Bisesero' (Rwanda), UNESCO World Heritage Centre, 2023, recording the State Party of Rwanda's own submission corroboration check
  • ICOMOS Advisory Body Evaluation of the nomination 'Memorial sites of the Genocide: Nyamata, Murambi, Gisozi and Bisesero' (Rwanda), UNESCO World Heritage Centre, 2023, recording the State Party of Rwanda's own submission corroboration check
  • ICOMOS Advisory Body Evaluation of the nomination 'Memorial sites of the Genocide: Nyamata, Murambi, Gisozi and Bisesero' (Rwanda), UNESCO World Heritage Centre, 2023, recording the State Party of Rwanda's own submission corroboration check
World Bank19 FIGURES
  • Forest area (% of land area) AG.LND.FRST.ZS, 2023 check
  • Terrestrial protected areas (% of total land area) ER.LND.PTLD.ZS, 2025 check
  • Renewable electricity output (% of total) EG.ELC.RNEW.ZS, 2021 check
  • CO2 emissions per capita EN.GHG.CO2.PC.CE.AR5, 2024 check
  • PM2.5 air pollution mean annual exposure EN.ATM.PM25.MC.M3, 2023 check
  • Threatened species (mammals EN.MAM.THRD.NO, birds EN.BIR.THRD.NO, fish EN.FSH.THRD.NO, higher plants EN.HPT.THRD.NO), 2022 check
  • Employment in agriculture (% of total employment) SL.AGR.EMPL.ZS, 2025 check
  • Access to electricity (% of population) EG.ELC.ACCS.ZS, 2024 check
  • GDP (current US$) NY.GDP.MKTP.CD, 2025 check
  • International tourist arrivals ST.INT.ARVL, 2019 check
  • Agricultural land (% of land area) AG.LND.AGRI.ZS, 2023 check
  • Arable land (% of land area) AG.LND.ARBL.ZS, 2023 check
  • Agriculture, value added (% of GDP) NV.AGR.TOTL.ZS, 2025 check
  • Adult literacy rate SE.ADT.LITR.ZS, 2022 check
  • Renewable internal freshwater per capita (m3) ER.H2O.INTR.PC, 2022 check
  • Overweight prevalence, adults (%) SH.STA.OWAD.ZS, 2022 check
  • Central government debt (% of GDP) GC.DOD.TOTL.GD.ZS, 1992 check
  • Population total SP.POP.TOTL, 2025 check
  • What a Waste 2.0 country-level dataset check
Rwanda Development Board4 FIGURES
  • national parks and tourism check
  • Visit Rwanda: Gorilla Tracking corroboration check
  • Visit Rwanda: Gorilla Tracking corroboration check
  • Visit Rwanda: Gorilla Tracking corroboration check
UNESCO Institute for Statistics3 FIGURES
  • public data API, indicators XGDP.FSGOV, XGOVEXP.IMF and GER.2T3 for Rwanda, Public spending on education runs at 4.6% of GDP and 13.9% of all government spending, and secondary enrolment check
  • public data API, indicators XGDP.FSGOV, XGOVEXP.IMF and GER.2T3 for Rwanda corroboration check
  • public data API, indicators XGDP.FSGOV, XGOVEXP.IMF and GER.2T3 for Rwanda corroboration check
BirdLife International, IUCN and UNEP-WCMC2 FIGURES
  • UN SDG Global Database, terrestrial Key Biodiversity Areas covered by protected areas (%) ER_PTD_TERR, Rwanda, 2025 (37.1%), country-reported check
  • UN SDG Global Database, freshwater Key Biodiversity Areas covered by protected areas (%) ER_PTD_FRHWTR, Rwanda, 2025 (26.9%), country-reported check
FAO2 FIGURES
  • FAOSTAT Crops and livestock products (QCL), Africa bulk dataset, release of 23 December 2025, By tonnage, the largest crops grown in Rwanda are bananas, sweet potatoes, cassava, potatoes and maize (FAO, F check
  • FAOSTAT Crops and livestock products (QCL), Africa bulk dataset, release of 23 December 2025 corroboration check
FAO, Global Forest Resources Assessment2 FIGURES
  • UN SDG Global Database, forest area (% of land area) AG_LND_FRST, Rwanda, 2025 (25.7%), country-reported check
  • UN SDG Global Database, forest area inside legally established protected areas (%) AG_LND_FRSTPRCT, Rwanda, 2025 (45.8%), country-reported check
IUCN2 FIGURES
  • The IUCN Red List of Threatened Species (categories explained), Critically Endangered, the last IUCN category before Extinct in the Wild, and still recorded in Rwanda. check
  • The IUCN Red List of Threatened Species (categories explained) corroboration check
Climate Watch (WRI)1 FIGURE
Constitute Project1 FIGURE
  • Rwanda 2003 (rev. 2015) check
IFES ElectionGuide1 FIGURE
  • Rwanda elections and chambers check
National Institute of Statistics of Rwanda1 FIGURE check
Republic of Rwanda1 FIGURE
  • Law n° 17/2019 of 10/08/2019 prohibiting plastic carry bags and single-use plastic items check
Rwanda Environment Management Authority (REMA)1 FIGURE check
UN Protocol and Liaison Service1 FIGURE
  • Heads of State, Heads of Government and Ministers for Foreign Affairs, public list dated 20 October 2026 check
UN Statistics Division, Energy Balances1 FIGURE
  • UN SDG Global Database, renewable share of total final energy consumption (%) EG_FEC_RNEW, Rwanda, 2024 (75.3%), modelled estimate check
UNESCO1 FIGURE
  • Nyungwe National Park inscribed 19 September 2023 check
University of Rwanda1 FIGURE
  • national research institution check